
- Title
-
Evolutionary recruitment of flexible Esrp-dependent splicing programs into diverse embryonic morphogenetic processes
- Authors
- Burguera, D., Marquez, Y., Racioppi, C., Permanyer, J., Torres-Méndez, A., Esposito, R., Albuixech-Crespo, B., Fanlo, L., D'Agostino, Y., Gohr, A., Navas-Perez, E., Riesgo, A., Cuomo, C., Benvenuto, G., Christiaen, L.A., Martí, E., D'Aniello, S., Spagnuolo, A., Ristoratore, F., Arnone, M.I., Garcia-Fernàndez, J., Irimia, M.
- Source
- Full text @ Nat. Commun.
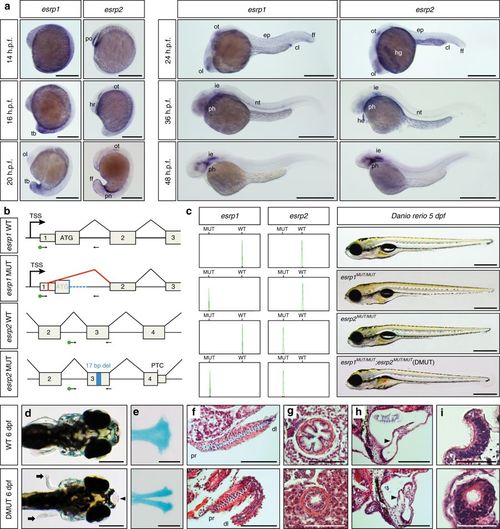
Expression and developmental roles of esrp1 and esrp2 in zebrafish. a WMISH for esrp1 and esrp2 in Danio rerio WT embryos. At 14 h.p.f., esrp1 transcripts were observed in embryonic epidermis, while esrp2 expression was only detected in the polster (po). At 16 h.p.f., esrp1 was restricted to the posterior and tailbud (tb) epidermis, whereas esrp2 persisted in the hatching gland rudiment (hr) and mild expression started to be detected in the otic placode (ot). By 20 h.p.f., esrp1 was found in the tailbud epidermis and more subtly in the olfactory placode (ol), while esrp2 appeared in new territories, such as pronephros (pn) and ectodermal cells of tailbud fin fold (ff). At 24 h.p.f., expression of both paralogs presented a similar pattern including olfactory and otic placodes, cloaca (cl), and epidermis (ep), although esrp2 was also observed in the hatching gland (hg). By 36 h.p.f., both genes were detected in the inner ear epithelium (ie), notochord (nt), and phanynx (ph), and esrp2 was also observed in the heart (he). At 48 h.p.f., expression was found predominantly in inner ear and pharynx. b Schematic representation of the genomic and transcriptomic impact of the selected esrp1 and esrp2 mutations. Blue boxes/lines represent genomic deletions in the mutants, while the red line depicts an altered splice junction in the esrp1 mutant allele. TSS, transcription start site; PTC, premature termination codon; del, deletion. Standard and fluorescent (green dot) primers used during genotyping are represented by arrows. c Left: genotyping of embryos by fluorescent PCR readily distinguished between WT and MUT alleles. Right: Representative 5 d.p.f. larvae for wild type (WT), esrp1 mutant (esrp1 MUT/MUT), esrp2 mutant (esrp2 MUT/MUT), and double mutant (DMUT) genotypes. Deflated swim bladder in the DMUT embryo is indicated by a red asterisk. d–i Phenotypic differences between 6 d.p.f. WT (top) and DMUT (bottom) embryos in different embryonic structures. DMUT larvae showed impaired fin formation (arrows) and cleft palate (arrowhead) d, including malformation of the ethmoid bone, as shown by Alcian blue staining e. f–i Transversal histological sections stained with hematoxylin and eosin showing structural differences in pectoral fin f, esophagus g, inner ear h and olfactory epithelium i. Black arrowheads mark the dorso-lateral septum between semicircular canals in h. Proximal (pr) and distal (dl) parts of the fin are indicated in f. Scale bars: 1 mm a, 2 mm c–e, 100 µm f–h, 50 µm i EXPRESSION / LABELING:
|

ZFIN is incorporating published figure images and captions as part of an ongoing project. Figures from some publications have not yet been curated, or are not available for display because of copyright restrictions. PHENOTYPE:
|
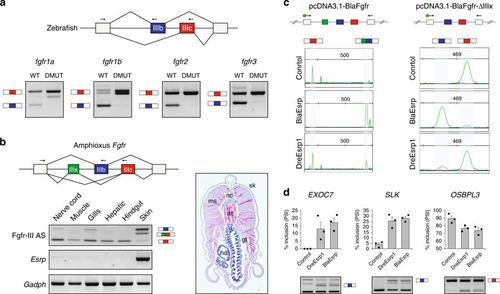
Fgfr AS is regulated by Esrp genes in vertebrates and amphioxus. a RT-PCR assays showing differential Fgfr exon IIIb and IIIc inclusion in WT versus DMUT 5 d.p.f. zebrafish embryos. b RT-PCR assays for Fgfr AS in different amphioxus adult tissues, depicted in a transversal section. nc, nerve cord, ms, muscle, gl, gills, hd, hepatic diverticulum, nt, notochord, sk, skin. Reverse primers were designed in both exons IIIb and IIIc (arrows) and used together in the same PCR reaction. c Top: schematic representation of pcDNA3.1-based minigene constructs containing the genomic region spanning the Fgfr AS event of Branchiostoma lanceolatum, with (pcDNA3.1-BlaFGFR) and without (pcDNA3.1-BlaFGFRΔIIIx) exon IIIx. Bottom: relative intensity of fluorescent RT-PCR bands supporting differential inclusion of exons IIIb and IIIc when transfecting the minigenes alone (Control) or together with a plasmid containing either amphioxus or zebrafish full-length Esrp transcripts (BlaEsrp and DreEsrp1, respectively). Despite significant mis-splicing of the minigene in all conditions, only the amphioxus construct was able to induce a dramatic switch toward exon IIIb inclusion. Primers were designed in the neighboring constitutive exons (arrows). d RT-PCR assays for endogenous human AS events in the same control, BlaEsrp or DreEsrp1 transfected 293T cells showing that the amphioxus and zebrafish Esrp constructs are able to modulate endogenous Esrp-dependent events in a similar manner. Error bars correspond to standard errors of three biological replicates. Esrp-enhanced isoforms are marked with an isoform cartoon PHENOTYPE:
|
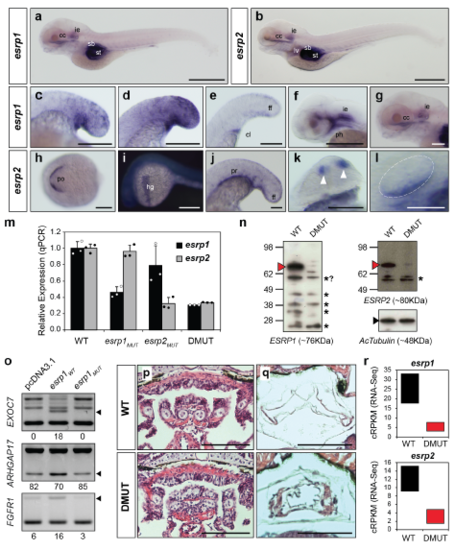
Developmental expression and impact of Esrp genes in zebrafish. (a-l) Additional details of WMISH for esrp1 and esrp2 in zebrafish embryos. (a,b) Similar expression of esrp1 and esrp2 was detected in 5dpf embryos in inner ear (ie) and craniofacial cartilaginous (cc) tissue. Signal was also observed in stomach (st) and swim bladder (sb), although non-specific staining of those hollow organs by NBT/BCIP precipitation could not be ruled out. esrp2 was additionally found in the liver (lv). (c-e) Broad expression of esrp1 in the tail bud ectoderm was maintained at 18hpf (c), reached its highest intensity by 20hpf (d), and became restricted to the median fin fold (ff) by 24hpf (e), when it was also observed in cloaca (cl) tissue. (f) 48hpf embryo heads showed expression of esrp1 predominantly in pharynx (ph) and inner ear (ie). (g) Detail of esrp1 expression in the head of 5dpf embryos in craniofacial cartilage (cc) and inner ear (ie). (h-l) esrp2 expression was also detected in a few territories where esrp1 was not observed, including the polster (po) at 14hpf (h), that later develops into the hatching gland (hg) by 24hpf (i), and in the pronephros (pr) (j); it shared expression with esrp1 in structures such as olfactory placode (white arrowheads) (k, 24hpf) and inner ear ventral epithelium (l, 32hpf). (m) Quantitative PCR (qPCR) assays showing the levels of expression of esrp1 and esrp2 genes in pools of 5dpf embryos with different genotypes (wild type [WT], esrp1 and esrp2 single mutants and double mutants [DMUT]). Error bars correspond to standard deviations of three technical replicates. (n) Western blot assays showing detection of ESRP1 and ESRP2 full-length proteins (red arrow heads) in 5dpf in WT, but not DMUT, embryos. Asterisks mark shorter bands that most likely correspond to unspecific signal based on size. (o) Ectopic expression of WT, but not mutant, zebrafish esrp1 transcripts in human 293T cells produced splicing changes in endogenous ESRP1 human targets. Black arrowheads indicate Esrp-enhanced isoforms. (p,q) Phenotypic comparison of transversal sections stained with hematoxylin and eosin from 6dpf embryos shows impaired development of visceral skeleton (p) and swim bladder (q). (r) Expression of esrp1 and esrp2 in 5dpf embryos quantified by RNA-seq using the cRPKM metric shows a clear reduction in the steady-state mRNA levels of both genes in DMUT embryos. Boxes represent the range of expression in the two replicates. Scale bars: 2 mm (a, b, i), 500 μm (d-h, j, k), 250 μm (l), 100 μm (p,q). EXPRESSION / LABELING:
|
|
Unillustrated author statements PHENOTYPE:
|