
- Title
-
Vertebrate myosin 1d regulates left-right organizer morphogenesis and laterality
- Authors
- Saydmohammed, M., Yagi, H., Calderon, M., Clark, M.J., Feinstein, T., Sun, M., Stolz, D.B., Watkins, S.C., Amack, J.D., Lo, C.W., Tsang, M.
- Source
- Full text @ Nat. Commun.
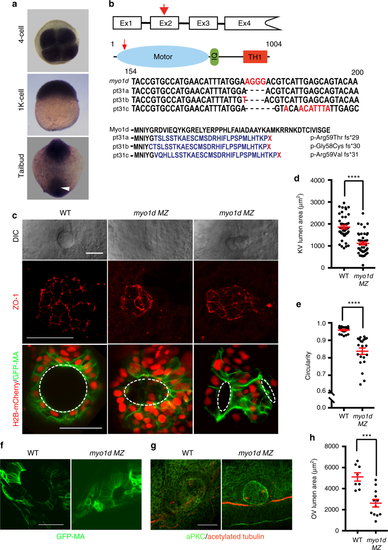
myo1d is required for Kupffer’s vesicle morphogenesis. a myo1d is ubiquitously expression. White arrow demarcates the region where KV is formed. b TALEN mediated genome editing of myo1d. TALENs were designed to target myo1d exon 2 (red arrow) encoding the myosin motor domain (blue). Calmodulin binding IQ motif (green) and Tail Homology 1 (TH1, red) domains are also indicated. Three F1 alleles were isolated, pt31a-c, with predicted amino acid sequence indicated. c–e myo1d MZ mutants showed KV lumen formation defects. Representative DIC images showing KV of myo1d MZ mutants were either smaller and dysmorphic lumens (c). ZO-1 staining at 8S confirmed that the apical surface of KVs were smaller or dysmorphic in myo1d mutants when compared to controls. myo1d MZ;Tg(dusp6:GFP-MA) injected with H2BmCherry mRNA showing dysmorphic KV epithelial cell morphology and decreased lumen area, when compared to controls. Lumen marked by dotted circular lines were quantified for area (WT: n = 44, myo1d MZ: n = 46) (d) and circularity (WT: n = 20, myo1d MZ: n = 21) (e). f–h Dysmorphic otic vesicle (OV) observed in myo1d MZ embryos. Tg(dusp6:GFP-MA) and myo1d MZ;Tg(dusp6:GFP-MA) embryos (f) or stained with aPKC (green) and acetylated tubulin (red) (g) at 24 hpf show smaller OVs and quantified (WT: n = 8, myo1d MZ: n = 12) (h). KV lumen was considered small when it was below threshold lumen size (1000 µm2). Unpaired t test was used with, ***p < 0.001, ****p < 0.0001 indicated. Data shown in the graphs are mean ± SEM. Scale bar, 50 µm PHENOTYPE:
|
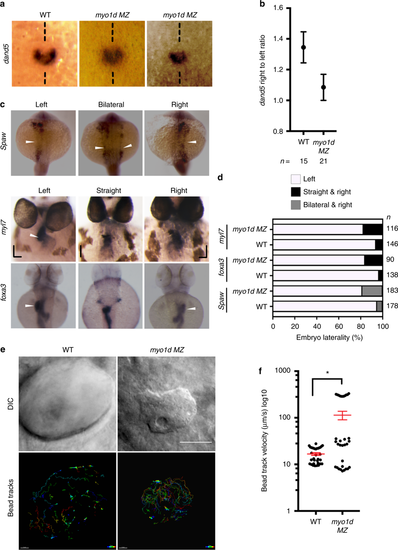
myo1d is necessary for KV function and establishing laterality. a, b Relative abundance of dand5 expression on the right vs left were decreased in myo1d MZ mutants compared to WT embryos at 8S. c, d myo1d MZ mutants displayed laterality defects. Heart and gut looping scored by myl7 and foxa3 expression at 72 hpf respectively, spaw expression at 17S (white arrowhead marks expression). Laterality defects were scored in d. e, f myo1d MZ embryos display altered KV flow as analyzed by tracking 0.2 µ FITC fluorescent microbeads injected into KV lumen. DIC images showing KV morphology of control and myo1d MZ mutants (e). Individual beads were mapped showing unidirectional circular movement were lost in myo1d MZ mutants compared to wild-type embryos. Individual bead movement was shown as temporal color-coded tracks. Graph comparing bead track velocity (mean ± SEM) in control (n = 33 tracked beads from three embryos) and myo1d MZ mutant embryos (n = 33 tracked beads from three embryos) (f). Unpaired t test indicate statistical significance * p < 0.05. Scale bar, 50 µm EXPRESSION / LABELING:
PHENOTYPE:
|
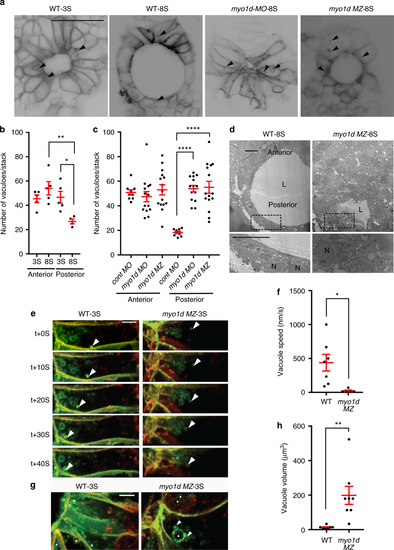
myo1d regulate directed vacuolar movement in KV cells. a–c Anterior and posterior KV epithelial cells contain numerous vacuoles (black arrow) at 3S (n = 5 embryos) but decrease in the posterior KV cells at 8S (n = 5 embryos) in Tg(dusp6:GFP-MA) embryos (scale bar, 50 µm). Vacuole number in posterior KV cells were increased in myo1d MO injected (n = 14) or in myo1d MZ;Tg(dusp6:GFP-MA) mutants (n = 15) when compared to control MO injected embryos (n = 9). Numeration of vacuole number per KV stack are shown in b and c. d TEM showing presence of vacuoles (black arrow) in posterior KV apex in myo1d MZ but not in WT embryos at 8S. L lumen, N nucleus, (n = 4) (scale bar, 10 µm). e–h 4D STED time-lapse still images of a representative KV epithelial cell. Tg(dusp6:GFP-MA) KV injected with H2BmCherry mRNA showing directed vacuole migration toward apical surface (white arrow), appeared to fuse with luminal surface. Vacuole movement toward KV apex in the myo1d MZ;Tg(dusp6:GFP-MA) mutant were decreased (e). Average vacuole movement speed in KV epithelial cells in myo1d MZ mutants (n = 5 vacuoles from three embryos) were decreased compared to WT (n = 7 vacuoles from three embryos) (f). In myo1d MZ;Tg(dusp6:GFP-MA) embryos (n = 7 vacuoles from three embryos), vacuole fusion (shown as white arrow) resulted in increased vacuole size when compared to Tg(dusp6:GFP-MA) control (n = 8 vacuoles from three embryos) (g). Vacuoles denoted by white spots. Average vacuole volume was increased in KV epithelial cells (h). Statistical analysis by one-way ANOVA and post hoc analysis with Turkey’s multiple range tests or unpaired t test. * p < 0.05, **p < 0.01, ***p < 0.005, ****p < 0.0001 represents a statistical difference. Data shown are mean ± SEM. Scale bar, 5 µm EXPRESSION / LABELING:
PHENOTYPE:
|
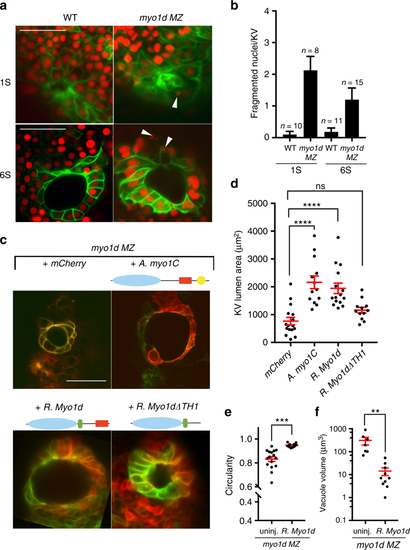
Conservation of Myosin I protein function. a, b Loss of myo1d results in increased nuclear fragmentation. Tg(dusp6:GFP-MA) or myo1d MZ; Tg(dusp6:GFP-MA) embryos injected with H2BmCherry mRNA exhibit fragmented nuclei in KV epithelial cells and quantified as fragmented nuclei per KV sample. Fragmented nuclei are represented as absolute numbers per KV Z-section. c–f Overexpression of amoeba myo1C (n = 13) or rat Myo1d (n = 15) were sufficient to rescue lumen area in myo1d MZ embryos compared to uninjected controls (n = 16) (d), circularity (n = 16 myo1d MZ, n = 10 rat Myo1d injected MZ embryos) (e), and reduced vacuole size (n = 9 myo1d MZ, n = 10 rat Myo1d injected MZ embryos) (f) in myo1d MZ mutants. However, rat Myo1d lacking the TH1 domain (myo1d∆TH1) (n = 12) failed to restore lumen size (d). Unpaired t test or one-way ANOVA with post hoc Turkey’s multiple range tests were conducted with, **p < 0.01, ***p < 0.005, ****p < 0.0001 represents statistical significance. ns not significant. Data shown are mean ± SEM EXPRESSION / LABELING:
PHENOTYPE:
|
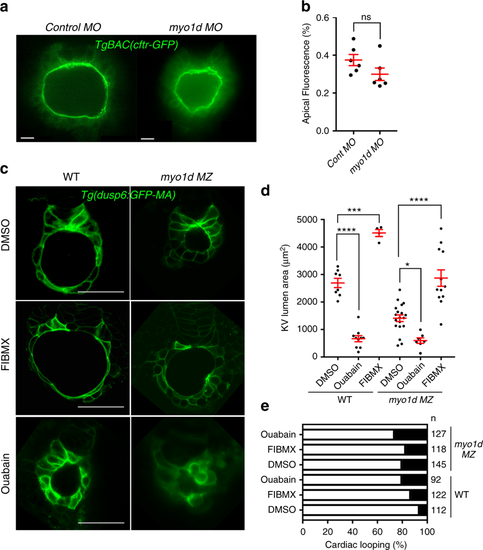
Modulating Cftr activity restores lumen size in myo1d MZ mutant embryos. a, b Knockdown of myo1d in TgBAC(Cftr-GFP) embryos did not affect CFTR apical GFP localization (n = 6 control MO, n = 6 myo1d MO). c–e Activation of Cftr function in the absence of myo1d MZ mutant expanded lumen area. Representative Z-stack image showing that Forskolin and IBMX (FIBMX) increased KV lumen in WT and myo1d MZ embryos (c). Treating with ouabain, an inhibitor of Na+/K+ ATPase decreased the KV lumen area in WT and myo1d mutant embryos. Numeration of lumen area with treatments are shown in (WT-DMSO: n = 8, WT-ouabain: n = 10, WT-FIBMX: n = 4, myo1d MZ-DMSO): n = 19, myo1d MZ-ouabain: n = 7, myo1d MZ-FIBMX: n = 12) (d). Cardiac looping defects were increased in WT embryos treated with FIBMX or ouabain but did not increase in myo1d MZ mutants (e). Unpaired t test and one-way ANOVA were conducted. *p < 0.05, ***p < 0.001, ****p < 0.0001 represents statistical significance. ns not significant. Data shown are mean ± SEM. L lumen, scale bar = 15 µm (a), 50 µm (c) EXPRESSION / LABELING:
PHENOTYPE:
|
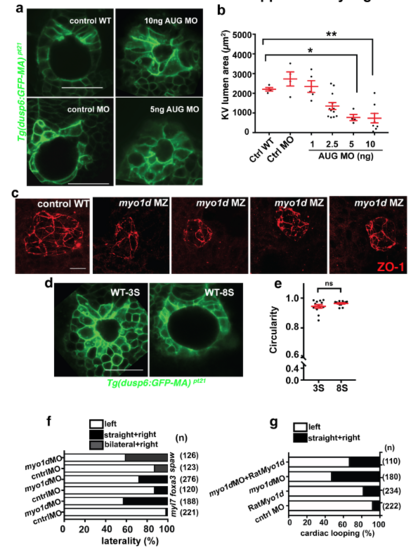
myo1d is necessary for lumen morphogenesis of Kupffer’s vesicle a. Representative images showing KV lumen surface area with increasing doses of myo1d AUG MO injected into Tg(dusp6:GFP-MA) embryos. b. Graph showing KV lumen formation was significantly decreased with increasing doses of myo1d AUG MO injected into embryos. c. Loss of Myo1d leads to dysmorphic lumen formation. ZO1 staining marks apical surface in myo1d MZ embryos showing smaller or dysmorphic KV shape when compared to controls. scale bar-20μm. d. Representative images of Tg(dusp6:GFP-MA) embryos showing KV formation at 3S and 8S stages used to calculate circularity. e. Graph showing circularity of KVs from 3S and 8S embryos. f. Laterality, expressed as percentage, from MO injected embryos. Embryos were fixed and probed using RNA in situ probes for myl7, foxa3 and spaw, and scored for defective looping pattern. Knockdown of Myo1d increased laterality defects. g. Cardiac looping, expressed as percentage from MO injections and rescue with rat Myo1d mRNA. Injected embryos fixed and probed for myl7 expression as a marker for cardiac looping. Knockdown of myo1d resulted in looping defects that was reduced with co-injection of rat Myo1d mRNA. |
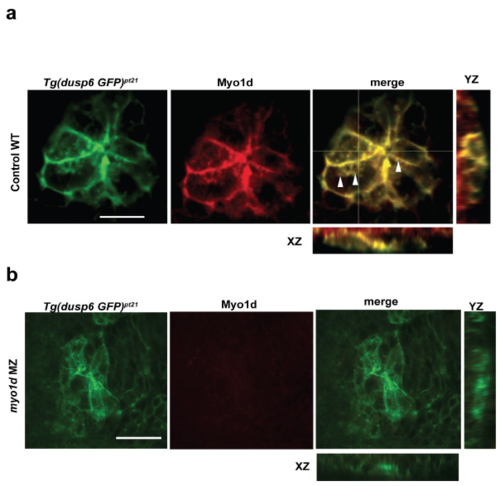
Myo1D expression in KV epithelial cells colocalizes with vacuoles and are absent in myo1d MZ mutants. a. Tg(dusp6:GFP-MA) embryos stained with Myo1D antibody (red) shows co-localized expression of Myo1D to membranes, and punctate structures in KV epithelial cells at 1-2 S. b. Myo1d staining in myo1d MZ embryos shows loss of Myo1D expression, suggesting the pt31a allele is a null mutant (scale bar-50μm). |
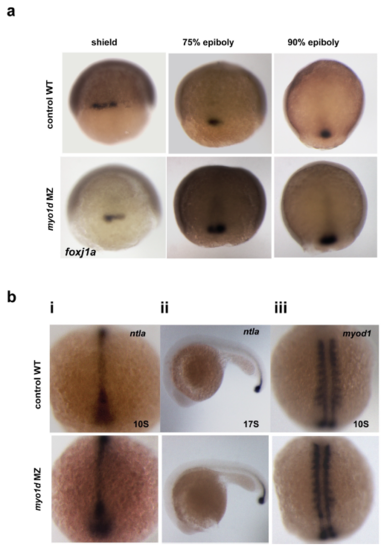
Dorsal Forerunner Cells (DFC) clustering and migration or midline formation is normal in myo1d MZ mutant embryos a. DFC clustering and migration in wildtype and myo1d MZ embryos analyzed by foxj1a expression at 60% epiboly, 75% epiboly, 90% epiboly (total n=195). b. tbxta expression at (i) 10S, n=21 (WT), n=27 (myo1d MZ) (ii) 17s n=26 (WT), n=29 (myo1d MZ) showed normal midline expression in myo1d MZ mutants. myod1 (myogenic differentiation 1) expression at 10S n=29 (WT), n=34 (myo1d MZ) was normal in somites and midline adaxial cells in myo1d MZ embryos. |
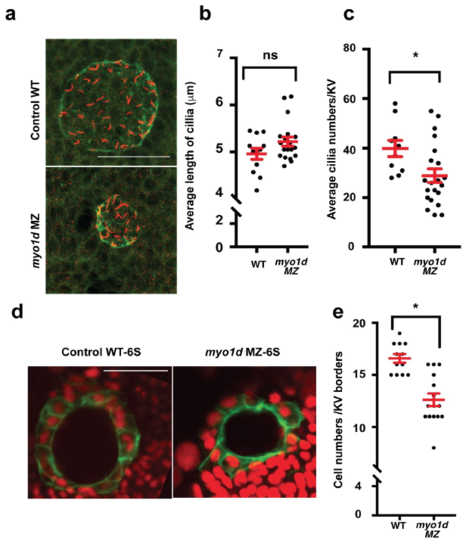
Ciliogenesis appeared unaffected in zebrafish KV a. Kupffer’s vesicle at 8 S embryos stained for aPKC (green) and acetylated tubulin (red). Cilia appeared crowded in myo1d MZ embryos compared to controls. b. Average cilia length of KV were not significantly affected (n=31). c. Average cilia numbers of KV were significantly less (n=31). d. Tg(dusp6:GFP-MA) embryos injected with H2BmCherry mRNA showing KV epithelial cell morphology. In this experiment, number of nuclei bordering KV epithelial cell borders were counted. e. Cell numbers lining KV borders at 6S significantly affected in myo1d MZ mutants. (n=28). |
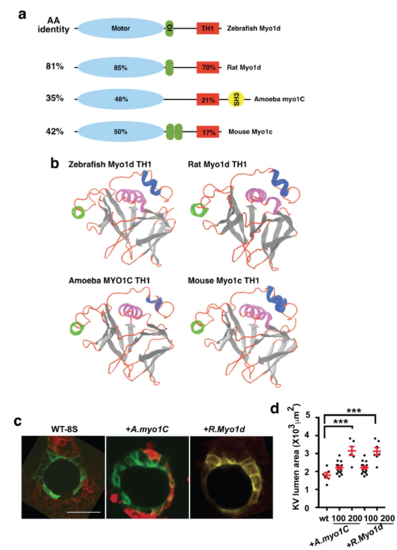
Amino acid comparison of myosin1 showing protein domains. a. Class I myosins showing myosin motor (blue), calmodulin binding IQ motif (green), Tail Homology 1 (TH1, red) and SH3 (yellow) domains. Total amino acid identity is listed on the left column compared to zebrafish Myo1d. Amino acid identity to zebrafish Myo1D motor and TH1 motifs are listed within the domains. b. Images of the predicted TH1 domains showing similarity after Phyre2 modeling. c. Representative images of KVs from Tg(dusp6:GFP-MA) embryos injected with H2BmCherry mRNA and A. myo1C, or Rat Myo1d showing expansion of the KV lumen area. d. Graph showing KV lumen area after injection of various doses of myosin I family. Statistical comparisons for the graphs were by one-way ANOVA and post hoc analysis with Turkey’s multiple range tests. *** p<0.001 represents a statistical difference Data shown in the graphs are mean ± SEM. |