
- Title
-
Protocadherin-Mediated Cell Repulsion Controls the Central Topography and Efferent Projections of the Abducens Nucleus
- Authors
- Asakawa, K., Kawakami, K.
- Source
- Full text @ Cell Rep.
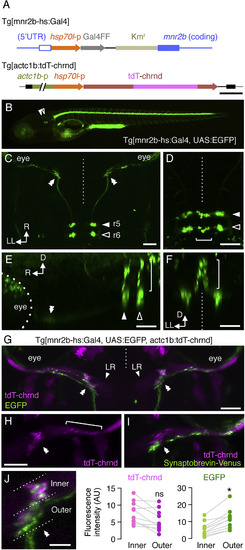
The Neuromuscular Connection between mnr2b-ABNs and the Lateral Rectus Muscle (A) Structure of Tg[mnr2b-hs:Gal4] and Tg[actc1b:tdT-chrnd]. The hsp70l promoter-Gal4FF-polyA-Kmr cassette was inserted downstream of the 5′ UTR of mnr2b. tdT-chrnd is driven by the actc1b-hsp70l tandem promoter. (B) Lateral view of Tg[mnr2b-hs:Gal4]; Tg[UAS:GFP] larvae at 5 dpf. (C) Axonal projection of the eGFP-labeled abducens motor neurons. The dorsal cell cluster was omitted for clarity of the projections. (D–F) Dorsal (D), lateral (E), and rear (F) views of the eGFP cell clusters. The brackets indicate the dorsal cell cluster. (G) Dorsal view of lateral rectus muscles (LR) at 5 dpf. (H) Gathered (double arrowhead) and scattered (bracket) AChRs labeled by tdT-chrnd on the right LR in (G). (I) Lateral rectus muscle of Tg[mnr2b-hs:Gal4]; Tg[UAS:V2V]; Tg[actc1b:tdT-chrnd] larva at 5 dpf. (J) The fluorescence intensities of the gathered tdT-chrnd and associated eGFP signals measured for each inner and outer halves of the muscle. N = 10 neuromuscular connections from five animals. ∗p = 0.024. ns, not significant. In (G)–(J), rostral is to the top. Scale bars indicate 500 bp in (A), 250 μm in (B), 50 μm in (C)–(F), (H), and (I), and 20 μm in (J). The vertical dashed lines indicate the midline. Hereafter, double white and black arrowheads indicate the presumptive initial contact sites with the lateral rectus muscle, r5, and r6, respectively, unless otherwise stated. D, dorsal; LL, left-lateral; R, rostral. EXPRESSION / LABELING:
|
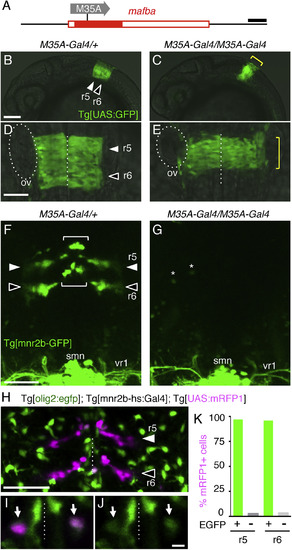
Soma Size Topography of mnr2b-ABNs (A) Left abducens nerve terminal of Tg[mnr2b-hs:Gal4]; Tg[UAS:GFP] larva at 5 dpf. (B–E) Axon terminals (orange) and somata (blue) of single abducens motor neurons. (F) Two neighboring abducens motor neurons on the dorsal side of r5, possessing either an en grappe-type (left arrowhead) or en plaque-type (right arrowhead) terminal, respectively. (G) The soma size of the dorsal and ventral cells in r5 and r6. N = 40 cells from 22 animals. ∗p < 0.05 (t test). (H and I) The lateral (H) and dorsal (I) views of an mnr2b-ABNs in the Tg[mnr2b-hs:Gal4]; Tg[UAS:Kaede] embryo at 44 hpf. (J) Birth-order labeling of mnr2b-ABNs and possible segregation patterns of early-born neurons along the dorsoventral axis (magenta in I, II, and III). Green fluorescence of Kaede that appears after photoconversion is indicated as post-Kaede. (K and L) Dorsal (K) and ventral (L) sections of r5 and r6 in the photoconverted Tg[mnr2b-hs:Gal4]; Tg[UAS:Kaede] larvae at 72 hpf. Scale bars indicate 50 μm in (A)–(F) and 20 μm in (H), (I), (K), and (L). |
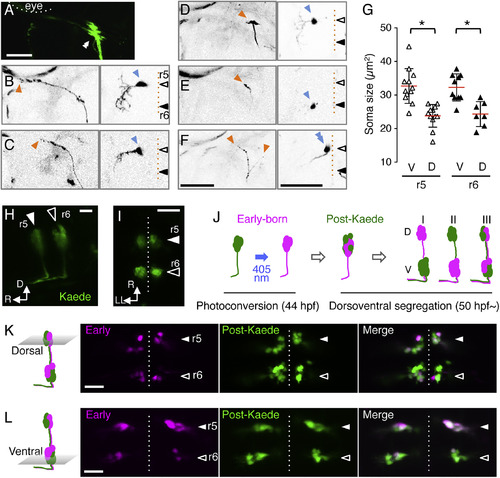
mnr2b-ABNs in r5 and r6 Form Convergent Efferent Projections (A) Structure of Tg[egr2b-Cre]. The Cre-polyA-Kmr cassette was inserted downstream of the 5′ UTR of egr2b. (B and C) eGFP expression in a Tg[SAGFF73A]; Tg[egr2b-Cre]; Tg[UAS:loxRloxG] embryo at 20 hpf (C). Tg[SAGFF73A] transgene ubiquitously drives Gal4 from zfand5b promoter (B) (Asakawa and Kawakami, 2009). (D and E) EGFP expression (D) driven by the combination of Tg[SAGFF73A], Tg[egr2b-Cre], and Tg[UAS:loxGloxR] transgenes (E). (F, J, and N) Dorsal views of r5 and r6 in larvae carrying the transgenes indicated above at 5 dpf. (G, K, and O) Schematic illustrations of Gal4- and Cre-mediated expression of eGFP and mRFP1 in r5 and r6. (H, I, L, M, P, and Q) Axon terminals of mnr2b-ABNs innervating the left lateral rectus muscle. Tg[UAS:loxG] is generated by spontaneous excision of the floxed mRFP1 from Tg[UAS:loxRloxG] in the germline. The orange arrowheads indicate the terminal and boutons of en grappe terminals. The double arrowheads show the CPEZ. In (Q), mRFP1 signal in mnr2b-ABNs in r6 is below detection limit. Scale bars indicate 200 bp in (A) and 50 μm in (C), (E), (F), and (H). EXPRESSION / LABELING:
Construct:
TgBAC(egr2b:Cre)
|
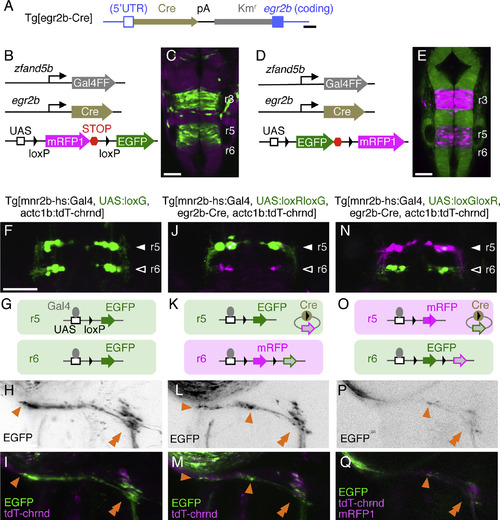
All mnr2b-ABNs Require mafba for Differentiation (A) The mafba/valentino locus in Tg[gSAIzGFFM35A] line (valM35A-Gal4 allele). Tg[gSAIzGFFM35A] (shown as M35A) is inserted in the coding exon of mafba (filled red box). (B–E) Lateral (B and C) and dorsal (D and E) views of the hindbrain areas of Tg[UAS:GFP]; valM35A-Gal4/+ and Tg[UAS:GFP]; valM35A-Gal4/M35A-Gal4 embryos at 24 hpf. The yellow brackets indicate the vestigial r5 and r6. Dashed lines and ovals show the midline and otic vesicle (ov), respectively. (F and G) Dorsal views of the hindbrain and first spinal segment of Tg[mnr2b-GFP]; valM35A-Gal4/+ (F) and Tg[mnr2b-GFP]; valM35A-Gal4/M35A-Gal4 (G) larvae at 80 hpf. The brackets and arrowheads indicate the dorsal and ventral mnr2b-ABNs, respectively. Asterisks in (G) show eGFP-expressing cells unrelated to mnr2b-ABNs. smn; spinal motor neuron; vr1; ventral root from the first spinal segment. (H) Dorsal view of r5 and r6 in Tg[olig2:egfp]; Tg[mnr2b-hs:Gal4]; Tg[UAS:mRFP1] at 3 dpf. (I and J) A single confocal section of the dorsal hindbrain in (H). (I) Arrows show mnr2b-ABNs (magenta) expressing eGFP derived from Tg[olig2:egfp] (J). (K) Percentage of the mRFP1-expressing cells that expressed eGFP. In total, 78 and 87 cells in r5 and r6, respectively, were examined in five larvae. Scale bars indicate 200 bp in (A), 100 μm in (B), 50 μm in (D)–(H), and 5 μm in (I) and (J). EXPRESSION / LABELING:
PHENOTYPE:
Construct:
Gt(gSAIz-GAL4FFM)
|
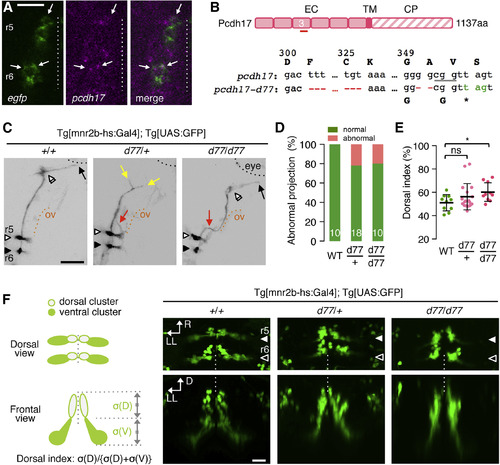
pcdh17-d77 Mutation Causes Defective Axon Growth and Guidance, as Well as Soma Topography Formation (A) Fluorescence in situ hybridization for EGFP and pcdh17 in the left hemisegments of r5 and r6 of the Tg[mnr2b-hs:Gal4]; Tg[UAS:GFP] larva at 40 hpf. Arrows indicate stronger pcdh17 signal overlapping EGFP signal. (B) The pcdh17-d77 allele contains two deletions (red) in the extracellular domain 3 (EC3) generating a premature stop codon (green). The underlined cgg indicates the protospacer adjacent motif (PAM). EC, TM, and CP stand for extracellular, transmembrane, and cytoplasmic domains, respectively. (C) The axon growth (yellow) and pathfinding (red) defects of mnr2b-ABNs at 3 dpf. The black and orange dashed lines demarcate the eye and otic vesicle (ov), respectively. (D) Frequency of abnormal axonal projection in wild-type (WT), heterozygous (d77/+), and homozygous (d77/d77) mutant larvae. (E) Dorsal shift of mnr2b-ABN somata by pcdh17-d77 mutation. The dorsal index is defined by the ratio of the soma areas in the dorsal half of the nucleus (σ[D]) to those of all mnr2b-ABNs (σ[D] + σ[V]) in a rostrocaudally projected image. ns, p = 0.15; ∗p = 0.0144 (unpaired t test). Error bars represent SD. (F) Nuclear organization mnr2b-ABNs (left) and dorsal and frontal views of mnr2b-ABN somata at 3 dpf. Scale bars indicate 20 μm in (A) and (F) and 50 μm in (C). EXPRESSION / LABELING:
PHENOTYPE:
|
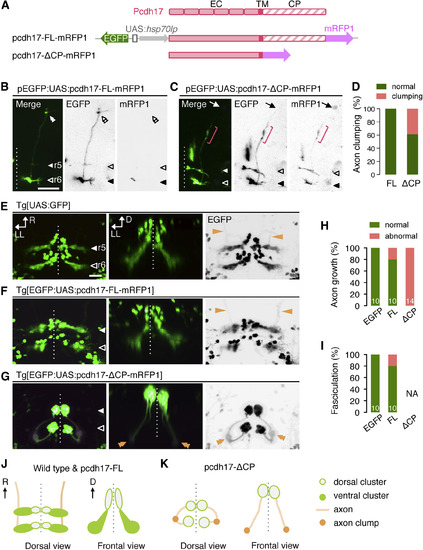
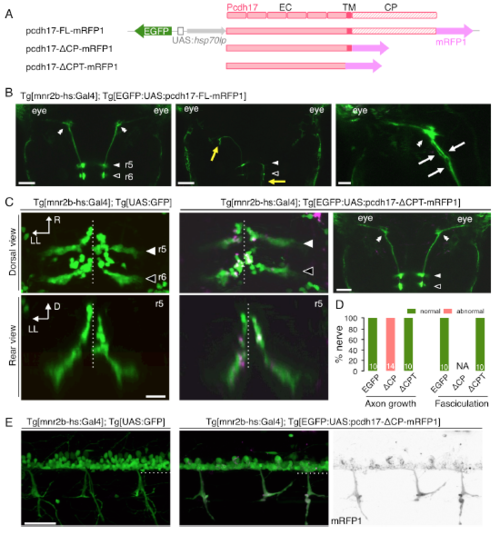
Dominant-Negative Pcdh17 Disrupts Nuclear Topography and Axon Growth of mnr2b-ABNs (A) Bidirectional UAS constructs for expression of the mRFP1-tagged full length (pcdh17-FL-mRFP1) and dominant-negative Pcdh17 (pcdh17-ΔCP-mRFP1). (B and C) Dorsal views of the right brain hemispheres of Tg[mnr2b-hs:Gal4] larvae injected with the UAS constructs for the full-length pcdh17 (B) or pcdh17-ΔCP (C). In (C), the nerve terminal and axon clump are indicated by an arrow and a red bracket, respectively. (D) Frequency of the axon clumping. For pcdh17-FL and pcdh17-ΔCP, 9 nerves from 6 animals and 18 nerves from 11 animals were examined, respectively. (E–G) Dorsal (left, right) and rear (middle) views of r5 and r6 at 3 dpf. The orange arrows and double arrowheads indicate the normal and clumped axons, respectively. (H and I) Frequency of abnormal axon growth (H) and fasciculation (I). Numbers in the histograms indicate the numbers of nerves examined. NA, not applicable because of severe axon growth defect. (J and K) Schematic illustrations of normal (wild-type and pcdh17-FL) (J) and abnormal (pcdh17-ΔCP) (K) nuclear formation and axon growth of mnr2b-ABNs. Scale bars indicate 50 μm in (B) and (C) and 20 μm in (E)–(G). EXPRESSION / LABELING:
PHENOTYPE:
|
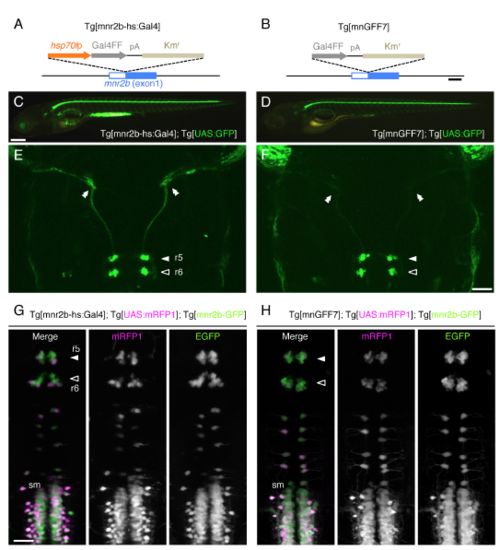
Tg[mnr2b-hs:Gal4] is the stronger Gal4 driver for abducens motor neurons than Tg[mnGFF7]. (Related to Figure 1) (A, B) Structures of Tg[mnr2b-hs:Gal4] and Tg[mnGFF7] (Asakawa et al., 2013) in the mnr2b BAC. (C-H) Lateral views of the whole bodies (C, D) and dorsal views of the caudal brains (E, F) at 5 dpf. Double arrowheads indicate the abducens nerve terminals. (G, H) Dorsal views of the caudal hindbrains and rostral spinal cords at 46 hpf. A transgenic line driving EGFP by mnr2b enhancers (mnr2b-GFP) (Asakawa et al., 2012) was used as a reference. sm, spinal motor neuron. The white and black arrows indicate the ventral clusters of the abducens nuclei in r5 and r6, respectively, in E-H. The rostral is to the top in E-H. The bars indicate 200 base pairs (A and B), 250μm (C and D) and 50 μm (F and G). Panels C and E are the same as in Figures 1B and 1C, respectively. |
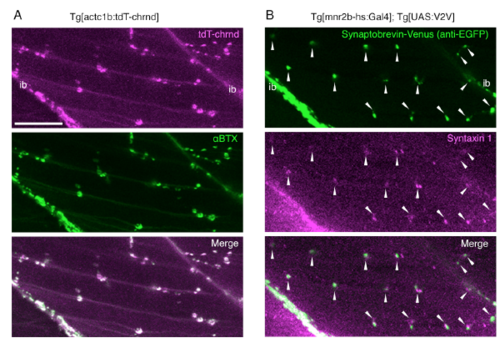
Transgenic zebrafish marker lines for neuromuscular synapse. (Related to Figure 1) (A) tdT-chrnd fluorescence represents AChR clusters in the postsynaptic endplates. The skeletal muscle of a larva at 96 hpf, treated with 1 μg/ml α-bungarotoxin Alexa FluorTM 488 conjugate (B13422, Life Technologies) for 1 hour, after a 6-hour fixation with 4% paraformaldehyde (middle, αBTX). tdT-chrnd fluorescence (top, tdT-chrnd) overlapped with αBTX signals (bottom, Merge). (B) Synaptobrevin-Venus driven by Tg[mnr2b-hs:Gal4] labels presynaptic terminals. Immunofluorescence of skeletal muscle of a larva at 96 hpf using mouse anti-EGFP (1/1000, MAB3580, CHEMICON) and rabbit anti-Syntaxin 1 (1/1000, S1172, SIGMA) antibodies. Goat anti-mouse Alexa Fluor 488 (1:1000, Molecular Probes) and goat anti-rabbit Alexa Fluor 633 (1:1000, Molecular Probes) were used as secondary antibodies. Synaptobrevin-Venus signals (top) overlapped and/or were in close apposition of presynaptic marker Syntaxin 1 (arrows). ib, intermyotomal boundary. Bar indicates 20 μm. |
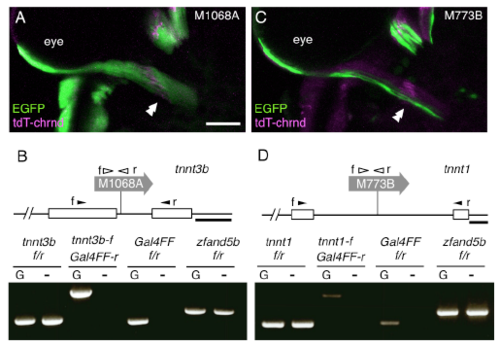
Compartmental organization of the lateral rectus muscle characterized by troponins. (Related to Figure 1) (A) Dorsal view of the left lateral rectus muscle in a Tg[gSAIzGFFM1068A]; Tg[UAS:GFP]; Tg[actc1b:tdT-chrnd] larva at 5dpf. The double arrowheads indicate the presumptive initial contact sites between the abducens motor neurons and lateral rectus muscle. Rostral is to the top. (B) Tg[gSAIzGFFM1068A], indicated as M1068A, traps tnnt3b. (C) Dorsal view of the left lateral rectus muscle in a Tg[gSAIzGFF773B]; Tg[UAS:EGFP]; Tg[actc1b:tdT-chrnd] larva at 5dpf. (D) Tg[gSAIzGFF773B], indicated as M773B, traps tnnt1. The open boxes represent exons of the troponin genes. Chimeric transcript between the troponin genes and Gal4 was detectable by RT-PCR (bottom). The filled and open arrowheads show the position and direction (f: forward, and r: reverse) of primers annealing with the troponin exons and Gal4, respectively. For each set of primer pairs, cDNA reverse-transcribed from poly A-tailed RNA of fish with (G, left lane) or without (-, right lane) the gene trap construct was examined. The ubiquitously expressed zfand5b was used as a control. The bars indicate 50 μm in A, C and 100 bp in B, D. |
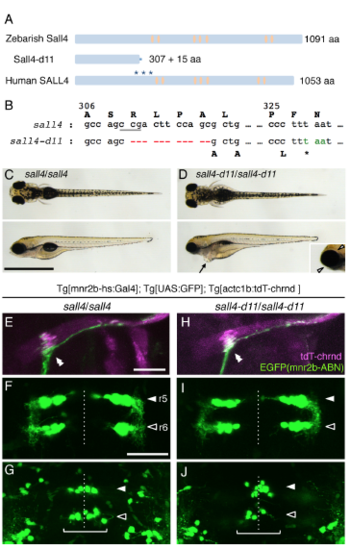
sall4 knockout fish forms the neuromuscular connection between mnr2b-ABN and lateral rectus. (Related to Figure 4) (A) The structure of zebrafish and human Sall4/SALL4 protein. The asterisks indicate the positions of mutations causing protein truncation in Okihiro/DRRS syndrome patients. The orange ovals represent the zinc finger domains. (B) The nucleotides at the position from +922 to +932, where A in the initiation codon is +1, are deleted in sall4-d11. The underlined CCG (CGG in the opposite strand) represents the protospacer adjacent motif (PAM) for Cas9 nuclease. (C, D) The dorsal (top) and lateral (bottom) views of the wild type (C) and sall4-d11 (D) larvae at 5 dpf. The arrow indicates the cardiac edema (D, bottom). Arrowheads show the eye edema (inset). (E-J) The dorsal view of the lateral rectus muscle (E, H) and the ventral (F, I) and dorsal cluster (G, J) of abducens nuclei in the wild type (left panels) and the sall4-d11 homozygote (right panels) at 5dpf. The double arrowheads indicate CEPZ. The white and black arrowheads indicate the position of r5 and r6, respectively. The brackets indicate the dorsal cluster. The dashed lines show the midline. The bars indicate 1 mm in C and D and 50 μm in others. |
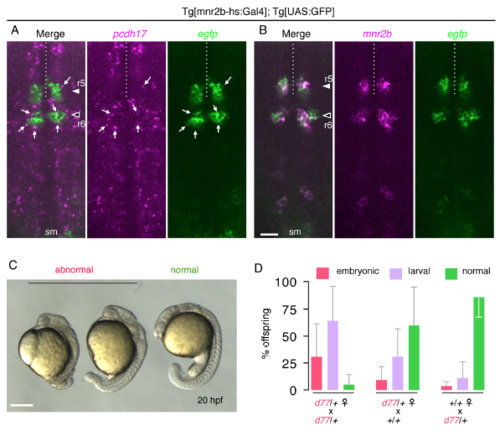
pcdh17-d77 mutation causes developmental defects. (Related to Figure 5) (A) pcdh17 is widely expressed in the hindbrain with enhanced expression levels in specific cell populations at 44 hpf. (B) EGFP recapitulates mnr2b expression in the Tg[mnr2b-hs:Gal4]; Tg[UAS:GFP] larva. sm, spinal motor neuron. In A and B, shown are the z-stacks of three optical sections taken at the 1-μm interval (2 μm thick), which are thin enough to exclude potential colocalization of pcdh17 speckles and EGFP in different cells. (C) Examples of the embryonic defect observed at 20 hpf. (D) Incidence of developmental defects occurring during the embryonic (red) and larval (larval) stages observed among the offspring from indicated parental fish. See Supplemental experimental procedure for the criteria of phenotypic characterization. Embryonic phenotypes typically include shortened body due to defective gastrulation, which occasionally resulted in embryonic death due to yolk damage. Either of failure in forming a fully inflated swim bladder on 5 dpf or morphological abnormalities such as cardiac edema was considered as larval defects. The error bars show standard deviation. The bar indicates 50 μm in A and B, and 250 μm in C. PHENOTYPE:
|
Ectopic expression of the truncated Pcdh17 proteins in the abducens and spinal motor neurons. (Related to Figure 6) (A) UAS constructs for expression of the full-length and truncated Pcdh17 proteins. (B) Normal (left), misguided (middle, yellow arrows) and defasciculated (right, white arrows) axon projections of mnr2b-ABNs expressing Pcdh17-FL-mRFP1 at 3 dpf. The bars indicate 50 μm in left, middle and 20 μm in right. (C, D) pcdh17-ΔCPT expression does not affect soma topography and axon projection of mnr2b-ABNs at 3 dpf. Numbers of the nerves investigated are shown in the bar (D). The bars indicate 20 μm (left) and 50 μm (right). R, rostral; LL, left lateral, D, dorsal. (E) pcdh17-ΔCP expression causes clumping of somas and axon projection of spinal motor neurons at 3 dpf. The dashed lines indicate the ventral limit of the spinal cord. The bar indicates 100 μm. |
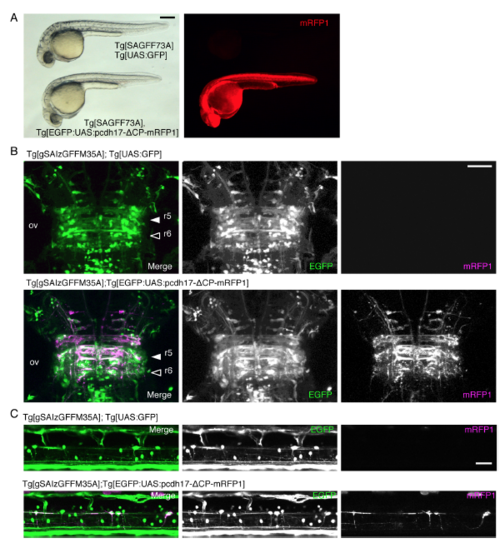
Effects of Pcdh17-ΔCP expression on r5, r6 and spinal interneurons. (Related to Figure 6) (A) Whole body induction Pcdh17-ΔCP-mRFP1 expression driven by Tg[SAGFF73](Asakawa and Kawakami, 2009) causes developmental delay at 32 hpf, and lethality by 5 dpf. (B, C) Expression of pcdh17-ΔCP-mRFP1 in r5, r6 and spinal interneurons driven by Tg[gSAIzGFFM35A] (see Fig 4) did not cause gross anatomical alteration at 4 dpf. The bars indicate 250 μm in A and 50 μm in other images. |