
- Title
-
BMP- and Neuropilin-1-mediated motor axon navigation relies on spastin alternative translation
- Authors
- Jardin, N., Giudicelli, F., Ten Martín, D., Vitrac, A., De Gois, S., Allison, R., Houart, C., Reid, E., Hazan, J., Fassier, C.
- Source
- Full text @ Development

Two main spastin isoforms are synthesized during zebrafish development through alternative use of two initiation codons. (A) Alignment of spastin cDNA sequences surrounding the first and second ATG (bold) from different vertebrate species. Kozak sequences surrounding the first and second ATG are boxed in red and blue, respectively. Asterisks indicate conserved nucleotides. (B) Schematic representation of the different spastin constructs used in the present study. Crosses indicate mutated ATG. (C-E) Zebrafish spastin transcript drives the synthesis of two main spastin isoforms through alternative translation start sites. (C) Western blot analysis of spastin expression in COS-7 cells transfected or not (not transfected, NT) with the different spastin constructs (see B) using HA and spastin86-340 antibodies. (D) Both zebrafish spastin isoforms display a microtubule-severing activity in vitro. Immunolabelling of spastin and microtubules in COS-7 cells overexpressing DrM1 or DrM61-HA using HA (red) and tyrosinated tubulin (green) antibodies. Dotted lines surround transfected cells. Both overexpressed DrM1 and DrM61 dismantle the microtubule network. Scale bar: 20 µm. (E) Western blot analysis of exogenous spastin expression from protein extracts of tailbud embryos injected or not with in vitro transcribed mRNAs from the different spastin constructs using HA antibody. (F) The expression ratio between spastin isoforms varies during zebrafish development. Western blot analysis of spastin main isoforms during zebrafish development, using spastin86-340 antibody. Protein extracts from tailbud embryos injected with spastin-HA mRNA and revealed using an HA antibody, were used as DrM1 and DrM61 benchmark. (G) Spastin exon 4 is alternatively spliced during zebrafish development. RT-PCR analysis of spastin transcripts at both the tailbud stage and 24 hpf using primers flanking the exon 4 of the zebrafish spastin gene. (H,I) Distinct subcellular distribution of spastin main isoforms in spinal motor neurons in vivo. (H) Immunolabelling of 28 hpf Tg(mnGFF7;UAS:DrM1-HA) and Tg(mnGFF7;UAS:DrM61-HA) transgenic embryos with an HA antibody. Arrows indicate the punctate distribution of DrM1-spastin along the axon shaft while empty arrowheads indicate its specific enrichment in spinal motor growth cones. Scale bars: 10 µm. (I) Mean fluorescence intensity profile of DrM1 and DrM61 staining along the distal part of SMN axons (n=6 and n=8, respectively). |
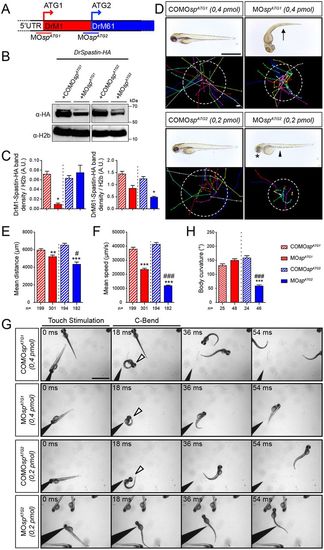
The knockdown of each spastin isoform differentially alters larval locomotion. (A) The knockdown of spastin main isoforms using a morpholino-based strategy. MOspATG1 and MOspATG2 morpholinos were designed to block spastin synthesis from the first (M1) or the second (M61) ATG. (B) Western blot analysis showing the efficiency of spastin isoform knockdown. Spastin expression was analysed in protein extracts from tailbud embryos injected with MOspATG1, MOspATG2 or their corresponding control morpholinos using an HA antibody. H2b was used as a loading control. (C) Quantification of DrM1 and DrM61 band density normalised to H2b values (A.U., arbitrary units), from four independent experiments. *P≤0.05. Non-parametric Mann–Whitney test. Error bars are s.e.m. (D) Overall morphology (upper panels) and locomotor behaviour (bottom panels) of 72 hpf larvae injected with MOspATG1 (n=301), MOspATG2 (n=182) or control morpholinos (COMOspATG1, n=199 and COMOspATG2, n=194). Upper panels: Arrow indicates the curved-tail phenotype of ATG1 morphants. Asterisk and arrowhead show smaller eyes and yolk tube agenesis in ATG2 morphants. Bottom panels: Tracking analysis of 72 hpf control and morphant larvae in a touch-escape response test. Each line represents the trajectory of one larva after touch stimulation, while the dotted circle radius symbolizes the mean swimming distance covered by all larvae. Scale bars: 2 mm. (E) Quantification of the mean swimming distance. (F) Quantification of the mean swimming speed. (G,H) Touch-evoked startle response of 72 hpf COMOspATG1 (n=25), COMOspATG2 (n=24), MOspATG1 (n=48) and MOspATG2 (n=46) larvae. (G) Representative time series of control and spastin morphant larvae responding to a tactile stimulation. White arrowheads indicate the characteristic high body curvature (called C-bend) occurring after the touch stimulation. ATG2 morphants are unable to make the C-bend movement. Scale bar: 2 mm. (H) Maximal C-bend body curvature angle of the startle responses. (E,F,H) **P≤0.01, ***P≤0.001 versus control larvae; #P≤0.05, ###P≤0.001 versus ATG1 morphants; Kruskal–Wallis ANOVA test with Dunn's post test. Error bars are s.e.m. PHENOTYPE:
|
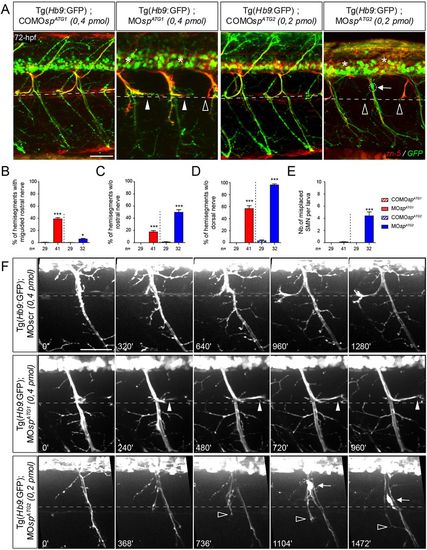
ATG1 and ATG2 morphants exhibit different spinal motor neuron defects. (A) Immunolabelling of secondary motor neurons (sMN) in 72 hpf COMOspATG1 (n=29), COMOspATG2 (n=29), MOspATG1 (n=41) and MOspATG2 (n=32) Tg(Hb9:GFP) transgenic larvae using zn-5 antibody. Lateral views of the trunk, anterior towards the left. Dotted lines indicate the horizontal myoseptum (i.e. axon guidance choice point). White arrowheads indicate misguided rostral nerves of ATG1 morphants while arrows indicate the ectopic sorting of sMN somata from the spinal cord of ATG2 morphants. Empty arrowheads and asterisks indicate missing rostral and dorsal nerves, respectively. Scale bar: 50 µm. (B-E) Quantification of sMN defects in 72 hpf control and spastin morphant larvae (24 spinal hemisegments were analysed per larva). *P≤0.05, ***P≤ 0.001; Kruskal–Wallis ANOVA test with Dunn's post test. The number (n) of larvae analysed per condition is indicated under the corresponding histogram bar. Error bars are s.e.m. (F) Distinctive navigational behaviour of ATG1 and ATG2 morphant sMN axons at the choice point. Representative stills of time-lapse recordings of sMN axon outgrowth monitored in 32 spinal hemisegments of 40-72 hpf Tg(Hb9:GFP) transgenic larvae injected with MOspATG1, MOspATG2 or a control morpholino (MOscr). White arrowheads indicate the aberrant caudal turning of ATG1 morphant sMN rostral axons at the horizontal myoseptum (dotted line) while empty arrowheads indicate the erroneous ventral growth of ATG2 morphant sMN axons beyond this choice point. Arrows track the aberrant migration of sMN somata along motor tracts of ATG2 morphants. Scale bar: 50 µm. PHENOTYPE:
|
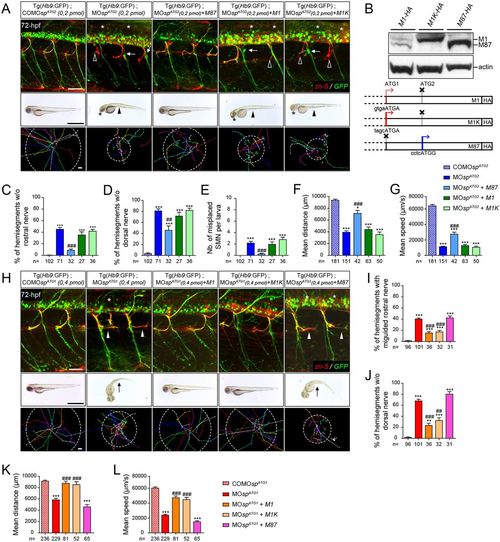
Spastin main isoforms have non-overlapping functions in spinal motor neuron development and locomotor behaviour. (A-G) Rescue experiments of ATG2 morphant phenotypes by M1, M1K or M87 mRNAs. (B) Western blot analysis (bottom panel) of exogenous spastin expression using an HA antibody in wild-type embryos injected with human spastin (SPG4) mRNAs used for rescue experiments and schematized in the upper panel. The Kozak sequence surrounding the first ATG of M1 transcript has been replaced by an optimal consensus sequence (M1K mRNA) to boost M1 expression. Actin was used as a loading control. (H-L) Rescue experiments of ATG1 morphant phenotypes by M1, M1K or M87 mRNAs. (A,H; upper panels) Immunolabelling of secondary motor neurons (sMN) in 72 hpf control, morphant and ‘rescued’ (i.e. co-injected with MOspATG1 or MOspATG2 together with each version of human spastin mRNAs) Tg(Hb9:GFP) larvae using zn-5 and GFP antibodies. (A) Arrows, empty arrowheads and asterisks indicate mispositioned sMN, missing rostral and dorsal nerves, respectively. (H) White arrowheads indicate misguided rostral nerves. Scale bars: 50 µm. (A,H; middle panels) Overall morphology of 72 hpf control, morphant and ‘rescued’ larvae. (A) Arrowheads indicate yolk tube agenesis and asterisks indicate smaller eyes. (H) Arrows indicate curved tails. Scale bars: 1 mm. (A,H; bottom panels) Tracking analysis of 72 hpf control, morphants and ‘rescued’ larvae in a touch-escape response test. Each line shows the trajectory of one larva after the stimulus. Dotted circle radius symbolizes the mean swimming covered distance. Scale bars: 1 mm. (C-G,I-L) Quantification of sMN defects (24 spinal hemisegments per larva; C-E,I,J), mean swimming distances covered (F,K) and speed (G,L) of 72-hpf control, morphant and ‘rescued’ larvae. The n value for each larval group is indicated under the corresponding histogram bar. *P≤0.05, **P≤0.01, ***P≤0.001 versus control larvae; ##P≤0.01, ###P≤0.001 versus morphants; Kruskal–Wallis ANOVA test with Dunn's post test. Error bars are s.e.m. |
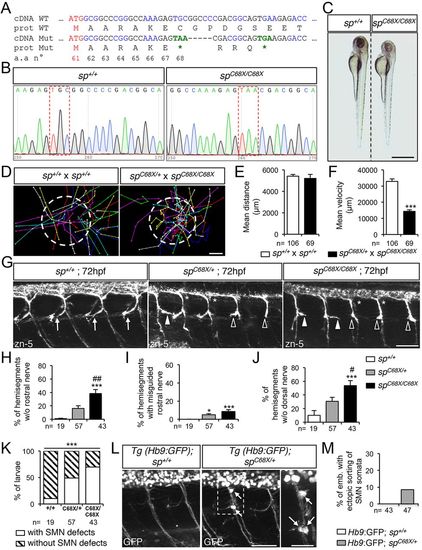
Spastin CRISPR/Cas9 mutants show overlapping locomotor and SMN phenotypes with ATG1 and ATG2 morphants. (A) mRNA and protein sequences of wild-type (WT) and spC68X CRISPR/Cas9 mutant (Mut). The second ATG codon (Met 61) and premature stop codons (*) are indicated in red and green, respectively. Black and blue letters are used to discriminate two successive codons. Numbers indicate amino acid position. (B) Sequence analysis of wild-type (sp+/+) and spC68X/C68X mutant DNA. Red dashed boxes show the nucleotide substitution generating a premature STOP codon. (C) Overall morphology of 72 hpf sp+/+ and spC68X/C68X larvae. Scale bar: 6 mm. Some mutant larvae are smaller than their control siblings. (D-F) Touch-evoked escape behaviour of 72 hpf larvae obtained from crosses between spC68X/C68X and spC68X/+ or control sp+/+. (D) Each line represents the trajectory of one larva after touch stimulation. Dotted-circle radius symbolises the mean swimming distance covered by all larvae. The distance between two dots represents the distance covered by a larva between two consecutive frames. Scale bar: 4 mm. (E,F) Quantification of the mean swimming distance (E) and mean swimming speed (F). (G) Immunolabelling of sMN in sp+/+, spC68X/+ and spC68X/C68X larvae using zn-5 antibody. Arrows indicate control rostral nerves, while white arrowheads, empty arrowheads and asterisks indicate misguided rostral nerve, missing rostral nerves and dorsal nerves of spC68X mutant larvae, respectively. (H-J) Quantification of sMN defects in 72 hpf sp+/+, spC68X/+ and spC68X/C68X larvae. Quantifications were carried out on 24 spinal hemisegments per larva. (K) Penetrance of SMN defects. (L) Immunolabelling of SMN in 72 hpf sp+/+ or spC68X/+ Tg(Hb9:GFP) larvae using a GFP antibody. Arrows indicate mispositioned SMN somata. (M) Percentage of larvae with ectopic sorting of SMN somata outside the spinal cord. (E,F,H-K,M) The number (n) of larvae analysed per condition is indicated under the corresponding histogram bar. *P≤0.05, ***P≤0.001 versus internal controls; #P≤0.05, ##P≤0.01 versus spC68X/+ larvae; non-parametric Mann–Whitney test (E,F); Kruskal–Wallis ANOVA test with Dunn's post test (H-J) and χ2 test (K). Error bars are s.e.m. (G,L) Lateral views of the trunk, anterior towards the left. Scale bars: 50 µm. |
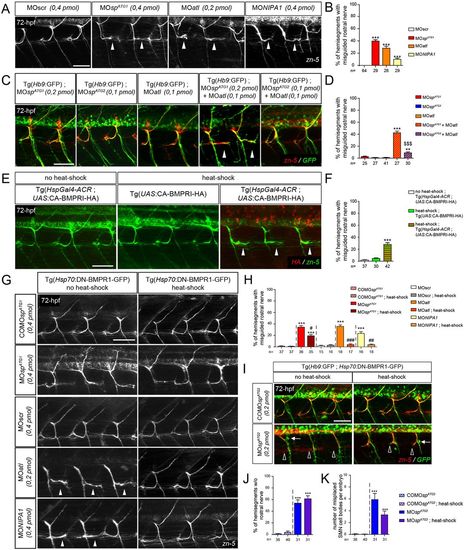
DrM1 controls secondary motor axon targeting through BMP inhibition as atlastin 1 and NIPA1 do. (A,C,E,G,I) Immunolabelling of secondary motor neurons (sMN) at 72 hpf using zn-5 (A,G), zn-5 and HA (E), or zn-5 and GFP antibodies (C,I). Lateral views of the trunk, anterior towards the left. White arrowheads, empty arrowheads and arrows indicate misguided rostral nerves, missing rostral nerves and misplaced SMN somata, respectively. (B,D,F,H) Mean percentage of misguided rostral nerves. (J) Mean percentage of hemisegments without rostral nerves. (K) Mean number of misplaced SMN somata per embryo. (B,D,F,H,J,K) Quantifications were performed on 24 spinal hemisegments per larva. The n value for each larval group is indicated under the corresponding histogram bar. **P≤0.01, ***P≤0.001 versus internal controls; $$$P≤0.001 for co-injection comparison; #P≤0.05, ##P≤0.01, ###P≤0.001 versus morphant larvae; Kruskal–Wallis ANOVA test with Dunn's post test. Error bars are s.e.m. (A,B) sMN analysis in larvae injected with MOspATG1, MOatl, MOnipa1 or control (MOscr) morpholinos. (C,D) sMN analysis in larvae injected with sub-efficient doses of MOspATG1, MOspATG2 or MOatl morpholinos or co-injected with the same sub-efficient doses of MOatl and MOspATG1 or MOspATG2 morpholinos. (E,F) sMN analysis in non-heat-shocked or heat-shocked Tg(HspGal4-ACR;UAS:CA-BMPRI-HA) and heat-shocked Tg(HspGal4-ACR) transgenic larvae. (G-K) sMN analysis in non-heat-shocked or heat-shocked Tg(Hsp70:DN-BMPR1-GFP) transgenic larvae injected with MOspATG1, MOatl, MOnipa1, MOspATG2 and appropriate control morpholinos. Scale bars: 50 µm. PHENOTYPE:
|
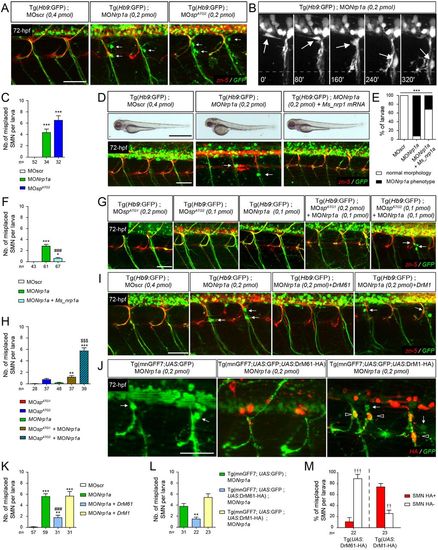
DrM61 acts as a downstream effector of neuropilin 1a signalling in motor neurons. (A-C) Neuropilin 1a (nrp1a) morphants show misrouted motor neuron somata similar to ATG2 morphants. (A) Analysis of secondary motor neurons (sMN) in 72 hpf Tg(Hb9:GFP) transgenic larvae injected with MOnrp1a, MOspATG2 or MOscr morpholinos using zn-5 and GFP antibodies. (B) Representative stills of time-lapse recordings showing SMN behaviour in 40-72 hpf Tg(Hb9:GFP) transgenic larvae injected with Nrp1a (n=5 larvae; n=32 spinal hemisegment monitored). Arrows track the aberrant migration of SMN somata along motor axon tracts of nrp1a morphants. Scale bar: 10 µm. (D-F) Rescue experiments of nrp1a morphant phenotypes with mouse Nrp1 mRNA (Ms_nrp1 mRNA). (D) Overall morphology (upper panels) and SMN analysis (bottom panels) of 72 hpf larvae injected with MOscr, MONrp1a or MONrp1a and Ms_nrp1 mRNA. (E) Distribution of wild-type and nrp1a morphant phenotypes in each injection group. ***P≤0.001; χ2 test. (F) Mean number of misplaced SMN somata per larvae. (G) SMN analysis in 72 hpf Tg(Hb9:GFP) transgenic larvae injected with sub-efficient doses of MOspATG1, MOspATG2 or MONrp1a or co-injected with the same sub-efficient doses of MONrp1a and MOspATG1 or MOspATG2 morpholinos. (I) SMN analysis in 72 hpf Tg(Hb9:GFP) transgenic larvae injected with control (MOscr) or MONrp1a morpholinos or co-injected with MONrp1a and DrM1- or DrM61-spastin mRNA. (J) SMN analysis in 72 hpf Tg(mnGFF7;UAS:GFP), Tg(mnGFF7;UAS:GFP;UAS:DrM61-HA) and Tg(mnGFF7; UAS:GFP;UAS:DrM1-HA) transgenic larvae using HA and GFP antibodies. (A,D,G,I,J) Lateral views of the trunk, anterior towards the left. Arrows indicate mispositioned SMN somata. Scale bars: 50 µm. (J) Empty arrowheads indicate misplaced HA-positive SMN. (C,F,H,K,L) Mean number of mispositioned SMN per larva (quantified on 24 spinal hemisegments/larva). (M) Percentage of misplaced HA-positive or -negative SMN per larva (quantified on 24 spinal hemisegments/larva). (C,F,H,K-M) The number of larvae or SMN analysed per group (n) is mentioned under each corresponding histogram bar. *P≤0.05, **P≤0.01, ***P≤0.001 versus internal controls; $$$P≤0.001 versus single injection of each morpholino; ###P≤0.001 versus morphant larvae; ††P≤0.01, †††P≤0.001 HA-positive versus -negative SMN; Kruskal–Wallis ANOVA test with Dunn's post test. Error bars are s.e.m. PHENOTYPE:
|
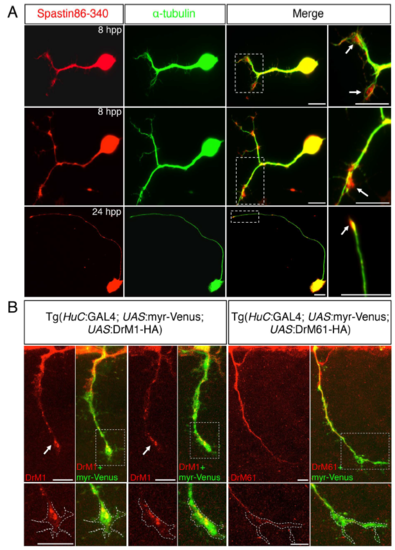
Subcellular distribution of DrM1 and DrM61 spastin isoforms in zebrafish spinal neurons. (A) Primary cultures of zebrafish spinal neurons were immunolabelled 8 or 24 hour post-plating (hpp) with spastin 86-340 (red) and α-tubulin (green) antibodies. Arrows indicate spastin enrichment in growth cones. Right panels are higher magnifications of the boxed region in the corresponding left panel. (B) Tg (HuC:Gal4; UAS:myr-Venus; UAS:DrM1) and Tg (HuC:Gal4; UAS:myr-Venus; UAS:DrM61) embryos were immunolabelled at 28-hpf with HA and GFP antibodies. Arrows point at DrM1 spastin enrichment in SMN growth cones. Bottom panels represent higher magnifications of the boxed region in the corresponding upper panel. Dashed lines in bottom panels delineate the growth cone area. (A-B) Scale bars: 10 μm. |
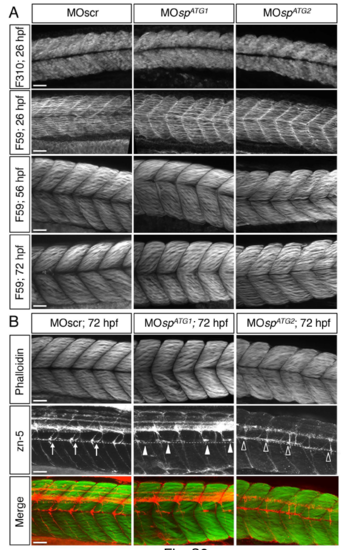
Axon pathfinding defects of ATG1 and ATG2 morphants are not associated with obvious alterations of muscle fibres. (A) Immunolabelling of fast (F310 antibody) and/or slow (F59 antibody) muscle fibres in 26-, 56- or 72-hpf embryos injected with MOscr, MOspATG1 or MOspATG2 morpholinos. Slow and fast muscle fibres are well specified and develop properly in morphant embryos or larvae compared to controls. ATG2 morphants only show a slight developmental delay. (B) Co-immunolabelling of sMN axons (zn-5 antibody) and muscle fibres (phalloïdin) in 72-hpf control, ATG1 and ATG2 morphant larvae. Dotted lines indicate the horizontal myoseptum. Arrows point at control rostral nerves, while full arrowheads and empty arrowheads respectively indicate misguided or missing rostral nerves in ATG1 or ATG2 morphants. Secondary motor axons of ATG1 and ATG2 morphant larvae fail to navigate properly in an apparently normal muscular environment. (A-B) Scale bars: 50 μm. |