
- Title
-
Embryonic Microglia Derive from Primitive Macrophages and Are Replaced by cmyb-Dependent Definitive Microglia in Zebrafish
- Authors
- Ferrero, G., Mahony, C.B., Dupuis, E., Yvernogeau, L., Di Ruggiero, E., Miserocchi, M., Caron, M., Robin, C., Traver, D., Bertrand, J.Y., Wittamer, V.
- Source
- Full text @ Cell Rep.
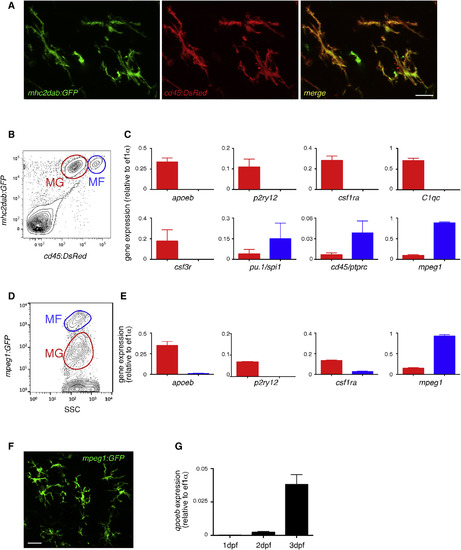
MG Identity Is Conserved in the Zebrafish (A) Fluorescence of GFP (left panel) and DsRed (middle panel) in the brain of adult cd45:DsRed; mhc2dab:GFP double-transgenic fish. The right panel shows a merge of both fluorescent channels (n = 3). Scale bar: 10 μm. (B) Flow cytometry analysis on brain cell suspensions from adult Tg(cd45:DsRed; mhc2dab:GFP) identifying cd45:DsRedlowmhc2dab:GFP+ MG (red gate, MG) and cd45:DsRedhighmhc2dab:GFP+ CNS-associated macrophages (blue gate, MFs). (C) Comparison of the relative expression of apoeb, p2ry12, csf1ra, C1qc, csf3r, mpeg1, pu.1/spi1b, and cd45/ptprc transcripts between MG (red bars) and MFs (blue bars) cell subsets isolated by FACS. Error bars represent mean ± SD (n = 3). (D and E) Flow cytometry of a brain cell suspension from adult mpeg1:GFP transgenics (D) and expression of apoeb, p2ry12, csf1ra, and mpeg1 by qPCR in FACS-sorted mpeg1:GFP+ cell subsets (E). Error bars represent mean ± SD (n = 3). (F) GFP immunohistochemistry on adult mpeg1:GFP brain sections. Scale bar: 25 μm. (G) apoeb expression in mpeg1:GFP+ cells sorted at 1, 2, and 3 dpf. MG, microglia; MFs, macrophages. EXPRESSION / LABELING:
|
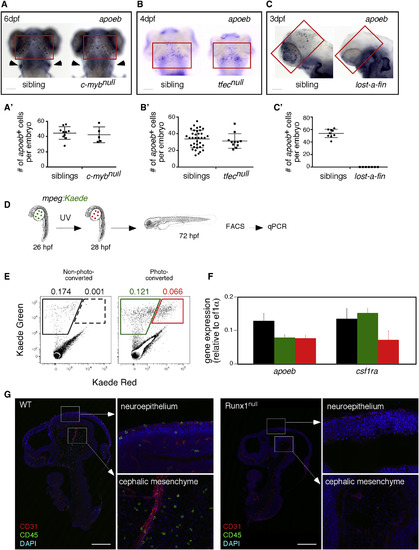
pMFs Are the Unique Source of MG in the Vertebrate Embryo (A–C) Expression of the MG marker apoeb (red quadrants) in the brains of cmybnull (A), tfecnull (B), alk8null(lost-a-fin) (C), and their sibling control animals at the indicated developmental stages. For (A), cmybnull embryos are identified by the concomitant absence of lymphoid-specific rag1 (arrowheads) transcripts in the thymus. Scale bar: 50 μm. (A′–C′) Quantification of apoeb+ MG in embryos of indicated genotypes. Each symbol represents a single embryo. Error bars represent mean ± SEM. (D) Strategy for transient fate mapping of pMFs in vivo. (E) Flow cytometry showing absence of kaede-Red expression in non-photoconverted embryos (left panel), whereas cells expressing both forms of kaede were present and sortable in the photoconverted embryos (right panel). (F) qPCR analyses for apoeb and csf1ra on mpeg1:kaede-Green cells sorted from control and photoconverted embryos, and on mpeg1:kaede-Green/Red cells from photoconverted embryos. The color code matches the gates on the FACS plots. Error bars represent mean ± SD (n = 3 experiments). (G) Sagittal sections of E10.5 Runx1null embryos and their littermates (upper body) immunostained for CD31 (vascular) and CD45 (hematopoietic) markers, with DAPI used as a nuclear counterstain. Tile-scanned images show that Runx1null mutants are completely devoid of CD45+ MG in the neuroepithelium and cephalic mesenchyme (n = 3). Scale bar: 500 μm. See also Figures S1–S3. EXPRESSION / LABELING:
PHENOTYPE:
|
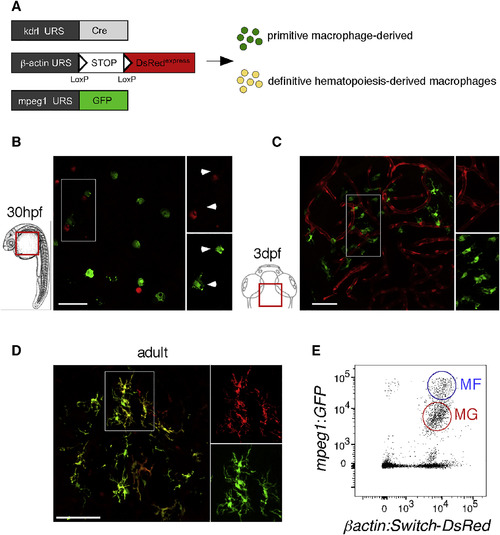
Embryonic and Adult MG Have Distinct Origins (A) Scheme of the transgenic lines used to address the MG potential of primitive versus definitive hematopoiesis. (B and C) Whole-mount fluorescence microscopy images of Tg(kdrl:Cre; ßactin:Switch-DsRed; mpeg1:GFP) triple-transgenic embryos show absence of DsRed expression (red) in GFP+ pMFs (green) on the yolk ball at 30 hpf (B), and in GFP+ embryonic MG (green) in the brain parenchyma at 3 dpf (C) (n = 14). (D) In contrast, in sections of adult triple-transgenic animals, DsRed labeling is observed in all GFP+ MG cells. (E) Flow cytometry analysis on a brain dissected from a 12-week-old triple-transgenic animal identifies blood-derived mpeg1:GFPhigh CNS-associated MFs (blue circle, MFs) and mpeg1:GFPlow MG (red circle, MG). Both populations express the DsRed reporter at high level (n = 5). Scale bar: 50 μm. MFs, macrophages; MG, microglia. See also Figures S4 and S5. |
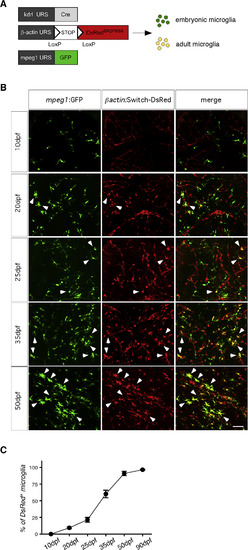
Kinetics of Adult MG Emergence during Zebrafish Development (A) Scheme of the transgenic lines used to discriminate pMF-derived embryonic MG from endothelial-derived adult MG. (B) GFP (left panels) and DsRed (middle panels) immunostaining performed on brain sections from Tg(kdrl:Cre; ßactin:Switch-DsRed; mpeg1:GFP) triple transgenics at the indicated developmental stage, showing the replacement of GFP+ DsRed− embryonic MG by GFP+ DsRed+ cells in the brain parenchyma. The right panels show a merge of both fluorescent channels. Scale bar: 50 μm. (C) Quantification of DsRed+ MG in the brain parenchyma during zebrafish development, determined as percent recombination among the whole GFP+ MG population. Error bars represent mean ± SEM of pooled data from two experiments (n = 3). MG, microglia. EXPRESSION / LABELING:
|

The Transcription Factor cmyb Is Required for the Establishment of Adult MG (A) Scheme of the hematopoietic cell transplantation experiments performed to circumvent the lethality of c-mybnull animals due to the lack of definitive hematopoiesis. (B) GFP immunostaining performed on adult brain sections from wild-type controls (upper panels) and rescued cmybnull mutants (lower panels), demonstrating a complete absence of host-derived GFP+ MG in the cmyb mutants (left panels), as well as the presence of GFP− donor-derived L-plastin+ hematopoietic cells (fuchsia, middle panels). The right panels show a merge of both fluorescent channels (n = 4). Scale bar: 50 μm. |
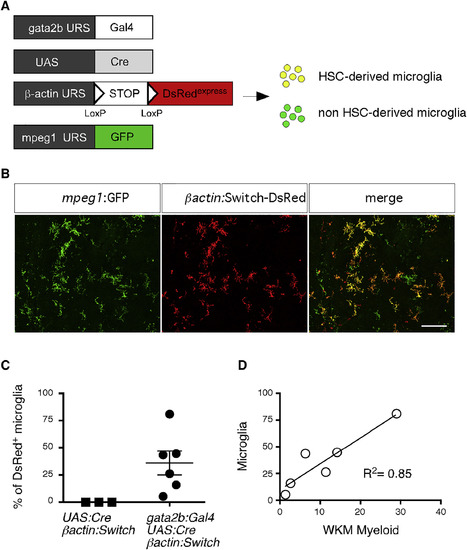
Adult MG Derive from Embryonic HSCs (A) Transgenic lines used to address the MG potential of embryonic HSCs. (B) GFP (left panel) and DsRed (middle panel) immunostaining performed on quadruple-transgenic adult brain sections. The right panel shows a merge of both fluorescent channels. (C) Pooled data from two experiments showing the percent recombination among brain MG in control (left) and gata2b:Cre adult fish (right) (n = 6). Error bars represent mean ± SEM. (D) Correlation and regression analysis (R2 = 0.85) between the chimerism in brain MG and the WKM myeloid fraction. MG, microglia; WKM, whole-kidney marrow. See also Figure S6. EXPRESSION / LABELING:
|
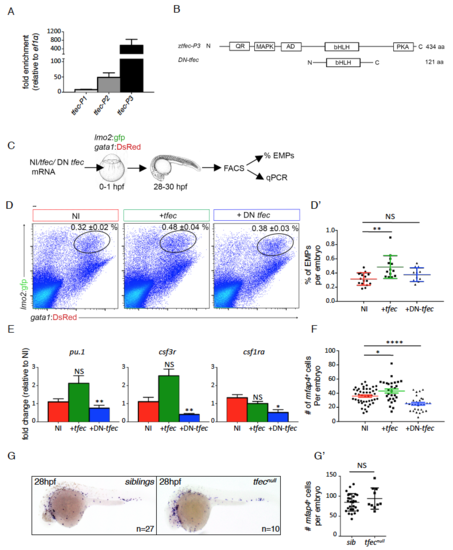
The transcription factor tfec controls EMP-derived hematopoiesis in vivo, related to Figure 2 (A) Quantification of tfec-P1 (NM_001030105.2), tfec-P2 (XM_005164535.2) or tfec P3 (XM_009299965.1) expression in FACS sorted EMPs from lmo2:GFP/gata1:DsRed embryos (27-28hpf). Fold enrichment for each tfec splice variant was calculated from expression levels in whole embryos (27-28hpf) (n=3). Error bars represent mean ± S.E.M. (B) Schematic diagram of translated proteins from tfec-P3 and a dominant-negative form of tfec (DN-tfec) mRNAs (bottom schematic). QR: glutamine rich domain, MAPK: consensus MAP kinase phosphorylation site, AD: transcriptional activation domain, bHLH: beta helix-loop-helix DNA binding domain, PKA: cAMP-dependant phosphorylation site, N: N terminal domain, C: C terminal domain, aa: amino acids. Schematics are not to scale. (C) Experimental outline to assess the consequence of tfec modulation on EMP biology in vivo. tfec mRNA (tfec), or DN-tfec were injected in Tg(lmo2:GFP; gata1:DsRed) embryos at the onecell stage. Controls are non-injected (NI). Lmo2+ gata1+ EMPs were quantified by flow cytometry and isolated for gene expression analyses. (D-D’) Representative FACS plots from NI controls (n=16), +tfec (n=13), +DN-tfec (n=12). Percentages in the top right hand corner represent mean ± S.E.M of EMPs within the gate. Comparative quantification is shown in the d’ panel. (E) QPCR data showing gene expression in FACS sorted EMPs for NI (n=4 for all, except csf1ra where n=3), +tfec (n=4 for all, except csf1ra where n=3) or DN-tfec (n=3 for all) conditions, where n represents the average of biological triplicates performed. Our results show that tfec loss-of-function strongly affects the expression of myeloid genes in EMPs. Error bars represent mean ± S.E.M. (F) Quantification of the number of mfap4+ cells (as determined by WISH) present within the tail region at 48hpf for NI (n=46), +tfec (n=28) or +DN-tfec (n=29) conditions. EMP-derived myelopoiesis is impaired in the loss of function condition. Error bars represent mean ± S.E.M. (G-G’) mfap4 WISH on siblings or tfecnull embryos at 28hpf. (g’) Quantification of mfap4+ primitive macrophages per embryo (one side). Statistical analysis was completed using an unpaired Student’s t-test, comparing NI to either +tfec or DN tfec injected. Data represents mean ± S.E.M. NS: no significance, *: p<0.05. **: p<0.01, ***: p<0.001. NI: non-injected, +tfec: hlztfec injected, +DN-tfec: dominant negative tfec injected. EXPRESSION / LABELING:
|
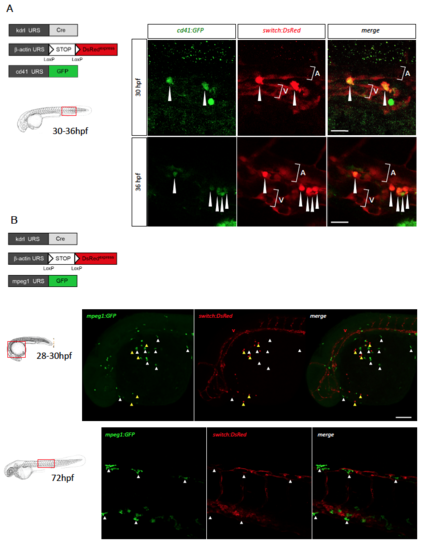
Zebrafish EMPs, but not primitive macrophages, derive from an endothelial precursor, related to Figure 3 (A) Triple transgenic kdrl:Cre;bactin2:loxP-STOP-loxP-DsRedexpress;cd41:GFP embryos were analyzed by confocal imaging at 30hpf (upper panels) and 36hpf (lower panels). Shown are GFP, DsRed and merged images of posterior blood island, posterior to the yolk tube extension. In this area, cd41+ erythro-myeloid precursors express both GFP and DsRed (white arrowheads). A= aorta, V= vein. Scale bar = 25μm. (B) Immunostaining and confocal microscopy analyses of triple transgenic Tg(kdrl:Cre;bactin2:loxP-STOPloxP- DsRedexpress;mpeg1:GFP) embryos at 28-30hpf (upper panels). Shown are GFP, DsRed and merged images of the rostral region, demonstrating the absence of co-localization between GFP+ pMFs emerging on the yolk (white arrowheads) and the DsRed reporter transgene. In contrast, DsRed expression is observed in the vasculature (V) and in hematopoietic cells subsequently identified as primitive neutrophils (yellow arrowheads). Scale bar = 100μm. Similar analyses performed at 72hpf (lower panels), showing GFP+DsRedpMFs spreading over embryonic tissues, here, in the trunk region. Scale bar = 50μm. |
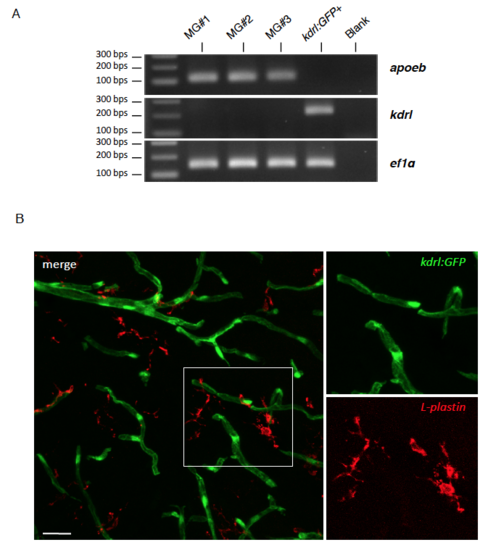
The kdrl promoter is not active in adult microglia, related to Figure 3 (A) RT-PCR shows that microglia (MG#1-3) do express apoeb but not kdrl. In contrast, sorted kdrl:GFP+ cells express kdrl but not apoeb. (B) Immunohistochemistry against GFP and l-plastin performed on adult brain sections dissected from a kdrl:GFP transgenic animal. The vascular marker (GFP) and pan-leukocyte marker (l-plastin) never colocalize, showing that adult microglia do not express kdrl. Scale bar = 25μm. |
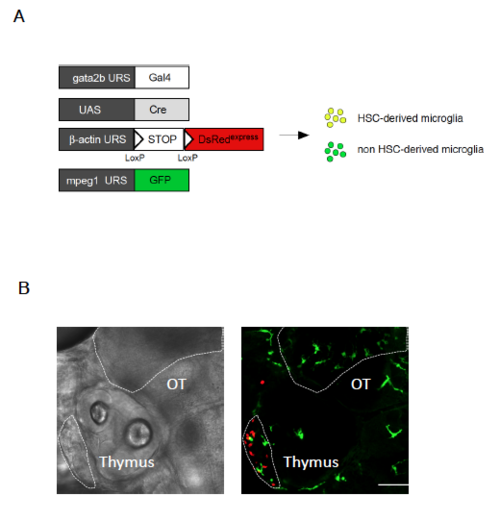
Gata2b-Cre does not label embryonic microglia, related to Figure 6 (A) Schematic of the transgenic lines used to investigate the contribution of embryonic HSCs to microglia ontogeny (B) Quadruple transgenic gata2b:Gal4; UAS:Cre; bactin:Switch-DsRed; mpeg1:GFP embryos were analyzed by confocal imaging at 5dpf. Shown are bright field (left panel) and GFP and DsRed merged images (right panel) of the head region. In the optic tectum (OT) area, mpeg1+ microglia only express GFP, while DsRed+ cells originating from HSCs are observed in the thymic anlage. Scale bar = 25μm. |