
- Title
-
Alas1 is essential for neutrophil maturation in zebrafish
- Authors
- Lian, J., Chen, J., Wang, K., Zhao, L., Meng, P., Yang, L., Wei, J., Ma, N., Xu, J., Zhang, W., Zhang, Y.
- Source
- Full text @ Haematologica
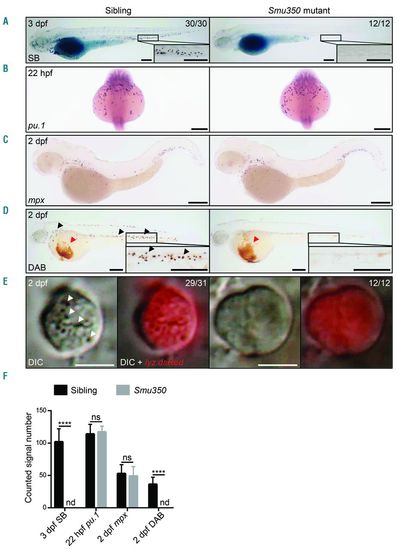
Neutrophil deficiency in smu350 mutants. (A) The Sudan black B (SB) signal was totally absent in smu350 mutants. SB staining in siblings (left) and smu350 mutants (right) at 3 days post fertilization (dpf). The boxed regions are magnified in the lower right-hand corner. (B) Whole-mount in situ hybridization (WISH) of pu.1 expression in siblings (left) and smu350 mutants (right) at 22 hours post fertilization (hpf). (C) WISH of mpx expression in siblings (left) and smu350 mutants (right) at 2 dpf. (D) DAB staining in siblings (left) and smu350 mutants (right) at 2 dpf. Signal points representing neutrophil peroxidase activity (black arrowheads) were absent in smu350 mutants. Red arrowheads indicate the hemoglobin signal. The boxed regions are magnified in the lower right-hand corner. (E) Neutrophil granules were absent in smu350 mutants. In vivo imaging of neutrophils in 2-dpf Tg(lyz:DsRed);smu350 embryos by VE-DIC microscopy. Neutrophils of siblings had abundant visible and highly mobilized granules (29 of 31 embryos), while neutrophils of smu350 mutants lacked granules (12 of 12 embryos). White arrowheads indicate neutrophil granules. (Left) Bright-field DIC image; (right) an overlay of bright-field DIC and fluorescent images. See also Online Supplementary Appendix, Movies 1 and 2. (F) Quantifications of SB+ cells in the posterior blood island (PBI), pu.1+ cells (B), mpx+ cells in the PBI (C), and DAB+ cells in the PBI (D). Mean±Standard Deviation (SD), n>15; Student t-test: ****P<0.0001. ns: not significant; nd: not detectable. Scale bars: 200 μm (A-D) and 5 μm (E). EXPRESSION / LABELING:
PHENOTYPE:
|

ZFIN is incorporating published figure images and captions as part of an ongoing project. Figures from some publications have not yet been curated, or are not available for display because of copyright restrictions. |
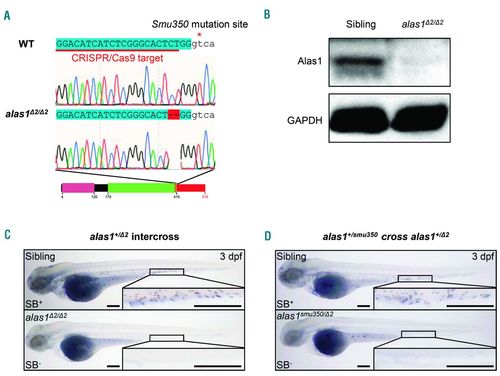
The alas1 was the causative gene of the smu350 mutant. (A) Sequencing analysis revealed a 2-bp deletion within exon 7 of alas1 in CRISPR/Cas9 generated alas1 Δ2/ Δ2 mutants. Uppercase sequences highlighted blue indicate exons; sequences in lowercase indicate introns. Sequences underlined in red indicate the CRISPR/Cas9 target in alas1. The red asterisk indicates the smu350 mutation site. Black boxes indicate the wild-type peptides, and the red box indicates the incorrect peptide generated by the altered splicing. The pink box indicates the pre-sequence domain (pfam09029). The green box indicates the aspartate aminotransferase superfamily (fold type I) domain of pyridoxal phosphate-dependent enzymes (cl18945). The box with zigzag edges indicates the truncated region. Black and red numbers denote distances to the start codon in wild type and mutants, respectively. (B) Alas1 protein was absent in alas1 Δ2/ Δ2 mutants. Examination of Alas1 protein expression in the whole fish body by western blotting at 5 days post fertilization (dpf). GAPDH was used as the loading control. (C) The Sudan black B (SB) signal was absent in alas1 Δ2/ Δ2 mutants. SB staining in siblings (upper) and alas1 Δ2/ Δ2 mutants (lower) at 3 dpf. Boxed regions are magnified in the lower right-hand corner. Scale bars: 200 μm. (D) SB signal was absent in alas1smu350/ Δ2 mutants. SB staining in siblings (upper) and alas1smu350/ Δ2 mutants (lower) at 3 dpf. Boxed regions are magnified in the lower right-hand corner. Scale bars: 200 μm. |
|
ZFIN is incorporating published figure images and captions as part of an ongoing project. Figures from some publications have not yet been curated, or are not available for display because of copyright restrictions. |
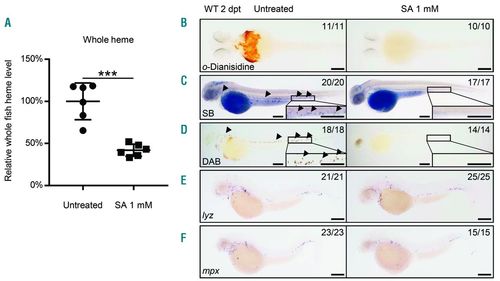
Heme was essential for neutrophil maturation. (A) Whole fish heme levels of succinylacetone (SA)-treated embryos were significantly decreased than those of untreated control. Relative whole fish heme levels in untreated control (circles) and SA-treated embryos (triangles) at 2 days post treatment (dpt). Lines show Mean±Standard Deviation (SD), 6 individual data points in each group, each data point was based on 3 measurements for 5 embryos; Student t-test: ***P<0.001. The relative heme level was normalized to per-fish level. (B) The o-Dianisidine signal was totally absent in SA-treated embryos. o-Dianisidine staining in untreated wild-type (left, 11 of 11 embryos) and SA-treated (right, 10 of 10 embryos) embryos at 2 dpt. (C) The Sudan black B (SB) signal was totally absent in SA-treated embryos. SB staining in untreated wild-type (left, 20 of 20 embryos) and SA-treated (right, 17 of 17 embryos) embryos at 2 dpt. Black arrowheads indicate the neutrophil signals. The boxed regions are magnified in the lower right-hand corner. (D) The DAB signal was totally absent in SA-treated embryos. DAB staining in untreated wild-type (left, 18 of 18 embryos) and SA-treated (right, 14 of 14 embryos) embryos at 2 dpt. Black arrowheads indicate the neutrophil peroxidase signals. The boxed regions are magnified in the lower right-hand corner. (E) WISH of lyz expression in untreated wild-type (left, 21 of 21 embryos) and SA-treated (right, 25 of 25 embryos) embryos at 2 dpt. (F) WISH of mpx expression in untreated wild-type (left, 23 of 23 embryos) and SA-treated (right, 15 of 15 embryos) embryos at 2 dpt. Scale bars: 200 μm (B-F). |
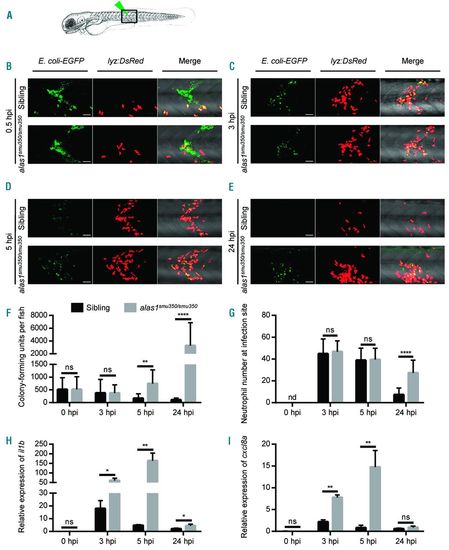
alas1 deficiency caused impaired host immunity against E. coli infection. (A) Arrowhead indicates the site of bacteria injection. The imaged region is boxed. (B-E) The in vivo behavior of neutrophils against E. coli was monitored by confocal microscopy. eGFP+ E. coli were subcutaneously injected over one somite into 3-day post fertilization (dpf) sibling (upper panels) and alas1smu350/smu350 mutant (lower panels) larva of the Tg(lyz:DsRed) background. Neutrophil behavior was analyzed through live imaging at 0.5 hours post injection (hpi) (B), 3 hpi (C), 5 hpi (D), and 24 hpi (E). All images are maximum-intensity projections from 25 steps × 2 μm. Scale bars: 50 μm. (F) Bacterial burden of embryos injected with E. coli. Significantly more bacterial cells were detected in alas1smu350/smu350 mutants (gray column) compared with siblings (black column) at 5 and 24 hpi. Mean±Standard Deviation (SD), n>10 in each group; Mann-Whitney U test: ****P<0.0001, **P<0.01, ns: not significant. (G) Quantification of recruited DsRed+ neutrophils at infection sites in live embryos injected with E. coli. Significantly more neutrophils were observed at the infection sites of alas1smu350/smu350 mutants (gray column) compared with siblings (black column) at 24 hpi. Mean±SD; n>19 in each group; Student t-test: ****P<0.0001. nd: not detectable, ns: not significant. (H) Relative il1b expression assessed by RT-qPCR. il1b expression was up-regulated in alas1smu350/smu350 mutants (gray column) compared with siblings (black column) at 3, 5, and 24 hpi. Mean±SD; n=4 in each group, performed in triplicate. Expression levels were adjusted for trauma [phosphate buffered saline (PBS) injection only]. Statistical significance was determined using Student t-test: **P<0.01, *P<0.05. ns: not significant. (I) Relative cxcl8a expression assessed by RT-qPCR. cxcl8a expression was up-regulated in alas1smu350/smu350 mutants (gray column) compared with siblings (black column) at 3 and 5 hpi. Mean±SD; n=4 in each group, performed in triplicate. Expression levels were adjusted for trauma (PBS injection only). Statistical significance was determined using Student t-test: **P<0.01. ns: not significant. EXPRESSION / LABELING:
PHENOTYPE:
|