
- Title
-
Neural crest state activation in NRAS driven melanoma, but not in NRAS-driven melanocyte expansion
- Authors
- McConnell, A.M., Mito, J.K., Ablain, J., Dang, M., Formichella, L., Fisher, D.E., Zon, L.I.
- Source
- Full text @ Dev. Biol.
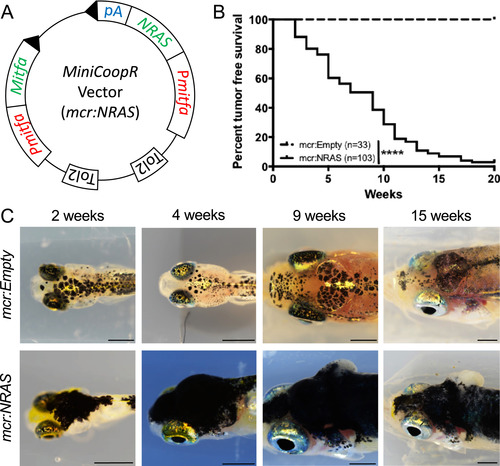
Zebrafish model of NRAS-driven melanoma. (A) Schematic of the MiniCoopR vector containing the NRASQ61R gene driven by the mitfa promoter (Pmitfa) in cis with the mitfa gene. (B) Kaplan-Meier curve showing the percent of casper;mcr:NRAS zebrafish without grossly apparently tumors compared to casper;mcr:Emptyfish. ****p < 0.0001 calculated using the log rank Mantel-Cox test. (C) Images of casper;mcr:NRAS and casper mcr:Empty fish taken at 2, 4, 9, and 15 weeks post fertilization. In contrast to the tumor formation seen in the casper;mcr:NRAS fish, normal melanocytepatterning is observed in casper;mcr:Empty controls. Scale bars represent 500 µm for 2 week images and 1000 µm for 4–15 week images. |
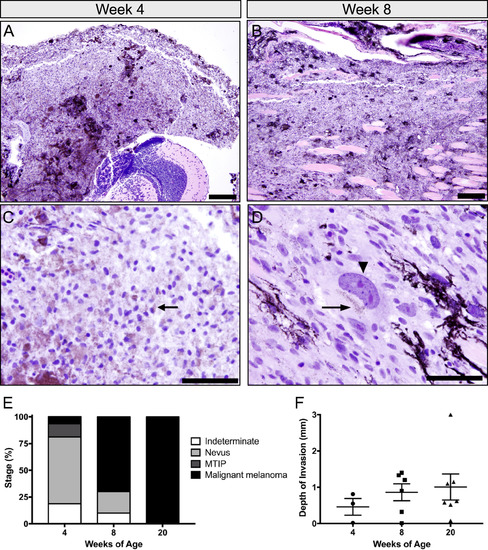
Histologic analysis of casper;mcr:NRAS zebrafish. (A-D) H&E of casper;mcr:NRAS fish. (A and C) Melanocytic tumor of indeterminate potential (MTIP) at 4 weeks of age (original magnification 200 ×). High magnification image in C shows an epithelioid morphology with minimal cytologic atypia (original magnification 1000 ×). (B and D) Malignant melanoma collected at 8 weeks of age, showing infiltrative growth through underlying skeletal muscle (original magnification 200 ×). A high magnification image shows cytologically malignant cells with significant anisonucleosis and prominent nucleoli (original magnification 1000 ×). Arrowhead shows enlarged nuclei with prominent nucleoli and arrows show melanin pigment. Scale bars represent 50 µm for (A) and (B) and 20 µm for (C) and (D). (E) Tumors collected at 4, 8, and 20 weeks were scored as either indeterminate, nevus (F-nevi), MTIP, or malignant melanoma based on histological assessment. n = 9–16 (F) No significant difference in the depth of invasion from the basement membranebetween 4, 8, and 20 week MTIP and melanomas (one-way ANOVA). n = 3–7. |
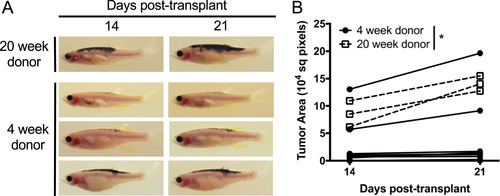
20 week casper;mcr:NRAS melanomas engraft upon transplantation. (A) Images of tumors in recipient fish at 14 and 21 days post-transplant. (B) 20 week casper;mcr:NRAS melanomas engraft significantly better upon transplantation than 4 week donors. *p = 0.0141 calculated by a two-way ANOVA. n = 3 and 11 for 20- and 4-week old donors respectively. |
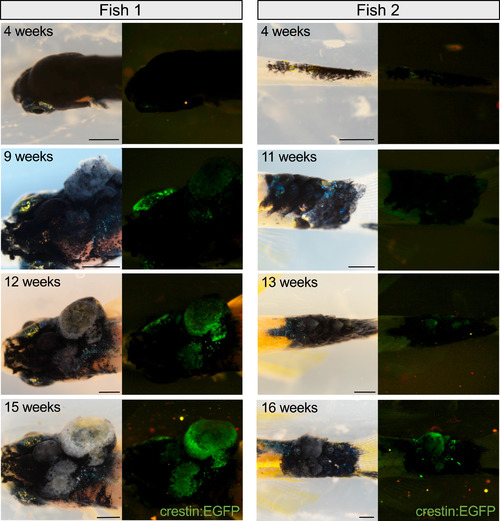
crestin:EGFP turns on at 9–12 weeks of age. Two examples of casper;mcr:NRAS;crestin:EGFP zebrafish at 4–16 weeks post-fertilization. The crestin:EGFP transgene appears to be activated at between 9 and 12 weeks of age. Scale bars represent 1000 µm for all images.
|
Reprinted from Developmental Biology, 449(2), McConnell, A.M., Mito, J.K., Ablain, J., Dang, M., Formichella, L., Fisher, D.E., Zon, L.I., Neural crest state activation in NRAS driven melanoma, but not in NRAS-driven melanocyte expansion, 107-114, Copyright (2018) with permission from Elsevier. Full text @ Dev. Biol.