
- Title
-
PAX3-FOXO1 transgenic zebrafish models identify HES3 as a mediator of rhabdomyosarcoma tumorigenesis.
- Authors
- Kendall, G.C., Watson, S., Xu, L., LaVigne, C.A., Murchison, W., Rakheja, D., Skapek, S.X., Tirode, F., Delattre, O., Amatruda, J.F.
- Source
- Full text @ Elife
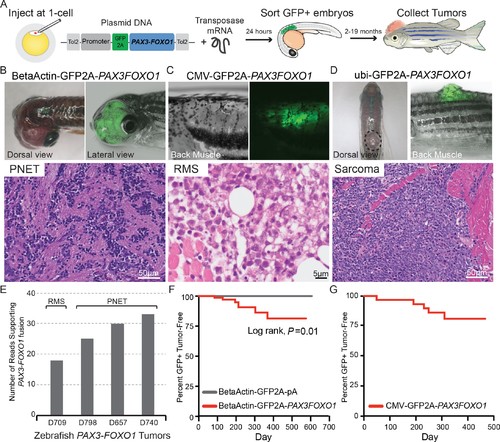
Zebrafish models of human PAX3-FOXO1 tumorigenesis. (A) Zebrafish were injected at the single-cell stage with mosaic GFP2A-tagged human PAX3-FOXO1 under the control of various promoters. At 24 hr old, embryos were sorted for GFP expression indicating successful injections (typically 99% GFP+) and were allowed to grow and monitored for up to 19 months to develop tumors. (B) Beta-actin-driven PAX3-FOXO1 primarily produced primitive neuroectodermal tumors in a wild-type genetic background. Shown for all tumors are representative examples with the presentation of gross morphology and GFP expression patterns coupled with a hematoxylin and eosin stain. (C) CMV-driven PAX3-FOXO1 produced rhabdomyosarcoma in the tp53M214K/M214K-sensitized genetic background. (D) Ubiquitin-driven PAX3-FOXO1 produced an undifferentiated sarcoma in a wild-type genetic background. (E) RNAseq data from zebrafish PAX3-FOXO1 fluorescent tumors showing the number of reads supporting the presence of the human fusion-oncogene. (F) Tumor incidence of GFP + tumors detected in BetaActin-GFP2A-PAX3FOXO1 (n = 74) injected zebrafish versus BetaActin-GFP (n = 147) injected controls in a wildtype genetic background. (G) Tumor incidence of GFP + tumors detected in CMV-GFP2A-PAX3FOXO1 (n = 31) injected zebrafish in a tp53M214K-sensitizing genetic background. |
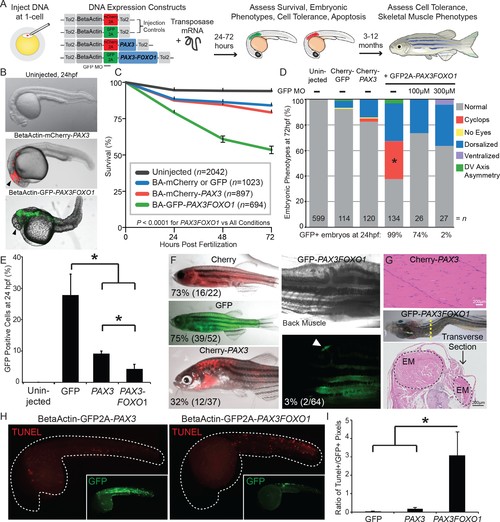
PAX3 and PAX3-FOXO1 have distinct impacts and tolerance during embryonic development and in adult zebrafish. (A) Strategy for assessing functional differences of beta-actin-driven PAX3 and PAX3-FOXO1 in a vertebrate system. (B) Representative images at 24 hr post-fertilization of Uninjected, mCherry2A-PAX3, and GFP2A-PAX3FOXO1-injected zebrafish. (C) Survival curve of Uninjected, GFP2A or mCherry2A injected controls, mCherry2A-PAX3, and GFP2A-PAX3FOXO1. Error bars represent SE. Log rank test, p<0.0001 for PAX3FOXO1 versus all other conditions. (D) Embryonic phenotypes scored at 3 days post-injection. * indicates p<0.05, for PAX3 vs PAX3FOXO1, Fisher’s exact test. MO- morpholino. DV- Dorso-Ventral. (E) Percentage of GFP + cells from dissociated zebrafish embryos as quantified by fluorescent activated cell sorting (FACS). Error bars represent SD across three independent experiments. * indicates p<0.05, two-tailed Student’s t-test. (F) Adult zebrafish over 3 months of age robustly expressed beta-actin-driven Cherry, GFP, or Cherry2A-PAX3 and developed normally. Zebrafish injected with BetaActin-GFP2A-PAX3FOXO1 displayed developmental defects or developed tumors. Arrow denotes GFP + area. The percentage indicates zebrafish with detectable fluorescence at adulthood. (G) Hematoxylin and eosin staining showed normal histology of BetaActin-PAX3 expressing skeletal muscle (sagittal section) at 299 days of age, and abnormal histology of BetaActin-PAX3FOXO1 epaxial muscle exhibiting dramatic left-right asymmetry (transverse section, asymmetry of left-right epaxial muscle (EM) marked by dotted lines) at 307 days of age. Scale bars, 200 microns. EM- epaxial muscle. (H) Representative images from zebrafish embryos injected with GFP2A-PAX3 and GFP2A-PAX3FOXO1 that are fixed at 24 hr post-injection and then TUNEL performed (rhodamine). Embryos were counter-stained for GFP to indicate transgene expression. (I) Quantification of TUNEL-positive pixels normalized to GFP positive pixels, indicated a higher proportion of PAX3-FOXO1 cells were undergoing apoptosis. Error bars represent SD, n = 6–8 embryos per group, * indicates p<0.05, two-tailed Student’s t-test. |
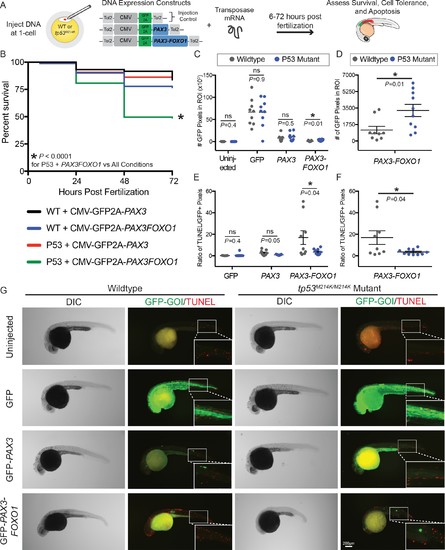
The tp53M214K mutation modifies the CMV-PAX3FOXO1 phenotype in developing zebrafish. (A) Schematic of the experimental strategy to assess the impact of a tp53 mutation on survival, cell tolerance, and apoptosis of mosaic CMV restricted GFP, GFP-PAX3, or GFP-PAX3FOXO1 developmental expression. (B) Survival of PAX3 injected wildtype (n = 89) or tp53M214K/M214K (n = 146) as compared to PAX3-FOXO1 injected wildtype (n = 199) or tp53M214K/M214K (n = 219) evaluated at 6, 24, 48, and 72 hr post fertilization. All constructs were injected in equimolar amounts relative to 25 ng/µL of CMV-GFP2A-PAX3FOXO1. (C) Quantification of the number of GFP-positive pixels for each embryo imaged at 28 hr post fertilization using the same settings. Each marker represents a single zebrafish embryo, n = 8–10 embryos per group. Black bar is the mean, error bars represent SEM, and * indicates p<0.05, two-tailed Student’s t-test, ns- not significant. ROI- region of interest. (D) Same samples as in C plotted for the PAX3-FOXO1 injection groups only. (E) Quantification of TUNEL-positive pixels normalized to GFP-positive pixels indicated a lower proportion of PAX3-FOXO1 cells are undergoing apoptosis in the context of the tp53M214K/M214K mutation. Black bar is the mean, error bars represent SEM, n = 8–10 embryos per group, * indicates p<0.05, two-tailed Student’s t-test. (F) Same samples as in E plotted for the PAX3-FOXO1 injection groups only. (G) Representative images from wildtype and tp53M214K/M214K uninjected controls, CMV-GFP2A injection controls, CMV-GFP2A-PAX3 and CMV-GFP2A-PAX3FOXO1 injected experimental groups. Embryos were fixed at 28 hr post-injection, TUNEL (rhodamine) performed, and then embryos were counter-stained for GFP to denote transgene expression. |
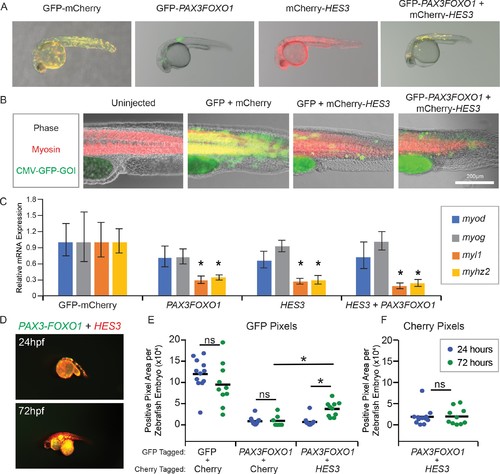
HES3 inhibits myogenic differentiation in developing zebrafish and supports persistence of PAX3-FOXO1-positive cells. (A) Zebrafish embryos were injected at the single-cell stage with the beta actin promoter driving GFP-Cherry, GFP-PAX3FOXO1, mCherry-HES3, or combined mCherry-HES3 and GFP-PAX3FOXO1. Shown are representative embryos at 24 hr post fertilization with indicated transgene expression. (B) Representative overlays of zebrafish embryo musculature that were fixed at 24 hr and immunofluorescence performed for myosin (red) and injected genes of interest (GOI; green). (C) Pools of n = 5 embryos were harvested at 24 hr and markers of myogenesis assessed by qRT-PCR, including myod, myog, myl1, and myhz2. SD is derived from technical triplicates. * indicates significant differences between treatment group and the GFP-mCherry control at a threshold of p<0.05, two-tailed Student’s t-test. (D) Representative overlay of images from co-injections of mCherry-HES3 and GFP-PAX3FOXO1 from the same embryo at 24 and 72 hr post-fertilization. Images were taken with the same exposure settings and objective. (E) Quantification of the number of positive pixels for each embryo imaged at 24 and 72 hr post-fertilization. GFP-positive pixels are plotted after the same settings are applied for imaging and analysis. Each marker represents a single zebrafish embryo at 24 or 72 hr post fertilization, n = 6–12 embryos per group. Black bar is the mean, and * indicates p<0.05, two-tailed Student’s t-test. ns- not significant. (F) Same analysis as in E but for mCherry positive pixels. |
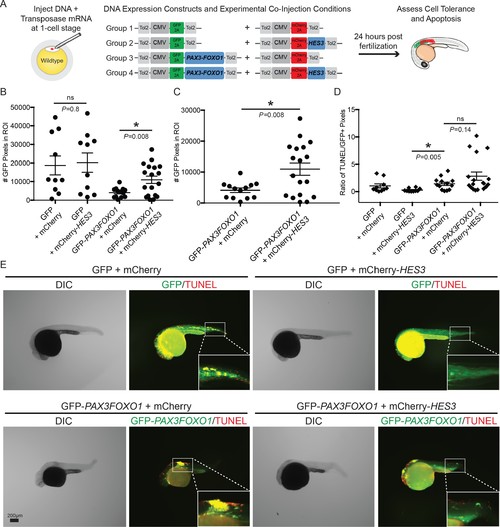
HES3 facilitates cellular tolerance of CMV-PAX3FOXO1 expression in developing zebrafish but does not alleviate the apoptosis phenotype. (A) Schematic of the strategy to assess the impact of human HES3 expression on PAX3-FOXO1 cell tolerance and apoptosis in wildtype developing zebrafish. The CMV promoter was utilized in a mosaic injection strategy, and the experimental groups included the following combinations of two independent plasmids: (1) GFP + mCherry, (2) GFP + mCherry-HES3, (3) GFP-PAX3FOXO1 + mCherry, and (4) GFP-PAX3FOXO1 + mCherry-HES3. Concentrations of injected plasmids were an equivalent molarity to 25 ng/µL of CMV-GFP2A-PAX3FOXO1 (B) Quantification of the number of GFP positive pixels for each embryo imaged at 24 hr post-fertilization using the same settings. Each marker represents a single zebrafish embryo, n = 10–18 embryos per group. Black bar is the mean, error bars represent SEM, and * indicates p<0.05, two-tailed Student’s t-test, ns- not significant. ROI- region of interest. (C) Same samples as in B plotted for the PAX3-FOXO1 and PAX3-FOXO1 + HES3 injection groups. (D) Quantification of TUNEL-positive pixels normalized to GFP-positive pixels indicates that HES3 is not inhibiting PAX3-FOXO1-induced apoptosis at 24 hr post fertilization. Black bar is the mean, error bars represent SEM, n = 10–18 embryos per group, * indicates p<0.05, two-tailed Student’s t-test. ns- not significant. (E) Representative images from the four injection groups: (1) GFP + mCherry, (2) GFP + mCherry-HES3, (3) GFP-PAX3FOXO1 + mCherry, and 4) GFP-PAX3FOXO1 + mCherry-HES3. Embryos were fixed at 24 hr post-injection, TUNEL (rhodamine) performed, and then embryos were counter-stained for GFP to denote transgene expression. |