
- Title
-
A Brain-wide Circuit Model of Heat-Evoked Swimming Behavior in Larval Zebrafish
- Authors
- Haesemeyer, M., Robson, D.N., Li, J.M., Schier, A.F., Engert, F.
- Source
- Full text @ Neuron
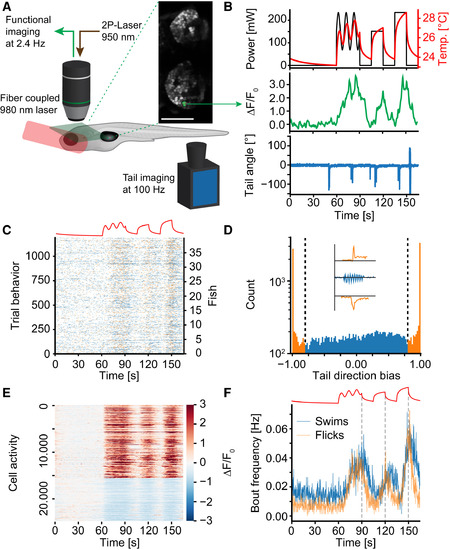
A Paradigm to Probe Heat Perception in Larval Zebrafish (A) Setup schematic. Green plane depicts example imaging plane and inset shows habenulae imaged in one experiment. The activity of the green nucleus is depicted in (B). (B) Top shows the delivered laser power in each repeat (black line) as well as the repeat-average temperature experienced by the fish (red line). Middle depicts repeat averaged calcium activity of one example ON cell. Bottom depicts example tail-trace during one repeat of one imaging plane. (C) Behavior raster plot (summed across repeats) of 1,200 planes imaged across 40 fish. Blue ticks identify the start of swim bouts, orange ticks the start of flick bouts. Stimulus depicted on top for reference. (D) Histogram of directional bias (see STAR Methods) of tail movement across all bouts in 40 fish. Coloring and dashed lines reflect cutoff between “flick” and “swim” categories. Inset shows example tail traces during flick to the left (top), swim (middle), and flick to the right (bottom). (E) Heatmap of trial-averaged activity of all heat-responsive cells across all experiments. Cells are sorted according to ON versus OFF criteria. Color scale indicates ΔF/F0. (F) Average bout frequencies of flick (orange line) and swim (blue line) type bouts. The stimulus is depicted on top for reference. Dashed gray lines indicate start of temperature decline to reveal off response in swims. See also Figure S1. |
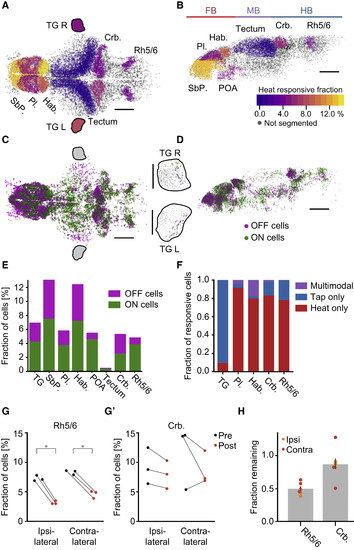
Heat-Related Activity Is Widespread across the Brain (A and B) Fraction of heat-responsive cells within selected brain regions. Color scale indicates percentage of heat-sensitive cells within each region. Grey cells indicate brain regions that were not segmented. Scale bars, 100 μm. Pl.: pallium, SbP.: subpallium, Hab.: habenula, Crb.: cerebellum, Rh5/6: hindbrain rhombomeres 5 and 6, POA: preoptic area, TG L/R: left/right trigeminal ganglion. Colored lines on top delineate major subdivisions of the brain, FB: forebrain, MB: midbrain, HB: hindbrain. Note that trigeminal ganglia are not to scale. (A) Dorsal view of the brain, anterior left, left side bottom. (B) Side view of left hemisphere, anterior left, dorsal top. (C) Distribution of ON (green) and OFF (magenta) cells across the zebrafish brain (top projection). The projection shows all cells identified across 30 individual experiments which have been registered onto a common reference brain. Scale bar, 100 μm, anterior left, left side bottom. Black outlines mark approximate location of trigeminal ganglia which are shown in insets to the right (TG L/R, left/right trigeminal ganglion). Each trigeminal ganglion depicts cells across five fish registered onto a common reference ganglion. Scale bar, 50 μm, anterior left. (D) Side view of the brain in (C); only cells in the left hemisphere are depicted. Scale bar, 100 μm, anterior left, dorsal top. (E) Fraction of heat ON cells (green) and heat OFF cells (magenta) in select brain regions. (F) For regions that were imaged in heat and tap experiments, the fraction of stimulus-responsive cells that only responded to the heat stimulus (red), cells that only responded to the tap stimulus (blue) and multimodal cells that responded to both heat and tap (purple). (G and G’) Effect of ablating one trigeminal ganglion on the fraction of heat-responsive neurons in each brain hemisphere in Rh 5/6 (G) and the cerebellum (G’) in three individual fish. Black dots show fraction of heat-responsive cells before and red dots after ablation. ∗ = p < 0.05, rank-sum test. (H) Fraction of pre-ablation heat-responsive cells remaining after ablation across Rh 5/6 and the cerebellum. Bar indicates average with bootstrap standard error across six hemispheres. Orange dots indicate ipsilateral effect, red dots indicate contralateral. See also Figure S2. |
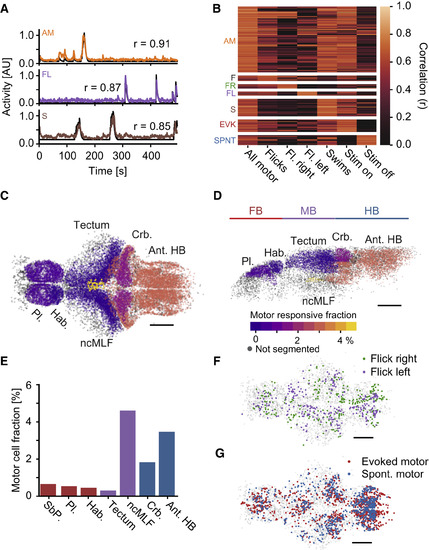
Motor Cells Can Be Separated According to Behavior and Stimulus Conditions (A) Example behavioral regressors (black) and activity trace of one correlated cell. Top: Cell encoding all motor events in a plane (orange); middle: cell encoding left flicks in a plane (purple); bottom: cell encoding swims in a plane (brown). Numbers indicate correlation coefficient. (B) Clustered heatmap of correlations of motor-cell activity with motor regressors, including the following events: All motor: all motor events of a given plane; Flicks: only flicks in a plane; Right/left flicks: only included right/left flicks; Swims: only swims included; Evoked motor: only motor events while the heat stimulus was on were included; Spontaneous motor: only motor events while the heat stimulus was off were included. Cells are only assigned to a more specialized motor cluster if the correlation to the specialized regressor is significantly higher than to the general regressor (p < 0.01, bootstrap hypothesis test). all-motor (AM): N = 5049 cells; flicks (F): N = 420; flick-right (FR): N = 319; flick-left (FL): N = 298; swims (S): N = 1338; evoked-motor (EVK): N = 950; spontaneous-motor (SPNT): N = 763. 30 fish. (C and D) Fraction of motor correlated cells within selected brain regions. Color scale indicates percentage of motor-correlated cells within each region. Scale bars, 100 μm. Pl.: pallium, Hab.: habenula, ncMLF: nucleus of the medial longitudinal fascicle, Crb.: cerebellum, Ant. HB: anterior hindbrain. Grey cells indicate brain regions that were not segmented. (C) Dorsal view of the brain, anterior left, left side bottom; (D) side view of left hemisphere, anterior left, dorsal top. (E) Quantification of percentage of motor correlated cells in select brain regions. Red bars: forebrain; purple: midbrain; blue: hindbrain. (F) Distribution of flick-right (green) and flick-left (purple) cells, top projection. Anterior left, scale bar, 100 μm G) Distribution of evoked-motor (red) and spontaneous-motor (blue) cells, top projection. Anterior left, scale bar, 100 μm. Grey cells in (F)–(G) are non-motor-related cells representing brain outline. See also Figure S3. |
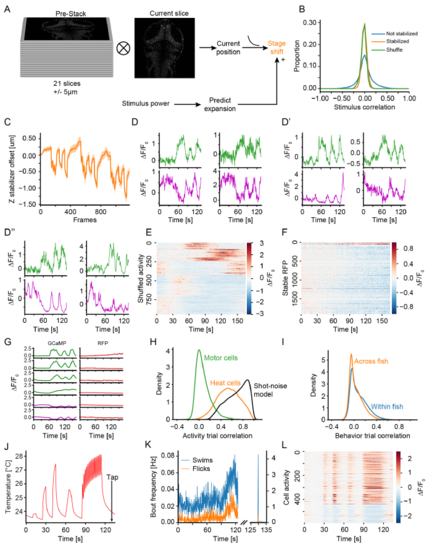
A paradigm to probe heat perception in larval zebrafish. (A) Schematic of z-stabilization during image acquisition. Before acquisition of experimental data in each plane a small pre-stack spanning 10m around the plane of interest was acquired. Each acquired slice during the experiment was subsequently cross-correlated to each slice in the pre-stack to predict the most likely current z-position. Based on the identified current position a required stage-shift was computed and applied after low-pass filtering. At the same time data acquired using nuclear expressed RFP was used to calibrate a predictive model that pre-empted stage movements. Using this model small stage-shifts were applied concurrently with the heat stimulus to offset delays caused by the low-pass filter. (B) Comparison of stimulus correlations observed in nuclear RFP stacks during heating trials. Since RFP is not calcium sensitive observed stimulus correlations are due to heat-induced movements of the preparation. The blue curve without stabilization indicates observable stimulus correlations while the juxtaposition of the orange line (with stabilization) and the green line (shuffled data) indicates that stabilization removes all spurious stimulus correlations. (C) Example average stage movements performed by the stabilizer during one experiment consisting of 30 imaged planes. A negative offset indicates that the objective was moved away from the specimen, consistent with heatinduced expansion of the preparation. Shaded area reflects bootstrap standard error (N=30 planes). (D-D”) Trial average activity of typical example neurons across multiple brain regions (Trigeminal ganglion D, Rhombomere 5/6 D’ and Pallium D”). ON cells in green, OFF cells in magenta. (E) Trial average clustered activity profiles after data shuffling. Note that the activity profiles do not show any relation to the stimulus and furthermore that the number of identified cells is greatly reduced compared to Figure 1E. Color indicates F=F0. (F) Trial average clustered activity profiles when applying spectral clustering to the stabilized RFP dataset. Since RFP fluorescence does not reflect neuronal activity there should be no observable stimulus related changes in fluorescence. The fluorescence changes retrieved through clustering are indeed largely unstructured and importantly unrelated to the activity extracted from functional imaging experiments (Figure 1E). Also note the difference in scale between the heat map in Figure 1E and S1E. Color indicates F=F0. (G) Comparison of cluster average activity extracted from experimental nuclear GCaMP expressing and RFP expressing control fish. ON clusters green, OFF clusters magenta, RFP clusters red. Averages presented here are extracted from the whole brain dataset. For RFP the clustering still retrieves cells but since clustering is based on correlation these will now correspond to small-scale artifacts which are very different in dynamics and amplitude from stimulus induced GCaMP signals. (H) Distributions of trial-to-trial correlations of observed calcium activity in motor cells (green curve), heat cells (orange curve) in comparison to expected correlations based on observing the exact same activity in a shot-noise limited imaging system such as a 2-photon microscope (black curve). (I) Distributions of trial-to-trial correlations of behavior instantiations comparing trials within fish (blue curve) as well as across fish (orange curve). (J) Trial average temperature stimulus presented in the heat and tap experiments. The arrow indicates the time the tap stimulus was delivered in each trial. Note that this stimulus and imaging set served two purposes. On the one hand the co-representation of taps allowed us to describe uni- versus multimodal cells (Figure 2 and S2) and the different temperature dynamics allowed us to test our circuit model (Figure 6 and S6). (K) Behavior induced in heat plus tap experiments. The right subplot shows bout frequencies of swims (blue line) and (flicks) during the temperature stimulus, and the right sub-plot shows behavior around the time of the tap. Note the vastly different scale of the y-axis as taps induced behavior in more than 99 % of trials. (L) Trial average activity of cells that showed significant heat responses during heat and tap experiments sorted into ON and OFF types. Color indicates F=F0. |