
- Title
-
Modulation of F-actin dynamics by maternal mid1ip1L controls germ plasm aggregation and furrow recruitment in the zebrafish embryo
- Authors
- Eno, C., Pelegri, F.
- Source
- Full text @ Development
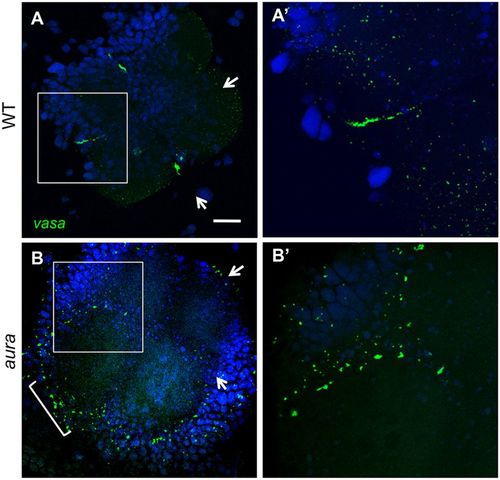
aura mutant embryos fail to recruit germ plasm to the furrows. (A-B′) vasa RNA localizes to the furrow in wild type (A,A′) but not in aura mutants (B,B′), where it instead localizes to the blastodisc periphery (B, bracket). Arrows indicate cleavage planes for the first and second cell cycles. Boxed regions in A,B are shown in A′,B′. Scale bar: 100 μm in A,B; 50 μm in A′,B′. |
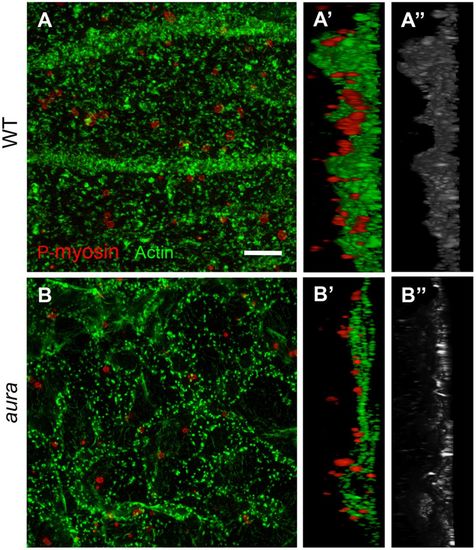
Germ plasm RNP aggregates associate with Mid1ip1L-dependent cortical F-actin contractions. (A-B″) SIM images of cortical F-actin and germ plasm RNPs (anti-P-myosin) in wild type (A-A″) and aura mutants (B-B″), with orthogonal views (A′,B′, F-actin/RNPs; A″,B″, F-actin alone). Scale bar: 5 μm. |
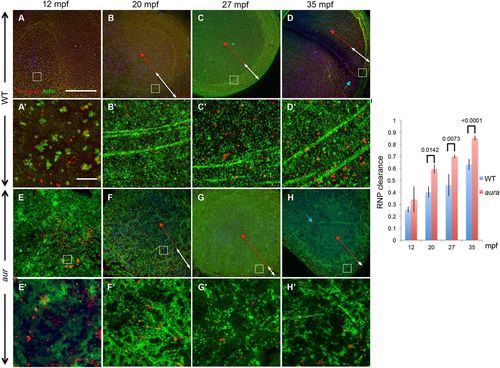
Increased outward movement of germ plasm RNPs in aura/mid1ip1l mutants. (A-D) In wild-type embryos, RNPs, which are initially distributed throughout the blastodisc, progressively accumulate as a peripheral band coincident with F-actin arc formation and peripheral movement. (E-H) In aura mutants, F-actin arcs fail to form and the field of RNPs narrows at a faster rate. White double-headed arrows highlight the RNP field; red double-headed arrows indicate the distance from the center of the embryo to the inner rim of aggregates at the RNP field. Blue arrows (D,H) indicate furrow F-actin. A′-H′ are magnified regions of A-H at the location indicated by insets. Scale bars: in A, 100 μm for A-H; in A′, 10 μm for A′-H′. (I) Quantitation of outward RNP movement, with the location of the RNP aggregating front determined upon magnification of the image. Significance was determined using an unpaired t-test. Data are mean±s.e.m. |
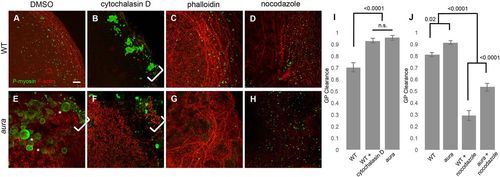
Modulation of germ plasm RNP outward movement depends on cortical F-actin. (A-H) RNPs (green) and cortical F-actin (red) in control- (DMSO), cytochalasin D-, phalloidin- and nocodazole-treated wild-type (A-D) and aura mutant (E-H) embryos. F-actin inhibition with cytochalasin D in wild-type embryos leads to large RNP aggregates at the distal edge of the blastodisc (B), mimicking the aura mutant phenotype (E; large spherical structures are retained cortical granules; Eno et al., 2016). F-actin stabilization with phalloidin (C,G) does not have a significant effect in wild type (C) but reduces ectopic RNP aggregate accumulation in aura mutants (G). Inhibition of microtubules with nocodazole (D,H) results in reduced outward RNP movement in both wild type (D; Theusch et al., 2006) and aura mutants (H). Brackets indicate ectopic marginal RNP aggregate accumulation. (I,J) Quantitation of RNP outward clearing. Significance was determined using an unpaired t-test. Data are mean±s.e.m. Scale bar: 10 μm. |
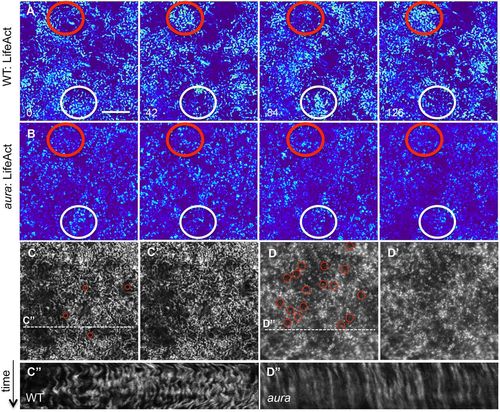
Dynamic waves of cortical F-actin depend on aura/mid1ip1 function. (A,B) In live wild-type embryos, cortical F-actin shows cyclical patterns of apparent enrichment, whereas this network appears static in aura mutants (B) (in each case, red and white circles highlight two different cortical locations). Still images of LifeAct transgenic embryos spaced 42 s apart (Movie 1). (C-D′) The F-actin network towards the end of the movie sequence highlights that F-actin forms a punctate pattern as well as numerous round F-actin structures (red circles) in mutants (D,D′) that are present in lower numbers in wild type (D,D′). (C″,D″) Kymographs of cortical F-actin (data from dashed lines in C′,D′, representing 70 time points in a 140 s period) show lateral undulations in wild type and a static network in aura mutants. Scale bar: 10 μm. |
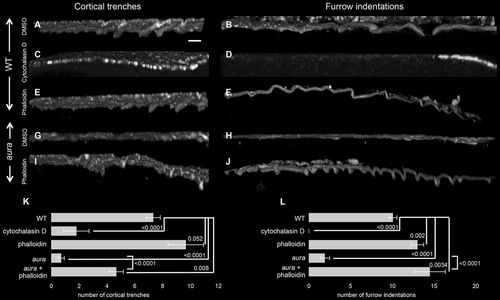
F-actin cortical trenches and furrow indentations depend on aura/mi1ip1L function. (A-J) Orthogonal views of cortical and furrow F-actin in wild-type and aura mutant embryos treated with drugs targeting F-actin. Wild-type embryos exhibit cortical trenches (A) and furrow indentations (B), which are missing in aura mutants (G,H). In wild type, actin inhibition with cytochalasin D abolishes the formation of both cortical trenches (C) and furrow indentations (D). Treatment with the F-actin stabilizer phalloidin allows cortex trenches (E) and furrow indentations (F) in wild type and rescues the formation of these structures in aura mutants (I,J). (K,L) Quantitation of the number of cortical trenches and furrow indentations under the various conditions, using data from at least seven images per condition. Significance was determined using an unpaired t-test. Data are mean±s.e.m. Scale bar: 10 μm. |
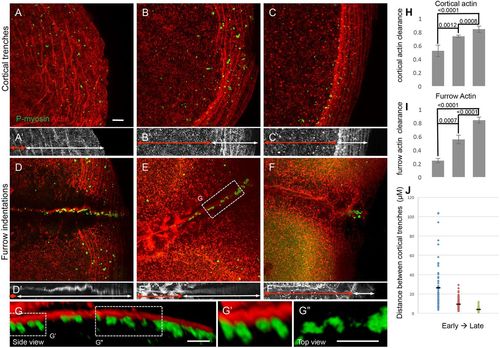
F-actin cortical trenches and furrow indentations exhibit a directional progression and are associated with germ plasm RNPs. (A-C) Wild-type embryos fixed prior to furrow formation (A, 35 mpf; B, 50 mpf; C, 65 mpf; animal with blastodisc center to the left and blastodisc periphery to the right). F-actin arcs, associated with RNP aggregates, move outwards as they form a more-dense network. A′-C′ highlight the region of F-actin arcs (white double-headed arrows) and the distance from the center of the blastodisc to the inner rim of the F-actin arc region (red double-headed arrows). (D-F) Wild-type embryos fixed during furrow formation (D, 35 mpf; E, 50 mpf; F, 65 mpf; animal view with furrow medial region to the left and furrow distal end to the right). The region containing RNPs, which progressively becomes more distally restricted, corresponds to that exhibiting F-actin furrow indentations, as revealed by orthogonal views (D′-F′). In D′-F′, white double-headed arrows encompass the region with F-actin indentations and red double-headed arrows the more medial region with F-actin of an even and wider span, and with a punctate appearance, which likely correspond to the forming cell adhesive wall (Jesuthasan, 1998; Urven et al., 2006). (G) Orthogonal view of the furrow showing association of RNP aggregates with F-actin furrow indentations. (G′) RNP aggregates wedged within cytoplasmic spaces between indentations. (G″) An apparent stream of individual RNPs between larger aggregates (rotated as a top view for better visualization). In all images, RNPs (P-myosin) are in green and F-actin is in red, except the RNP and F-actin channels have been omitted for clarity in A′-F′ and G′′, respectively. (H) Quantification of cortical actin clearance as the ratio of the distance from the center of the blastodisc to the region of cortical F-actin trenches (red double-headed arrows in A′-C′) over the blastodisc radius. (I) Quantification of furrow actin clearance as the distance from the center of the furrow to the region of furrow F-actin indentations (red double-headed arrows in D′-F′) over the half-length of the furrow. (J) Quantification of the distance between individual F-actin arcs (distance between their peak intensity) within the blastodisc arc region (double-headed arrows in A′-C′), showing increasing density of F-actin network during its peripheral restriction. Significance was determined using an unpaired t-test. Data are mean±s.e.m. Scale bars: 10 μm. |
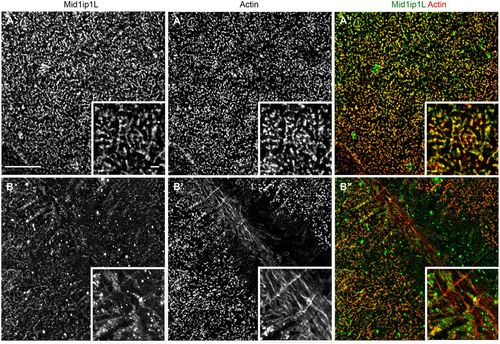
Mid1ip1L protein localizes with cortex and furrow actin. (A-B″) SIM images of single and merged channels showing partial colocalization of Mid1ip1L protein with F-actin in wild-type embryos. (A-A″) At the cortex, Mid1ip1L protein partially colocalizes with the cortical F-actin. (B-B″) At the furrow, Mid1ip1L protein also partially colocalizes with transverse F-actin at furrow distal ends, which corresponds to furrow F-actin indentations (see also Fig. S5). Insets show a magnified view within the field. Scale bar: 10 μm in A-B″; 1 μm in insets. |
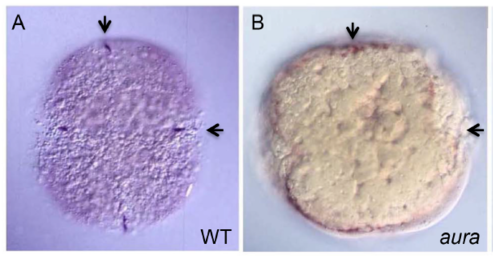
vasa RNA localization in aura mutant embryos. 4-cell stage embryos showing normal RNA furrow localization in wild-type (A) and reduced furrow localization and increase marginal enrichment in aura mutants (B). vasa RNA visualized as in Fig. 2A,B but using DAB (blue) visible substrate. Arrows show cleavage planes. |
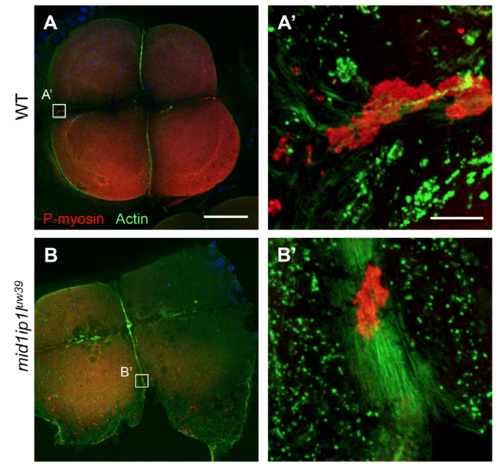
Maternal-effect germ plasm segregation defect in mutants for mid1ip1luw39. Localization of RNPs (using an anti-P-myosin antibody) and F-actin in wild-type (A, A’) and embryos from females homozygous for the mid1ip1luw39 alllele (B,B’). Scale: 100 μM A-D (bar in A), 10 μM A’,B’ (bar in A’). PHENOTYPE:
|
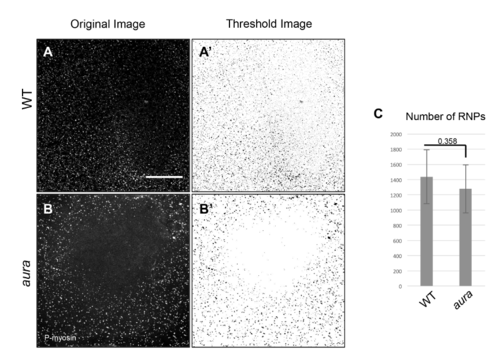
aura mutant embryos exhibit a similar initial number of cortical germ plasm RNPs. Wild-type and aura mutant embryos fixed at 12 mpf show a similar number of RNPs. (A.B) Labeling of RNP with anti-P-myosin. (A’,B’) Reversed grayscale for improved visualization. The RNP zone in the center of the blastodisc is likely the incipient zone of RNP clearing, which our observations suggest moves outward faster in aura mutants than in wildtype. (C) Quantification of the number of spots in image fields using automated particle counting (FIJI) shows no statistically significant difference between wild-type and mutant embryos (8 embryos each). Scale: 100 μM. |
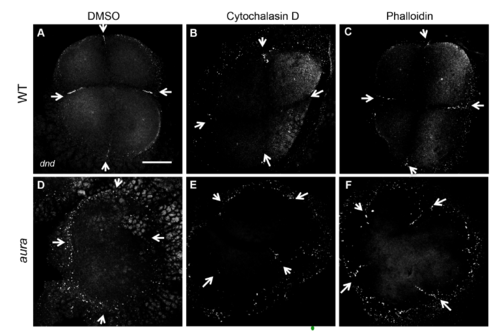
Effects of cytoskeletal inhibitors on germ plasm RNP furrow recruitment. Fluorescent in situ hybridization to visualize dnd RNA localization. Scale: 100 μM A-F (bar in A) |
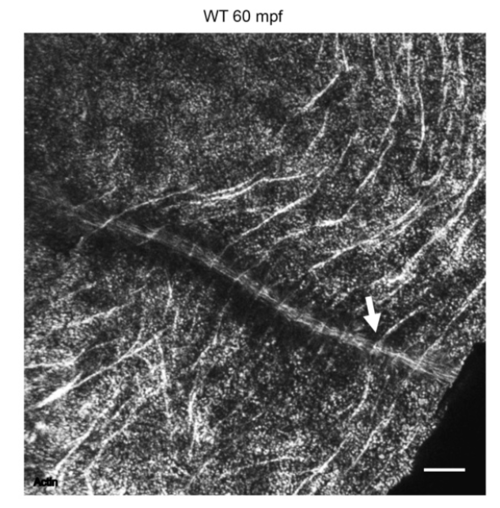
F-actin cortical trenches converge with F-actin furrow indentations. Overview of a wild-type embryo labeled for F-actin, showing that many circumferential F-actin arcs, which correspond to cortical trenches (Fig. 7A), connect to F-actin enrichments at the furrow (Fig. 7B), which correspond to furrow indentations. |
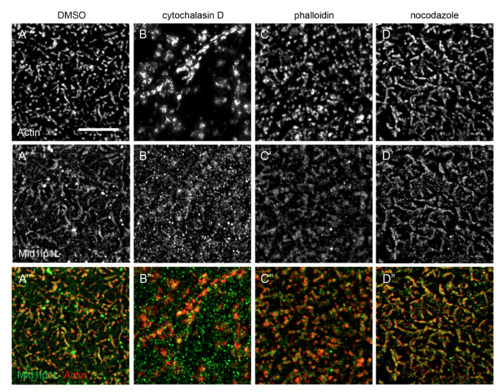
Mid1ip1L protein localization depends on F-actin, but not microtubules. SIM images showing localization of Mid1ip1l with respect to F-actin in the presence of cytoskeletal inhibitors. Both actin inhibition (B-B”) and stabilization (C-C”) lead to a reduction in colocalization. Colocalization appears unaffected by microtubule inhibition (D-D”). Scale: 5 μM A-H (bar in A). |