
- Title
-
Neural stem cell quiescence and stemness are molecularly distinct outputs of the Notch3 signaling cascade in the vertebrate adult brain
- Authors
- Than-Trong, E., Ortica-Gatti, S., Mella, S., Nepal, C., Alunni, A., Bally-Cuif, L.
- Source
- Full text @ Development
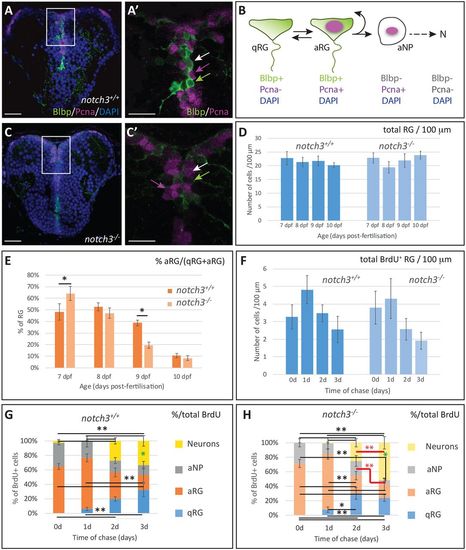
Notch3 controls radial glia quiescence and stemness. (A-B) Detection of the three progenitor cell types of the pallial VZ in a wild-type 7 dpf larva. (C) Progenitors of the pallial VZ in a 7 dpf notch3−/− larva. (A,C) Double immunocytochemistry for the RG marker BLBP (green) and the proliferation marker PCNA (magenta) on a telencephalic cross-section (counterstained with DAPI). (A′,C′) High magnification of the areas boxed in A,C. qRG, green arrow; aRG, white arrow; aNPs, magenta arrow. (B) Schematic representation of the main neurogenic cascade in the post-embryonic pallium, with diagnostic markers. At least some RGs transit between the qRG and aRG states (Chapouton et al., 2010). N, neurons. (D) Total number of RGs (qRGs+aRGs) counted per 100 µm of VZ on cross-sections at mid-pallial levels. There is no significant difference between stages and between genotypes within the period considered. (E) Proportion of aRGs within the total RG population between 7 dpf and 10 dpf compared in wild-type and notch3−/− sibling larvae. *P<0.05 after Holm's correction, otherwise non-significant. (F) Total number of BrdU-positive RGs (qRGs+aRGs) counted per 100 µm of VZ on cross-sections at mid-pallial levels between 7 dpf (t0, no chase) and 10 dpf (3 days of chase), compared in wild-type and notch3−/− sibling larvae. (G,H) Proportion of the different neural cell types (qRGs, aRGs, aNPs, neurons) within the BrdU-positive population following BrdU pulse application at 7 dpf (t0, no chase) and after 1, 2 or 3 days of chase (i.e. with analyses at 8, 9 and 10 dpf, respectively), compared in wild-type (G) and notch3−/− (H) sibling larvae. Black lines and asterisks: statistics with Holm's correction for multiple comparisons. *P<0.05, **P<0.01. Red lines and asterisks: LSD test for comparisons between 2 and 3 days of chase. The proportion of aNPs decreases significantly and the proportion of neurons increases significantly, in notch3−/− mutants only (P=0.007 and P=0.002, respectively). Green asterisks: LSD test for comparisons between wild-type and notch3−/− at 3 days of chase. The proportion of neurons is significantly increased in notch3−/− mutants versus wild type (P=0.02). Scale bars: 10 µm in A,C; 20 µm in A′,C′. (D-F) n=6-11 telencephali per condition. |
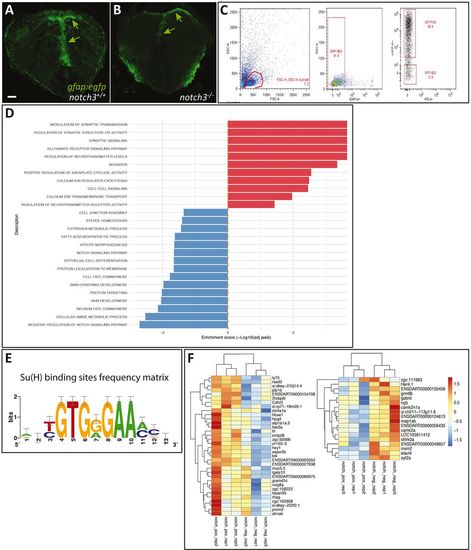
RNAseq identification of Notch3-dependent genes in 7 dpf radial glia. (A,B) Radial glia cells (RGs) (gfap:gfp, green, arrows) observed on cross-sections of the 7 dpf telencephalon in notch3+/+ and notch3−/− sibling larvae, used for FACS sorting. (C) Representative FACS dot plots showing the gating strategy. FSC/SSC plot and selected cells, which are then gated for DAPI negativity (middle panel) and for GFP expression (right panel). (D) List of significantly enriched GO terms (ordered by enrichment score) within the list of DEGs in 7 dpf RGs between notch3−/− and wild-type sibling larvae (red, enriched in mutants; blue, enriched in wild type) (see also Table S4). (E) Position-weight matrix for RBPJ/Su(H)-binding sites used in the present study (graphical representation). (F) Heat maps of the genes down- or upregulated in notch3−/− compared with notch3+/+ larvae and harbouring putative RBPJ-binding sites. Cutoff on display: log(fold change)>1. See also Tables S1 and S2. Scale bar: 20 µm. EXPRESSION / LABELING:
|
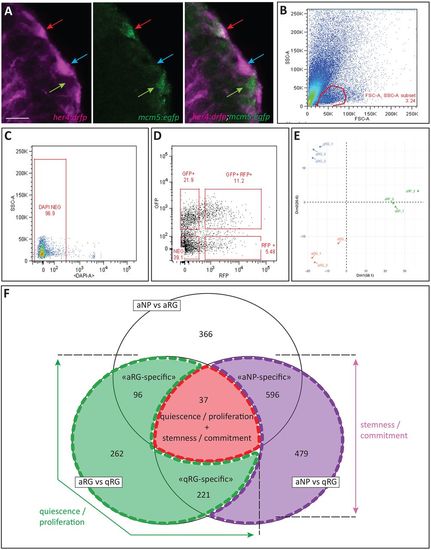
RNAseq identification of RG quiescence and stemness markers. (A) High-magnification view of a pallial VZ area in her4:drfp;mcm5:egfp double transgenic adult, highlighting the FACS-sorted progenitor types. Cross-section processed by immunocytochemistry for RFP (magenta) and GFP (green) (left panel, magenta channel; middle panel, green channel; right panel, merge). Coloured arrows indicate the different cell types (blue, qRGs; red, aRGs; green, aNPs) (as in E). Scale bar: 10 μm. (B-D) Representative FACS dot plots showing the gating strategy. FSC/SSC plot and selected cells (B,C), which are then gated on RFP and GFP intensities (D). (E) PCA analysis on the 500 showing the greatest variability across the different FACS-sorted biological replicates (blue, qRGs; red, aRGs; green, aNPs). (F) Venn diagram illustrating the position of recovered DEGs between the different cell state comparisons and their biological interpretation. EXPRESSION / LABELING:
|
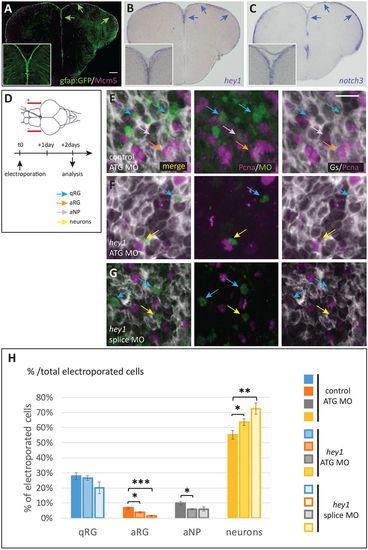
Hey1 activity maintains the proliferating progenitor state in the adult pallial germinal zone. (A) Cross-section of a gfap:gfp transgenic pallium at a mid-anteroposterior level, double immunostained for GFP (RGs) and Mcm5 (proliferating cells). Progenitor cells (qRGs, aRGs and aNPs) are confined to the ventricular zone (arrows, see high magnification inset). (B,C) Expression of hey1 and notch3 revealed by in situ hybridization on cross-sections of the adult pallium (same level as in A). Expression is confined to the VZ (arrows). (D) Experimental scheme to assess Hey1 function. hey1 (or control) fluorescein-labelled morpholinos (MO) are injected into the brain ventricle and electroporated. The fate of MO-inheriting cells (fluorescein-positive) is assessed 2 days post-electroporation. (E-G) Representative examples of triple immunostaining to reveal cell states in cross-sections of electroporated pallia [green, fluorescein; grey, glutamine synthase (RGs); magenta, Pcna (proliferating cells)]. Examples of cell types are indicated with colour-coded arrows, as defined in H. Scale bars: 50 μm in A-C; 10 μm in E-G. (H) Quantification of cell state/type changes following Hey1 blockade. The proportion of each cell state/type within the MO-inheriting population is plotted. The proportion of neurons is significantly increased upon Hey1 blockade, whereas the proportion of proliferating cell types (aRGs and aNPs) is significantly decreased. The proportion of qRGs is unchanged [hey1 ATG MO versus ATG control MO, P=0.59; hey1 splice MO versus ATG control MO, P=0.09 (after Holm's correction)]. Number of cells counted per brain: 196-796 for control MO, 137-413 for hey1 ATG MO and 49-493 for her1 splice MO. n=3-5 brains per condition. *P<0.05, **P<0.01, ***P<0.001. |
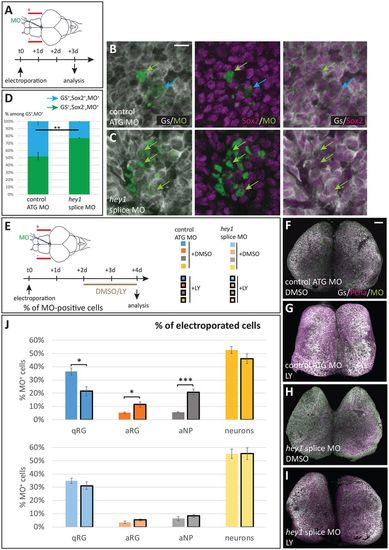
Hey1-depleted RGs lose stemness characters. (A-D) Effect of Hey1 abrogation on Sox2 expression in adult RGs. (A) Experimental scheme: fluorescein-tagged MOs (control MO or hey1 splice MO) are electroporated into the pallial VZ and Sox2 expression is analysed after 3 days. (B,C) Examples of electroporated VZ double-immunostained for Gs (white) and Sox2 (magenta), with MO-containing cells in green. Colour-coded arrows indicate the different cell types (see D). (D) Quantification of the proportion of Sox2-positive (blue) and -negative (green) RGs within MO-electroporated cells. (E-J) Effect of Hey1 abrogation on RG reactivation potential. (E) Experimental scheme: fluorescein-tagged MOs are electroporated into the pallial VZ and LY411575 (or the vehicle DMSO) is applied into the swimming water between 2 and 4 days post-electroporation. RG proliferation is analysed at 4 days. (F-I) Representative examples of whole-mount electroporated/LY-treated brains double immunoprocessed for Gs (white) and PCNA (magenta). (J) Quantification of the proportions of the different cell types (colour-code indicated in E). LY treatment induces RG activation (decrease in the proportion of qRGs, increase in the proportion of aRGs) upon electroporation of the control MO, but is without effect when Hey1 function is abrogated. Number of cells counted per brain: 99-293 for control MO treated with DMSO; 153-298 for splice MO treated with DMSO; 98-262 for control MO treated with LY; and 151-353 for splice MO treated with LY. n=3-5 brains per condition. *P<0.05, **P<0.01, ***P<0.001, all pairwise comparisons were adjusted for multiple comparisons following the Holm's procedure. Scale bars: 10 µm in B,C; 70 µm in F-I. |

ZFIN is incorporating published figure images and captions as part of an ongoing project. Figures from some publications have not yet been curated, or are not available for display because of copyright restrictions. |
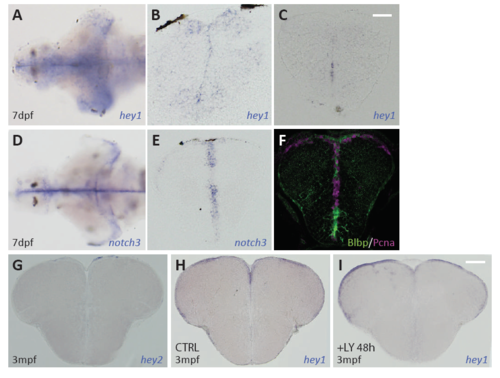
Expression of hey family genes and notch3 in the larval and adult pallium. A,B. Expression of hey1 revealed by in situ hybridization (ISH) on a whole-mount brain (A) and pallial cross-section (B) in a wildtype 7dpf larva. C. Expression of hey1 revealed by ISH in a pallial cross-section of a 7dpf notch3-/- larva. Note the strong decrease compared to the wildtype sibling (B). D,E. Expression of notch3 revealed by in situ hybridization (ISH) on a whole-mount brain (D) and pallial cross-section (E) in a wildtype 7dpf larva. F. Pallial cross-section at equivalent levels double immunostained for BLBP (green RG cells) and PCNA (magenta, proliferating cells). Note overall that expression of hey1 and notch3 are prominent at the VZ. G. Expression of hey2 revealed by ISH in an adult pallial cross-section. No expression was detected (compared with hey1 on panel H, identical to Fig.5B). H,I. Expression of hey1 revealed by ISH in adult pallial cross-sections from a wildtype (H) and LY-treated (I) animals. Note that hey1 expression is not noticeably affected by a 48-hour LY treatment Scale bars: A-F: 20μm, G-I: 50μm. |
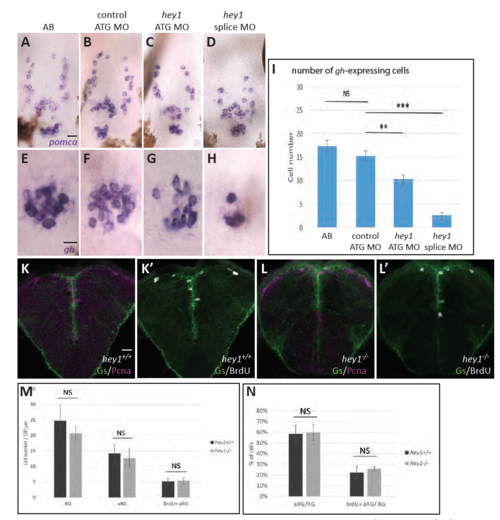
A-H. Validation of the efficiency and specificity of the hey1 morpholinos. Whole-mount in situ hybridization for the expression of pomca (A-D) and gh (E-H) in 72hpf larvae, wild-type (A,E) or injected at the one-cell stage with the MOs indicated (B-D, F-H). High magnification of the pituitary area. I. Quantification of the number of GH-positive neurons in embryos as in panels E-H. n=7 embryo for each condition. **: p=0.006; ***: p<0.0001. J-N. RG proliferation is unaffected in hey1-/- larvae. Cross-sections of the pallium in wildtype (K,K’) and hey1- /- (L,L’) 7dpf larvae, immunoprocessed for Gs and Pcna (K,L) or Gs and BrdU (K’,L’) following a short BrdU pulse, and corresponding quantification of the proportion of aRG (M) or BrdU-positive aRG (N) among the whole RG population. n=4 larvae and 250 RG cells counted for each genotype. There was no Cas3-positive cell among RG cells. Scale bars: A-D: 20μm, E-H: 10 μm, K-L’: 20 μm. |
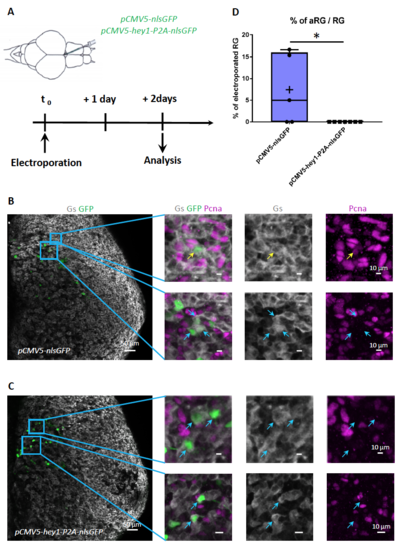
Overexpression of hey1 decreases proliferation in adult RG. Electroporation of pCMV5:nlsgfp (A,B) or pCMV5:hey1-P2A-nlsgfp (A,C) in the adult ventricular zone and quantification of the proportion of PCNA-positive RG among GFP-positive RG at 2 days postelectroporation (D). B,C: whole-mount hemispheres processed for triple immunocytochemistry (GS: gray, PCNA: magenta, GFP: green), with high magnifications of the boxed areas. n=5 brains for pCMV5:nlsgfp and n=7 brains for pCMV5:hey1-P2A-nlsgfp. 63 and 105 cells were counted respectively in each condition. p=0.033, Mann-Whitney test. |
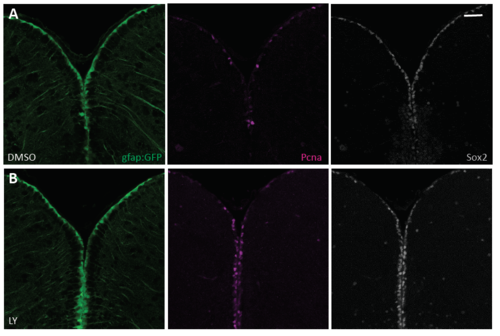
Notch blockade reactivates quiescent RG and does not affect their expression of Sox2. Cross sections of the adult pallium in gfap:gfp transgenic animals following 48 hours of DMSO (A) or LY411575 (B) treatment, triple immunostained for GFP (green), PCNA (magenta) and Sox2 (grey). Scale bars: 20μm. |