
- Title
-
Evolutionary emergence of the rac3b/rfng/sgca regulatory cluster refined mechanisms for hindbrain boundaries formation.
- Authors
- Letelier, J., Terriente, J., Belzunce, I., Voltes, A., Undurraga, C.A., Polvillo, R., Devos, L., Tena, J.J., Maeso, I., Retaux, S., Gomez-Skarmeta, J.L., Martínez-Morales, J.R., Pujades, C.
- Source
- Full text @ Proc. Natl. Acad. Sci. USA
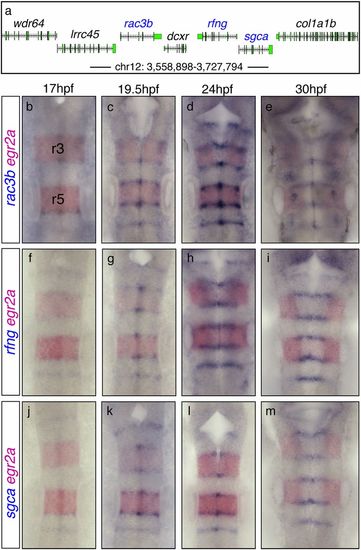
rac3b, rfng, and sgca are closely positioned within chromosome 12 and expressed in hindbrain boundary cells. (A) Gene organization within the indicated region of chromosome 12. (B–M) Spatiotemporal profile of rac3b, rfng, and sgca in the hindbrain: double in situ hybridizations for rac3b, rfng, or sgca (blue) and egr2a (red) as a landmark of rhombomeres 3 and 5 (r3, r5). Note that rac3b, rfng, and sgca are expressed at the hindbrain boundaries with a similar onset of expression. All images are dorsal views of flat-mounted hindbrains with anterior at the top. EXPRESSION / LABELING:
|
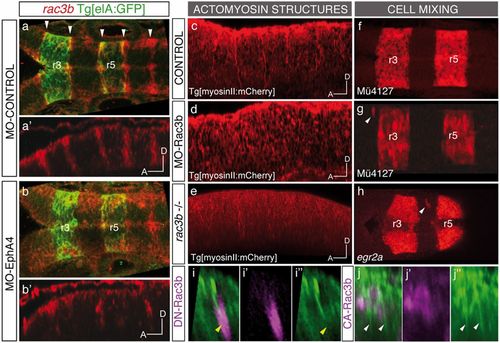
Expression and function of Rac3b in the hindbrain boundary cells. (A–B) Whole-mount in situ hybridization with rac3b in Tg[elA:GFP] embryos injected at the 1-cell stage with MO-Control (A and A′) or MO-EphA4 (B and B′), followed by anti-GFP staining. Note the expression of rac3b in boundary cells (white arrowheads) and how this expression diminishes upon EphA4 down-regulation. (A–B) Dorsal views and corresponding (A′–B′) sagittal views displaying only the red channel. (C–H) Loss of function of Rac3b, either by splicing blocking morpholino MO-Rac3b (D and G), or by CRISPR-Cas9 induced mutation (rac3b−/−) (E and H), results in the disruption of actomyosin cables (D and E) and cell mixing (G and H), compared with control embryos (C and F). White arrowheads in G and H point to ectopic r3/r5 rhombomeric cells. MO-Rac3b figures correspond to MO-Rac3bSBI4E5–injected Mü4127 embryos (Fig. S5C). Rhombomeric cell mixing in morphants was observed by expression of mCherry in r3 and r5 cells upon injecting the Mü4127 transgenic line. Cell mixing in rac3b−/− hindbrains was assessed by in situ hybridization with egr2a. (I–J) Sagittal views of representative examples of Tg[myosinII:GFP] embryos injected with the corresponding Rac3b construct, displaying either the merge (I–J) or the separate (I′–J′′) channels. (I–I′′) hs:DN-Rac3b-Myc clone (in magenta) hitting the rhombomeric boundary, with the subsequent disruption of the actomyosin cable; (J–J′′) hs:CA-Rac3b-Myc clone (in magenta) in rhombomere 5 generating ectopic actomyosin II structures. Yellow arrowheads in I–I′′ point to disrupted cables, and white arrowheads in J–J′′ indicate ectopic actomyosin structures. Anterior is to the left in all images. EXPRESSION / LABELING:
PHENOTYPE:
|
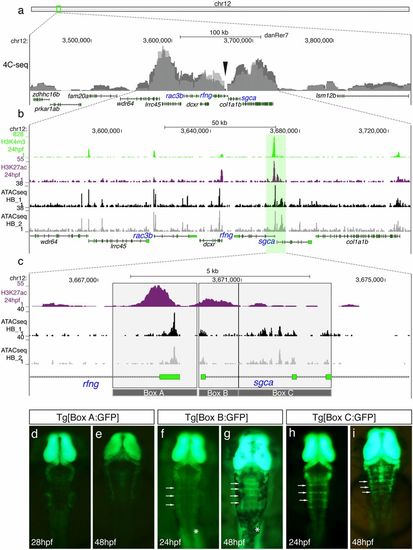
Identification of hindbrain boundary cell cis-regulatory elements by the analysis of the rac3b/rfng/sgca cluster regulatory landscape. (A) Chromosomal localization of the rac3b/rfng/sgca cluster and chromatin interaction profile by 4C-seq at 24 hpf (n = 2; overlaid gray peaks correspond to both replicates). The viewpoint used for both replicates is showed with a black arrowhead. (B) Enlarged view from A of a 170kb window of chromosome 12 where most of the chromatin interactions, unveiled by 4C-seq, occur. Epigenetic marks of putative promoters (H3K4me3; green peaks) and active enhancers (H3K27ac; magenta peaks) (40) are shown along with ATAC-seq profiles from dissected hindbrains at 24 hpf (n = 2; black and gray profiles). (C) Magnification of the region framed in B showing the H3K27ac profile and hindbrain-specific ATAC-seq signatures. The ∼5.6kb region (gray-shaded region) was divided in three fragments associated with hindbrain ATAC-seq peaks (Boxes A–C), which were cloned in an enhancer reporter vector to generate stable transgenic lines. (D–I) Dorsal views of embryonic hindbrains from Tg[Box A:GFP] (D and E), Tg[Box B:GFP] (F and G), and Tg[Box C:GFP] (H and I) stable transgenic lines at indicated stages. Note that Box B and Box C sequences (but not Box A) are able to drive GFP expression to the hindbrain boundaries (white arrows in F–I). White asterisks in F and G show the expression of GFP in the somites. In all images, the anterior is at the top. |
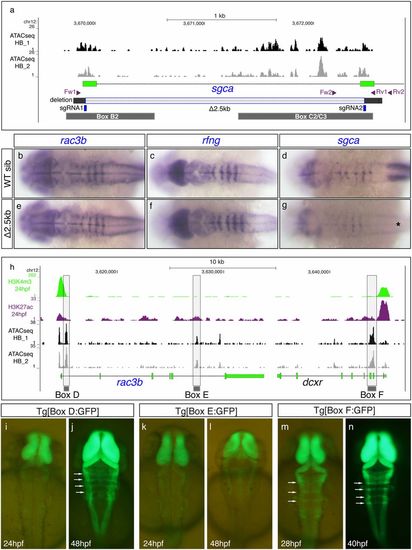
CRISPR-Cas9 deletion of hindbrain boundary cis-regulatory elements revealed the existence of redundant enhancers. (A) Scheme depicting the 2.5kb deletion induced by CRISPR-Cas9 technology (Δ2.5kb; gray-shadowed stretch) containing Box B2 and Box C2/3, along with ATAC-seq profiles from 24 hpf dissected hindbrains (black and gray profiles correspond to two different replicates). The position of the sgRNAs (in blue) used to generate the 2.5kb deletion and the two pairs of primers (in magenta) used for genotyping the mutant line are displayed. (B–G) In situ hybridization analyses of rac3b, rfng, and sgca in WT siblings (B–D) and CRISPR-Δ2.5kb homozygous mutant embryos (E–G) at 22 hpf. Note that rac3b and rfng expression does not considerably change within the hindbrain boundaries between WT and homozygous mutant embryos. sgca expression in the somites is abolished in mutant embryos (black asterisk in G), due to the deletion of the main sgca promoter. All images are dorsal views of flat-mounted hindbrains with anterior to the left. (H) Epigenetic profiles of putative promoters (H3K4me3; green peaks) and active enhancers (H3K27ac; magenta peaks) are shown within the chromosomal region containing rac3b and dcxr along with ATAC-seq signatures (black and gray profiles) from dissected hindbrains at 24 hpf. Three regions associated with the most prominent ATAC-seq peaks were selected (shadowed in gray, Boxes D–F) and each of the fragments was cloned in an enhancer reporter vector to generate a stable transgenic line. (I–N) Dorsal views of embryonic hindbrains from Box D (I and J), Box E (K and L), and Box F (M and N) stable transgenic lines at indicated stages. Note that Tg[Box D:GFP] embryos display GFP expression in the hindbrain boundaries starting at 48 hpf and that Box F is able to drive GFP expression to the hindbrain boundaries before 28 hpf (white arrows in J, M, and N). Box E did not drive GFP to the boundaries. In all images, anterior is at the top. Overall, the expression of the rac3b/rfng/sgca microsyntenic group at the hindbrain boundaries is regulated by multiple enhancers. We have identified at least two early-activated (Boxes C and F) and two late-activated regulatory elements (Boxes B and D). EXPRESSION / LABELING:
PHENOTYPE:
|
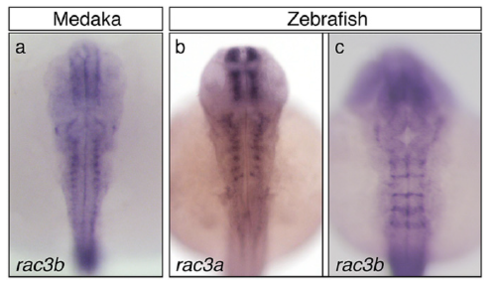
Comparison of the hindbrain expression profiles of rac3a and rac3b paralog genes from medaka and zebrafish. In situ hybridization of medaka (A; stage 24) and zebrafish (B; 40 hpf; C; 24 hpf) embryos for rac3a (B) and rac3b (A and C) genes. Note that rac3b in medaka is not expressed in hindbrain boundaries, and its expression is similar to rac3a in zebrafish. All images are dorsal views with anterior at the top. |
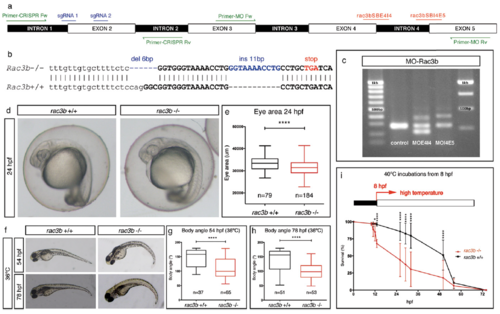
rac3b loss-of-function strategies. (A) Scheme depicting the structure of the zebrafish rac3b transcript showing the following: the position of the two different intron 4 splice-blocking morpholinos (in red) with the corresponding primers to assess the efficiency of the MOs (Primer-MO Fw/Rv; in green), the position of sgRNAs designed for CRISPR-Cas9 gene edition (sgRNA1/2; in blue), and the position of the screening primers (Primer-CRISPR Fw/Rv; in green). (B) Sequence showing mutations induced in rac3b by CRISPR-Cas9 genome edition (rac3b−/−). Generated indels (in blue) produce a premature stop codon (in red) that disrupts the reading frame. Intron 1 is shown in lowercase and exon 2 in uppercase. (C) Agarose gel showing the aberrant splicing products induced by morpholinos as detected by RT-PCR from embryos injected with MO-Control, MO-rac3bSBE4I4, or MO-rac3bSBI4E5. MO-rac3bSBE4I4 generated inclusion of intron 4 (+113) and skipping of exon 4 (−63); MO-rac3bSBI4E5 resulted in the retention of intron 4 (+113). Both MOs reduced the relative amount of WT transcript compared with the control. (D) WT (rac3b+/+) and CRISPR-rac3b homozygous mutant (rac3b−/−) embryos at 24 hpf. At this stage, mutants show a normal appearance with a diminished eye area quantified in E. (E) Box plot showing eye area at 24 hpf of rac3b+/+ and rac3b−/− embryos from three independent clutches (unpaired t test, ****P < 0.0001). (F) rac3b−/− embryos incubated at 36 °C (from 8 hpf onward) display curled body axis at 54 hpf (G) and 78 hpf (H), compared with rac3b+/+ embryos. (G and H) Box plot representation of body angle measurements of rac3b+/+ and rac3b−/− larvae at different stages: 54 hpf (unpaired t test, ****P < 0.0001) and 78 hpf (unpaired t test, ****P < 0.0001). (I) rac3b−/− embryos incubated at higher temperatures (40 °C) display increased lethality rate compared with rac3b+/+ (two-way ANOVA, *P < 0.05 and ****P < 0.0001). For rac3b+/+, n = 720 embryos from four independent clutches; for rac3b−/−, n = 1,080 embryos from six independent clutches. All of the experiments were performed using stable lines. PHENOTYPE:
|
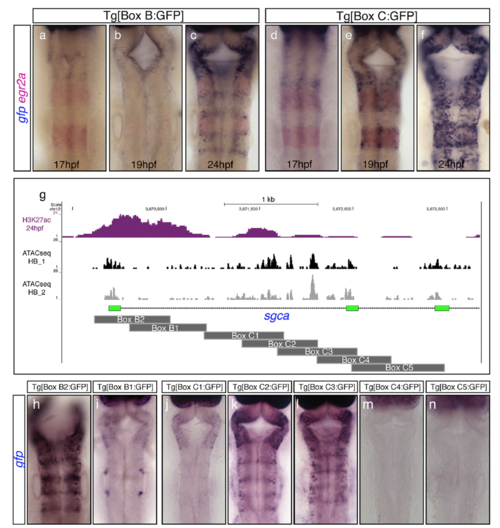
Onset of activity and dissection of the regulatory regions Box B and Box C. (A–F) Double in situ hybridization experiments for gfp (blue) and egr2a (red) in F2 transgenic embryos to reveal the onset of activity of Box B (A–C) and Box C (D–F). Note that the onset of activity of Box B is delayed compared with Box C, suggesting that initiation and maintenance of gene expression might be under the control of different enhancer elements. egr2a expression is used as a landmark for r3 and r5. (G) Active enhancers’ epigenetic profile (H3K27ac; magenta peaks) along with the ATAC-seq signature from dissected hindbrains at 24 hpf (black and gray peaks) are shown in the chromosomal region within the sgca gene that contains both Box B and Box C elements. Box B was dissected into two overlapping fragments (Box B1–B2), and Box C into five overlapping regions (Box C1–C5), as depicted by dark-gray rectangles. (H–N) Stable transgenic lines for each of the fragments displayed in G were generated, and embryos at 24 hpf were assayed for gfp in situ hybridization. Note that Box B2 and Box C2/C3 (but not Boxes B1, C1, C4, and C5) drive gfp expression to the hindbrain boundaries. All images are hindbrain dorsal views with anterior at the top. EXPRESSION / LABELING:
|
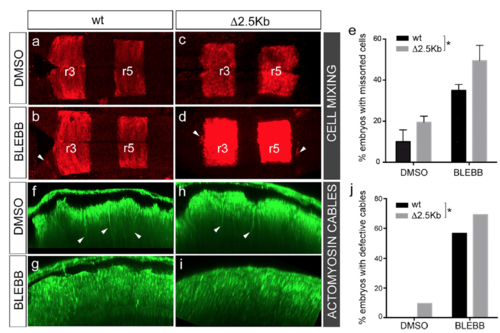
Functional role of redundant enhancers upon stress conditions. Embryos were placed under stress conditions by incubating them at 14 hpf with paranitroblebbistatin (BLEBB) to disrupt the actomyosin cables or DMSO as a control. Embryos were grown until 18–20 hpf, and the effect in the rhombomeric cell mixing and in the disruption of actomyosin cables was scored. (A–D) Rhombomeric cell-mixing phenotype assessed by in situ hybridization with egra2. Dorsal views of WT (wt; A and B) or CRISPR-Δ2.5kb homozygous embryos (C and D), treated with DMSO or BLEBB. Note that WT and CRISPR-Δ2.5kb homozygous embryos with compromised actomyosin cables (BLEBB) display ectopic rhombomeric cells as expected (see white arrowheads in B and D). (E) Bar plot showing the penetrance of the cell-sorting defects under the described conditions. Note that the percentage of CRISPR-Δ2.5kb embryos within the population displaying cell-sorting defects increases significantly compared with WT embryos (two-way ANOVA, *P < 0.05). These data correspond to an average of three independent experiments, in which ≥20 embryos per condition were employed. (F–I) Disruption of the actomyosin cables assessed by using homozygous embryos derived from Tg[CRISPR-Δ2.5kb;myosinII:GFP] heterozygous crosses. Sagittal views showing the actomyosin cable integrity in WT (F and G) or CRISPR- Δ2.5kb homozygous embryos (H and I), either treated with DMSO or BLEBB. (J) Bar plot showing the penetrance of the actomyosin cable defects under the described conditions. Note that the percentage of CRISPR-Δ2.5kb embryos within the population displaying defects in the actomyosin structures increases significantly compared with WT embryos. Statistical analysis was performed using a χ2 test (*P < 0.04). Note that para-nitroblebbistatin efficiency is ∼50% as previously described (16). |
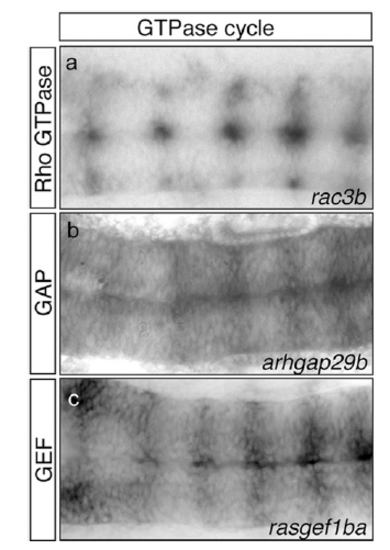
Expression pattern of different players of the GTPase cycle in the hindbrain boundaries. In situ hybridization for the small Rho GTPase rac3b (A) and its modulators, such as Rho GTPase activating protein (GAP) arhgap29b (B) and guanine nucleotide exchange factor (GEF) rasgef1ba (C) genes, in WT embryos at 20 hpf. Note the expression in hindbrain boundaries. All images are dorsal views of flat-mounted hindbrains with the anterior to the left. EXPRESSION / LABELING:
|