
- Title
-
TGF-ß Regulates Cathepsin Activation during Normal and Pathogenic Development
- Authors
- Flanagan-Steet, H., Christian, C., Lu, P.N., Aarnio-Peterson, M., Sanman, L., Archer-Hartmann, S., Azadi, P., Bogyo, M., Steet, R.A.
- Source
- Full text @ Cell Rep.
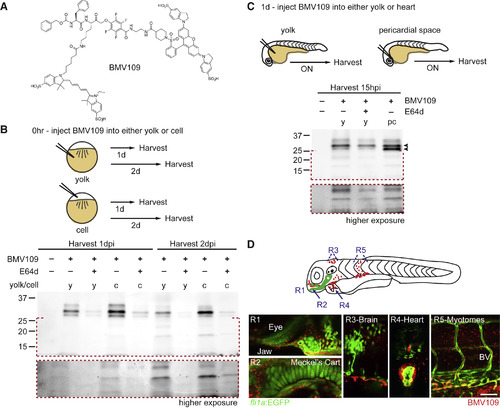
BMV109 Labels Cathepsin Proteases in Developing Zebrafish (A) BMV109 ABP structure. (B) Schematic of injection strategies. Shown are in-gel analyses of BMV109 reactivity. The bottom gel panels (outlined in red) are higher exposures of low-molecular-weight species; n = 4 experiments. For all gels, equivalence of protein loaded per lane was confirmed using the stain-free method (Experimental Procedures). (C) BMV109 was injected into the yolk or pericardial space of 1 dpf embryos and incubated overnight (15 hr); n = 4 experiments. (D) Live confocal analyses of 4 dpf fli1a:EGFP-positive embryos injected pericardially with BMV109 (red, imaging done 15 hr post injection [hpi]). The schematic shows 5 regions (R1–R5) spanning multiple embryonic tissues oriented head to tail. Meckel’s cartilage, lower jaw cartilage; BV, blood vessel. Scale bar, 10 μm. n = 30 embryos from 3 experiments. See also Figure S1. |
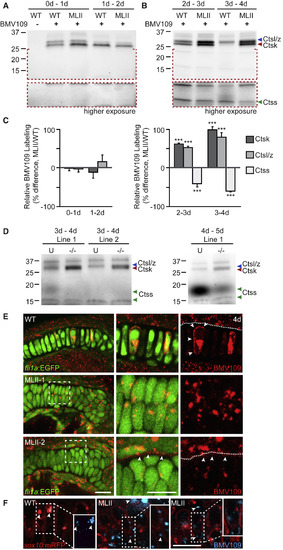
Cathepsin Activities Are Altered in MLII (A) In-gel analyses show Cts activities in WT and MLII embryos 0–1 and 1–2 dpf. n = 4 experiments. (B) Analyses of BMV109-labeled embryos 2–3 and 3–4 dpf. n = 4 experiments. (C) Quantitation of the Ctsk, Ctsl/z, and Ctss bands from 4 experiments. Error bars, SD; ∗∗∗p < 0.001. For all gels, the equivalence of total protein loaded per lane was evaluated using the stain-free method described in the Experimental Procedures. (D) BMV109 labeling of gnptab TALEN-mediated stable knockout embryos 3–4 dpf. U, unaffected (gnptab+/+ and gnptab+/− embryos); (−/−), gnptab−/− from two null zebrafish lines. n = 3 experiments. (E) Live confocal analyses of BMV109-labeled (red) fli1a:EGFP (green) WT and MLII embryos. White boxes indicate magnified views shown in the center (green and red) and at the right (red, BMV109). White arrows highlight pericellular puncta in WT and extracellular activity in MLII. Dotted lines demarcate cell boundaries. n = 15 embryos from 3 experiments. (F) Live confocal analyses of BMV109-labeled activity (blue) in sox10:mRFP (red, membrane-bound) transgenic embryos. In the WT, BMV109 reactivity (blue) co-localizes with RFP-positive cellular regions (see RFP-negative inset, white arrows) but can be found extracellularly (white arrows) in MLII embryos. The insets represent magnified views of the boxed areas. Scale bars, 10 μm. See also Figure S1. |
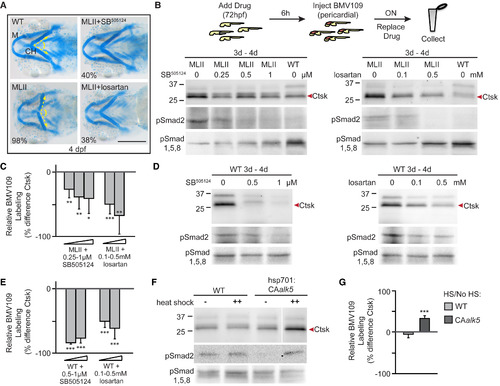
TGF-ß Inhibition Ameliorates MLII Pathology and Reduces Ctsk Activity (A) Alcian blue stains of 4 dpf WT, MLII, and TGF-ß-inhibited embryos. Shown are Meckel’s (M) cartilage and the angle of ceratohyal (CH) cartilages. The angle of cartilage articulation is illustrated by yellow dotted lines. Scale bar, 10 μm. Percent values are the number of embryos that resembled the picture (i.e., were rescued). n = 75–100 embryos from 3 experiments. (B) Schematic illustrating the treatment regimen. Shown are in-gel analyses of BMV109 reactivity (top), immunoblots of phosphorylated pSmad2 (TGF-ß effector, center), and phosphorylated pSmad1,5,8 (BMP effector, bottom). n = 4 experiments. (C) Quantitation of BMV109-labeled Ctsk in treated and untreated MLII embryos from 4 experiments. Error bars, SD; ∗p < 0.05, ∗∗p < 0.01, ∗∗∗p < 0.001. (D) In-gel analyses of BMV109-labeled (top) WT embryos, immunoblots of phosphorylated pSmad2 (TGF-ß effector, center), and phosphorylated pSmad1,5,8 (BMP effector, bottom). n = 4 experiments. (E) Quantitation of BMV109-labeled Ctsk in treated and untreated WT embryos from 4 experiments. (F) Gels of BMV109 labeling after TGF-ß induction (top) and immunoblots for psmad2 and pSmad1,5,8 (bottom). n = 5 experiments. (G) Quantitation of BMV109-labeled Ctsk before and after heat shock. Error bars, SD; ∗∗∗p < 0.001. See also Figure S2. EXPRESSION / LABELING:
PHENOTYPE:
|

ZFIN is incorporating published figure images and captions as part of an ongoing project. Figures from some publications have not yet been curated, or are not available for display because of copyright restrictions. |
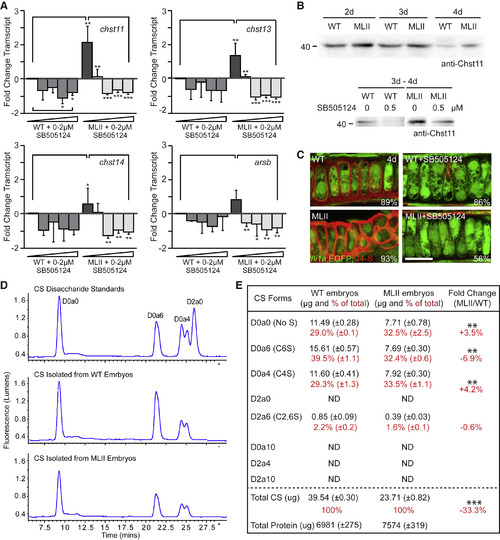
TGF-ß-Mediated Regulation of C4-S Controls Ctsk Activity (A) qRT-PCR of chondroitin-4-sulfate biosynthetic enzymes (chst11, 13, and 14) in TGF-ß-inhibited WT and MLII embryos 4 dpf. n = 4 experiments. Error bars, SD; ∗p < 0.05, ∗∗p < 0.01, ∗∗∗p < 0.001. (B) Western blots of Chst11 in WT and MLII embryos 2–4 dpf and in TGF-ß-inhibited embryos. n = 3 experiments. d, dpf. (C) Immunohistochemistry of C4-S (red) in fli1a:EGFP WT and MLII cartilage sections. n = 15–20 embryos per condition from 3 experiments. Percent values are the number of embryos that resemble the picture. Scale bar, 10 μm. (D and E) Traces of SAX HPLC for chondroitin sulfate forms in WT and MLII embryos (D). Table of SAX HPLC data (E). n = 3 technical replicates of 1 biological set with 1,200 embryos per sample. A second biological sample is presented in Figure S6. Error bars, SD; ∗∗p < 0.01, ∗∗∗p < 0.001. Standards for additional sulfo-forms, including C2,6S (D2a6), were also used. Because of their late elution time and low detection levels, these data were not included in the raw traces. See also Figure S5. |
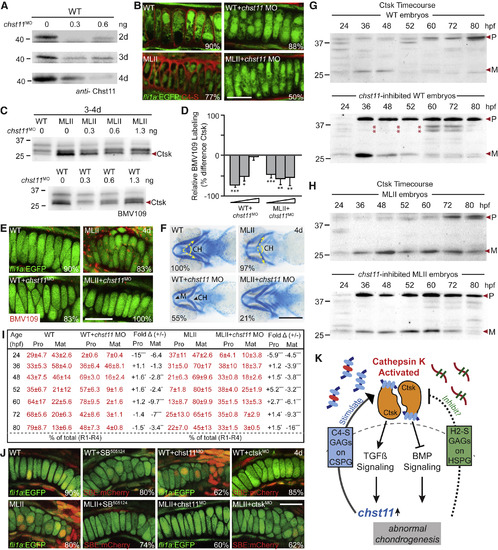
chst11 Inhibition Inhibits Ctsk Processing (A) Immunoblot of Chst11 in MO-inhibited WT embryos 2–4 d. MLII data and quantitation are shown in Figure S6. n = 3 experiments. d, dpf. (B) Immunohistochemistry for C4-S (red) in chst11 MO-inhibited embryos. n = 15–20 embryos per condition from 3 experiments. Percent values are the number of embryos that resemble the picture. Scale bar, 10 μm. (C) Gels of BMV109-labeled chst11-inhibited embryos. n = 4 experiments. (D) Quantitation of the Ctsk band. Error bars, SD; ∗p < 0.05, ∗∗p < 0.01, ∗∗∗p < 0.001. (E) Live confocal analyses of the BMV109 label (red) in chst11-inhibited EGFP-positive chondrocytes. n = 10–15 embryos per condition. Percent values are the number of embryos that resemble the picture. Scale bar, 10 μm. (F) Alcian blue-stained WT, MLII, and chst11-inhibited embryos. n = 100–150 embryos per sample from 3 experiments. Percent values are the number of embryos resembling the picture. Scale bar, 10 μm. (G and H) Immunoblot of Ctsk 24–80 hpf in chst11-inhibited WT (G) and MLII (H) embryos. n = 3 experiments. (I) Table listing the abundance (relative to all Ctsk) of the pro and mature form. (J) Live confocal analyses of cartilage-localized (green) TGF-ß signaling using the SBE:nucCherry reporter. n = 10–15 embryos per condition from 2–3 independent experiments. Percent values are the number of embryos resembling the picture. Scale bar, 10 μm. (K) Schematic of the current model suggesting that TGF-ß-mediated increases in C4-S promote increased activation of extracellular Ctsk in the lysosomal disease MLII. Although not currently known, it is also possible that reduced expression of inhibitory GAGs may contribute. See also Figures S5–S7. |
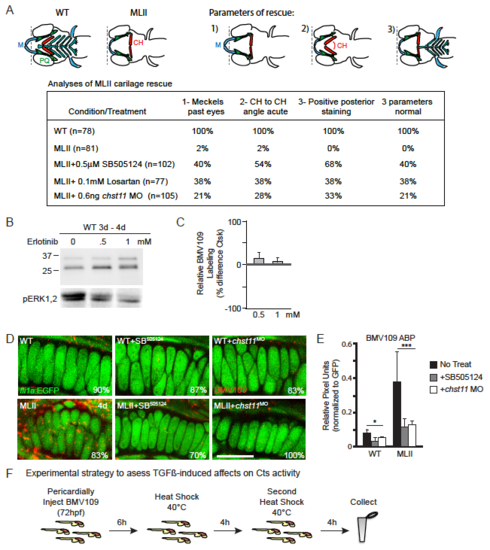
TGFß modulation impacts Ctsk activity and MLII phenotypes. A) Strategy for quantitating rescue in Alcian blue stained embryos. Schematic shows cartilage morphology in WT versus MLII embryos. M=Meckel’s cartilage, CH=ceratohyal. In MLII, the ceratohyals do not extend beyond the eye (dotted line), the angle between ceratohyal is typically close to 180°C, and the posterior structures (inlcuding the pectoral fin) do not stain. Rescue is assessed as the numberof embryos with parameters 1,2,3 all restored. The table details the percent of embryos with each individual parameter rescued, as well as the percent of embryos with all three parameters normal. B)Treatment with the EGFR-inhibitor erlotinib does not alter the degree of BMV109 labeled cathepsin activity. C) Quantitation of differences in the level of BMV109 labled Ctsk in drug treated versus untreated embryos from 4 independent experiments. Error=SD.* p<0.05, **p<0.01, ***p<0.001 D,E) Confocal analyses of BMV109-labeled activity (red) in EGFP marked chondrocytes shows Cts actvity is locally reduced after bothTGFß inhibition (SB505124) and chst11 knockdown. F) Experimental strategy for heat shock induction of TGFß signaling. |
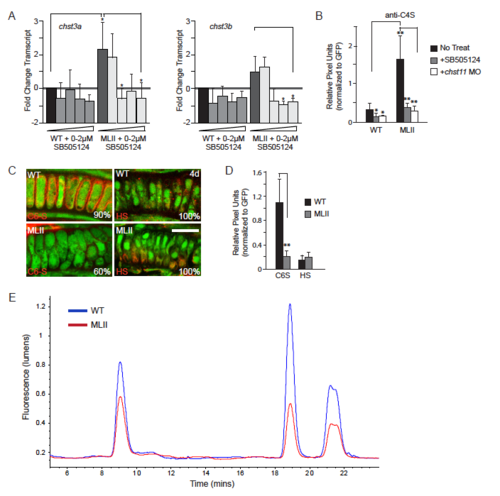
Increased C4-S stimulates Ctsk in MLII. A) qPCR anlyses of the C6-S sulfotrasferases (chst3a and chst3b) in WT and MLII embryos treated with increasing concentrations of SB505124. Data represent average difference between drug treated and untreated samples. n=3 independent experiments. Error = S.D. * = p < 0.05 B) Graph represents pixel intensity of C4S stain (normalized to GFP fluoresence) in sections of WT and MLII embryos under various conditions. Error = S.D. * = p < 0.05, ** = p<0.01 C) Confocal images of WT and MLII fli1a:EGFP sections stained immunohistochemically for either C6-S (6-O sulfated chondroitin sulfate) or HS (heparan sulfate proteoglycans)indicate that the abundance of C6-S GAGs is reduced in MLII chondrocytes, but HS abundance is unaffected. D) Graph of quantitation of pixel intensity of C6S and HS stains (normalized to GFP fluoresence) in sections of WT and MLII embryos under various conditions.Scale bar = 10μm. Error = S.D. ** = p < 0.01 C) Graph representing overlay of the WT and MLII SAX HPLC data described in Figure 6. |