
- Title
-
Epidermal regulation of bone morphogenesis through the development and regeneration of osteoblasts in the zebrafish scale
- Authors
- Iwasaki, M., Kuroda, J., Kawakami, K., Wada, H.
- Source
- Full text @ Dev. Biol.
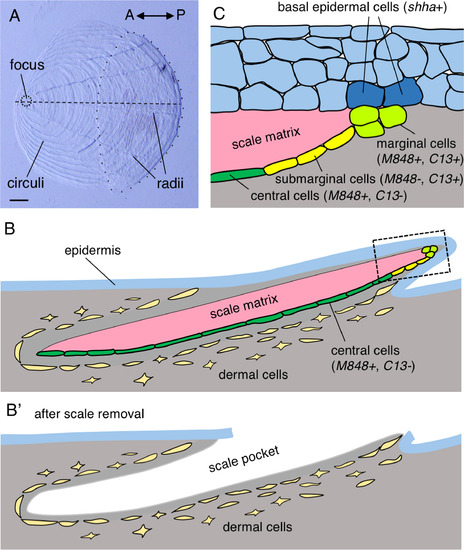
Anatomy of the zebrafish scale. (A) A scale surgically removed from the trunk of an adult zebrafish. The ornamental structures (focus and circuli) are located in the anterior region, whereas radii are located in the posterior region. The posterior part of a scale (i.e. the area enclosed by the dotted line) is covered by the epidermis. (B) Schematic drawing of a scale in cross-section along the horizontal line of a scale (dashed line in (A)). The inner surface of the scale matrix is associated with central osteoblasts (dark green) and submarginal osteoblasts (yellow). The scale edge is associated with marginal osteoblasts (light green). These osteoblasts tightly attach to the matrix, and remain attached to it when a scale is removed. (B′) Dermal cells remain in the body after scale removal and contain precursor cells for the regenerating scale. (C) Structure of the skin at the posterior edge of a scale, corresponding to the boxed area in (B). Three or four layers of epidermal cells overlie the scale edge, and the basal epidermal cells make direct contact with the marginal cells. See text for detailed gene expression patterns. Scale bar, 100 µm (A). |
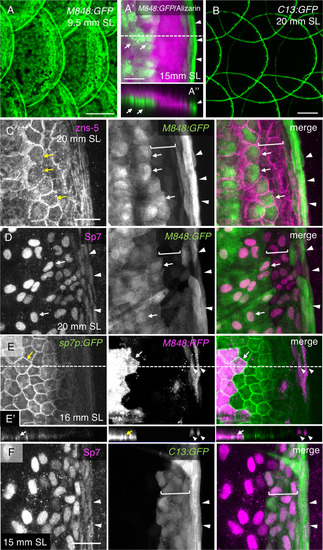
Three distinct populations of osteoblasts visualized using M848:GFP and C13:GFP. (A,B) Expression of green fluorescent protein (GFP) in scales of the gSAIzGFFM848A:gal4;UAS:GFP (M848:GFP) fish (A) and hspGFFDMC13F:gal4;UAS:GFP (C13:GFP) fish (B). (A′) Higher-magnification of the posterior regions of a scale from M848:GFP fish stained with Alizarin red. (A″) Optical cross section along the dashed line in (A′) at a thickness of 31.2 µm. M848:GFP is expressed in the cells located along the inner surface of the scale (arrows), and along the scale edge (arrowhead). (C,D) Posterior regions of scales of the M848:GFP fish labeled with antibodies against the osteoblast markers zns-5 (C) and Sp7 (D). Two different populations of osteoblasts are labeled with M848:GFP: central cells (arrows), and marginal cells (arrowheads). In addition, there are two or three rows of M848:GFP-negative submarginal cells between these two populations (brackets). Expression of Sp7 is weaker in marginal cells (arrowheads in (D)). (E) Scale of the triple-transgenic line M848:gal4;UAS:RFP;sp7p:GFP-caax, in which red fluorescent protein (RFP) is mosaically expressed. GFP is strongly expressed in central cells (arrows) compared with marginal cells (arrowheads). (E′) Optical cross-section along the dashed line in (E) at a thickness of 15.2 µm. M848:RFP labels central cells (arrow) and marginal cells (arrowheads). (F) Posterior regions of scales of the C13:GFP fish labeled with anti-Sp7 antibody. C13:GFP is expressed in marginal cells (arrowheads) and submarginal cells (brackets). See Fig. 1C for the schematic representation of the osteoblast subtypes. The standard length (SL) of each fish is indicated. Scale bars, 100 µm (A,B), 20 µm (A′, C–F). |
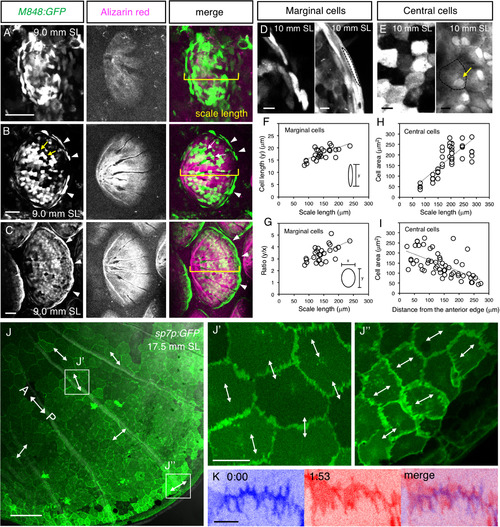
Development of central and marginal osteoblasts. (A–C) Scales of the M848:GFP fish were labeled with Alizarin red. GFP starts to be expressed in a loose condensation of irregularly shaped cells (A). Then, the central cells (arrows) and marginal cells (arrowheads) become apparent (B). Eventually, the central cells form a monolayer along the inner surface of the scale matrix, whereas the marginal cells become elongated along the scale edge (C). (D–I) Morphological changes in marginal (D,F,G) and central (E,H,I) cells during development. The cells are outlined by the dotted lines (D,E). The marginal cells become elongated as scales grow (D,F,G). The size of the central cells increases (E,H) and their nuclei become located at cell–cell boundaries (arrow in (E)). The central cells are larger in the anterior region of the scales (I; see also (J)). (J,K) Membrane dynamics of central cells in the sp7p:GFP-caax fish. The cell boundaries harbor parallel processes comprising zigzag lines (J). The transmitted light image is superimposed in (J) to visualize radii. The processes are aligned parallel to the anteroposterior (AP) axis (A↔ P) in the anterior region (J′, higher magnification) and perpendicular to the AP axis in the posterior region (J″); the orientations of processes are shown by the double-headed arrows. The processes are moving dynamically over time (K). Two images at different time points are superimposed (blue and magenta). See Supplemental Movie S1 for the time-lapse recording. The standard length (SL) of each fish is indicated. Scale bars, 50 µm (A–C), 10 µm (D,E), 100 µm (J), 20 µm (J′,J″), 5 µm (K). |
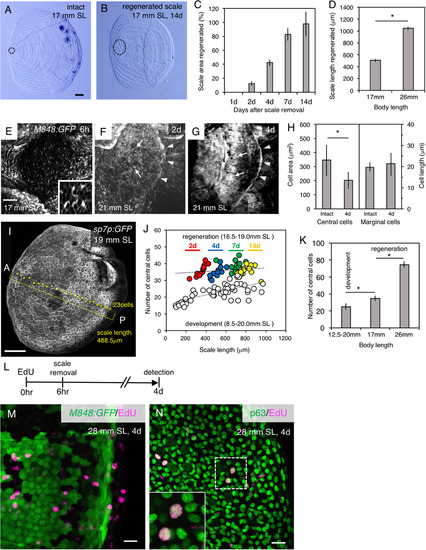
Different cell dynamics between the scale development and regeneration processes. (A,B) Comparison of an intact scale (A) with a regenerated scale 14 days after removal (B). The focus area is indicated by the dotted lines. (C) Recovery of the area of regenerated scales after scale removal. (D) Scale regeneration at 4 days after scale removal is faster in a larger than smaller fish. (E–G) Regeneration of scales in the M848:GFP fish 6 h (E), 2 days (F), and 4 days (G) after scale removal. Mesenchymal-like cells are observed after scale removal along the dermis (E; Inset, higher magnification). Central (arrows) and marginal (arrowheads) cells are distinguishable at 2 (F) and 4 days (G). (H) The central cells in regenerated scales are significantly smaller than in normal scales of a similar size (438–606 µm). In contrast, the size and shape of marginal cells are the same in developing and regenerating scales. (I) Counting of the number of sp7p:GFP-caax-expressing cells located along the horizontal line of a scale: in this image, 23 cells are observed (asterisks). (J) There are differences in the number of central cells between the development (open circle) and regeneration (solid circle; colors represent days after scale removal) processes. The number of central cells increases gradually during scale growth. (K) Correlation between the total number of central cells in a regenerated scale and body size. (L) Overview of the EdU incorporation experiment. EdU was injected 6 h before scale removal, and detected after 4 days. (M) EdU is not incorporated into the M848:GFP-expressing cells. (N) A significant proportion of proliferating cells along the regenerating scale are anti-p63-immunoreactive epidermal cells. Data are given as the mean± s.d. (C,D,H,K) *P < 0.05 (t-test). Scale bars, 100 µm (A,B,E–G, I), 20 µm (M,N). |
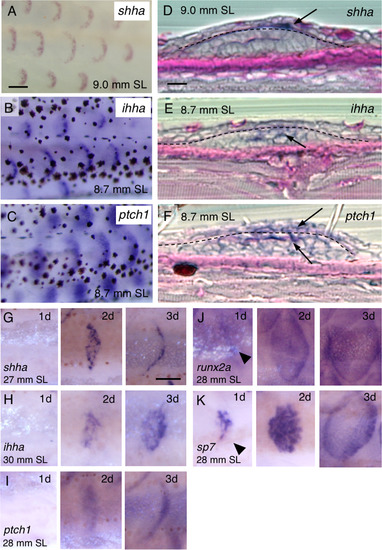
Expression of hedgehog (Hh) signaling genes during development and regeneration. (A–C) Expression of sonic hedgehog a (shha) (A), indian hedgehog homolog a (ihha) (B), and patched 1 (ptch1) (C) in repetitive crescent-shaped domains along the trunk of juvenile fish; each domain presumably corresponds to a scale. mitfa–/– fish (nacre, devoid of pigmentation) were used in (A). (D–F) Histological sections of juvenile fish labeled with shha (D), ihha (E), and ptch1 (F) together with periodic acid-Schiff (PAS) staining. shha is predominantly expressed in epidermal cells (arrow in D), whereas ihha is primarily detected in the dermis (arrow in E), and ptch1 is broadly expressed in both the epidermis and dermis (arrows in F). Dashed lines indicate the basement membranes. (G–K) Expression of Hh signaling genes and osteoblast marker genes during regeneration. Scales were removed from the trunk of adult fish and then stained with anti-sense RNA probes for shha (G), ihha (H), ptch1 (I), runx2a (J), and sp7 (K) on Days 1–3 after scale removal. Expression of Hh signaling genes starts within 2 days (G–I), whereas, runx2a and sp7 are already expressed after 1 day (arrowheads in J,K). Scale bars, 100 µm (A–C), 10 µm (D–F), 200 µm (G–K). |
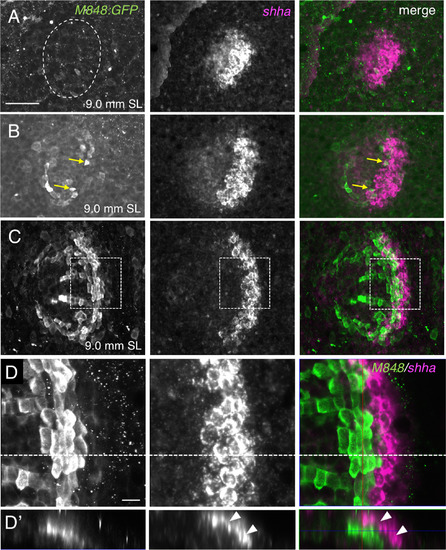
Expression of shha in the epidermal cells overlying marginal osteoblasts. (A–D) M848:GFP juvenile fish were double stained with anti-GFP antibody (green) and anti-sense shha RNA probe (magenta). A prospective scale area is indicated by the dotted line in (A). The expression domain of shha becomes restricted to the posterior part of the scale when M848:GFP is expressed (B,C). Arrows in (B) indicate GFP-expressing cells. (D) Higher magnification image of the area shown in (C). (D′) Optical cross-section along the dashed line in (D) at a thickness of 21.1 µm. shha is expressed in arrays of cells adjacently overlying the marginal cells (arrowheads). Scale bars, 50 µm (A–C), 10 µm (D). |
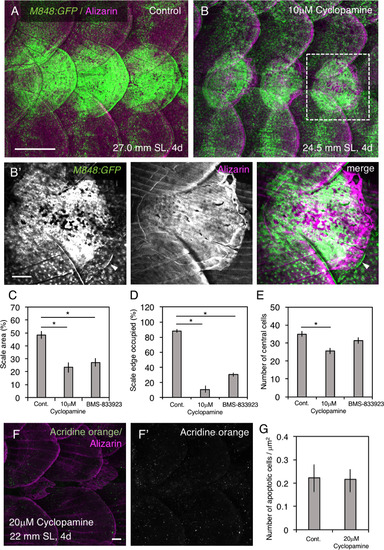
Effects of cyclopamine and BMS-833923 on scale regeneration. (A,B) Cyclopamine treatment during scale regeneration over the 1–4 days after scale removal severely affects scale morphology (B) compared with control (A). Three consecutive scales were removed. (B′) Higher magnification image of the area shown in (B). The regenerated scales exhibit ill-defined edges, accompanied by a loss of posterior grooves (radii) and marginal cells; a few unaffected marginal cells are indicated by the arrowhead. GFP is strongly expressed in the regenerated scale due to an increase in the number of central cells (see Fig. 4K). (C–E) Quantification of scale abnormalities in cyclopamine- and BMS-833923-treated fish indicates a marked reduction in scale area (C), a marked reduction in marginal cells (D), and a slight reduction in central cells (E). (F,G) Cyclopamine did not induce apoptotic cell death, as revealed by acridine orange staining. Data are the mean± s.d. *P < 0.05 (t-test). Scale bars, 500 µm (A,B), 100 µm (B′,F,F′). |
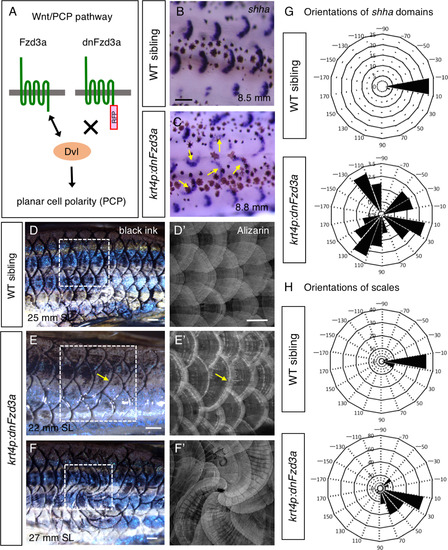
Wnt/planar cell polarity (PCP) signaling in the epidermis regulates the directional scale growth. (A) Schematic drawings for the Wnt/PCP pathway. The intercellular domain of Fzd3a interacts with Dvl to regulate PCP of epithelial tissues. To generate a dominant-negative form of fzd3a, the intracellular domain of fzd3a was replaced with RFP (dnFzd3a). (B,C) In krt4p:gal4;UAS:dnFzd3a (krt4p:dnFzd3a) fish, the crescent-shaped domain of shha is not aligned along the body axis (arrows in C) compared with its wild-type sibling (B). (D–F) The krt4p:dnFzd3a fish exhibit misorientation of scales, extending in the wrong direction with regard to the body axis. If the fish has only one aberrant scale, that scale extends slightly in a ventral direction (arrows in E) compared with scales in the wild-type sibling (D). In contrast, when several aberrant scales are associated with each other, these scales rotate together at larger angles with regard to the body axis, occasionally creating a “whorl” of scales (F). Black ink was used to visualize the scale pattern, followed by Alizarin red staining (D′–F′, the area shown in (D–F)). (G,H) Orientations of the aberrant shha expression domains (G) and aberrant scales (H) in krt4p:dnFzd3a fish are quantified in wind rose diagrams. Scale bars, 100 µm (B,C), 500 µm (D–F,D′–F′). |
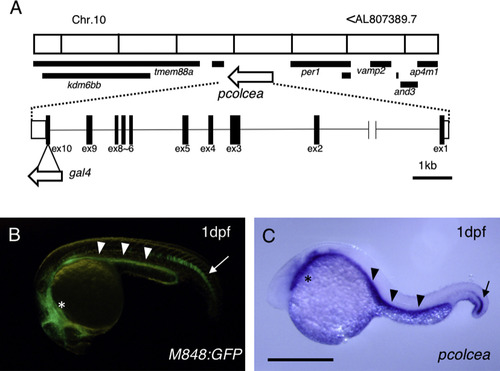
M848:gal4 is integrated into the locus of procollagen c-endopeptidase enhancer a (pcolcea). (A) The genomic integration site of gal4. This figure is adapted from the ensemble genome browser. Chr., chromosome; ex, exon. (B) M848:GFP embryo expressing GFP in the tip of the notochord (arrow), intestine (arrowheads), and pharyngeal region (asterisk). dpf, days post fertilization. (C) Expression of pcolcea in the same region as shown in (B). Scale bar, 500 µm. |
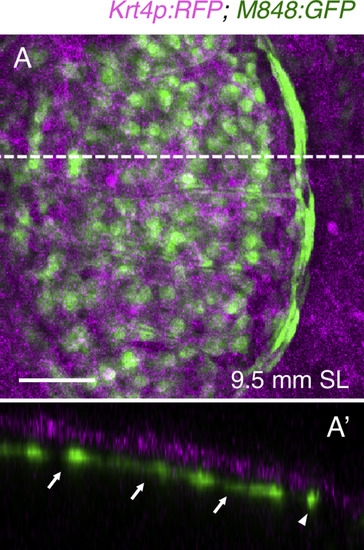
M848:GFP is expressed in the dermis. (A) Expression of GFP and RFP in juvenile krt4:RFP;M848:GFP fish, with the epidermis labeled by RFP. (A′) Optical cross-section (at a thickness of 76.2 µm) along the dashed line in (A). Both central cells (arrows) and marginal cells (arrowhead) are located in the dermis. Scale bar, 50 µm. |
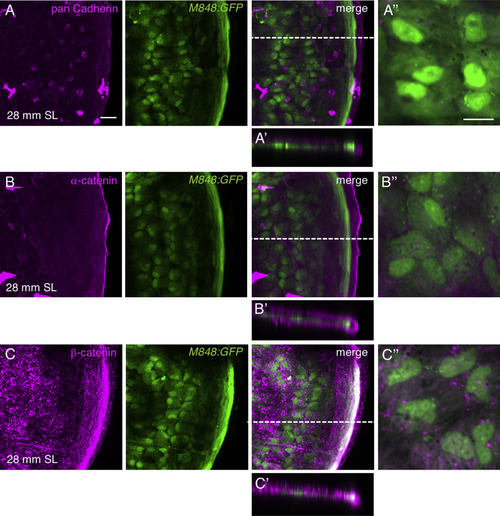
Epithelial markers are not expressed in the central osteoblasts. (A–C) Scales of M848:GFP fish were stained with antibodies against pan-cadherin (A), α-catenin (B), and β-catenin (C). None of these antibodies labeled the cell boundaries of the central osteoblasts. (A′–C′) Optical cross-sections at a thickness of 58.9 µm (A′), 55.4 µm (B′), and 65.8 µm (C′). (A″–C″) Higher magnifications for the central cells. Scale bars, 20 µm (A–C), 10 µm (A″–C″). |
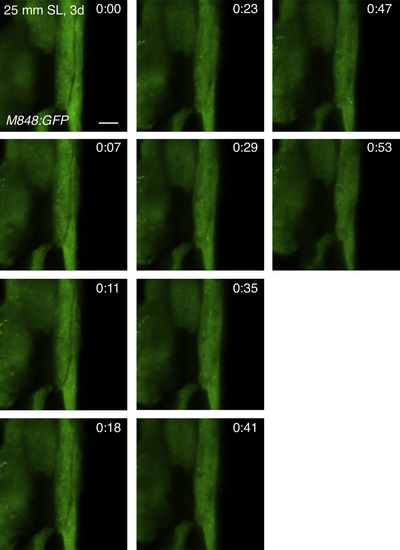
Marginal cells do not exhibit protrusive activities of cell membranes. A regenerating scale of M848:GFP fish (3 days after removal) was observed by confocal microscopy. Single optical planes are shown. Scale bar, 5 µm. |
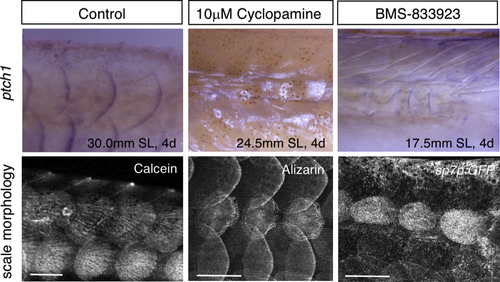
Effects of cyclopamine and BMS-833923 on Hh signaling during scale regeneration. Fish were treated with cyclopamine or BMS-833923 over a period of 1–4 days after scale removal, and the scales were analyzed on Day 4. Three consecutive scales were removed. Both treatments suppressed the expression of ptch1, the transcriptional target of Hh signaling. Lower panels indicate the corresponding regions visualized by calcium or osteoblast markers before staining with the ptch1 anti-sense RNA probe. Scale bars, 500 µm. |
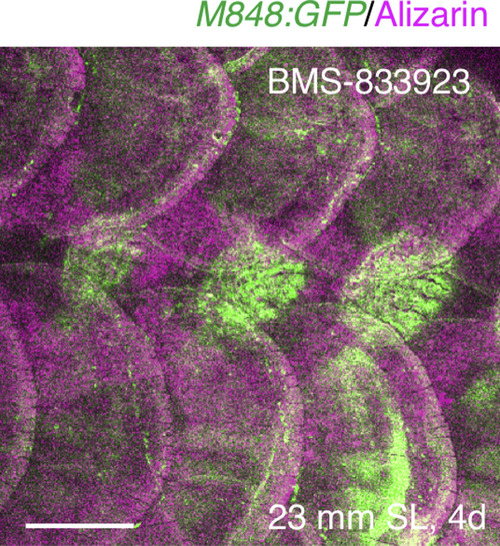
Effects of BMS-833923 on scale regeneration. BMS-833923 was injected in M848:GFP fish 1 day after scale removal, and the fish were stained with Alizarin red at 4 days. Three consecutive scales were removed. The regenerated scales are reduced in size (by 44.0%; see quantification in Fig. 7C), accompanied by a reduction in marginal cells (Fig. 7D). GFP is strongly expressed in the regenerated scale due to an increase in the number of central cells. Scale bar, 500 µm. |
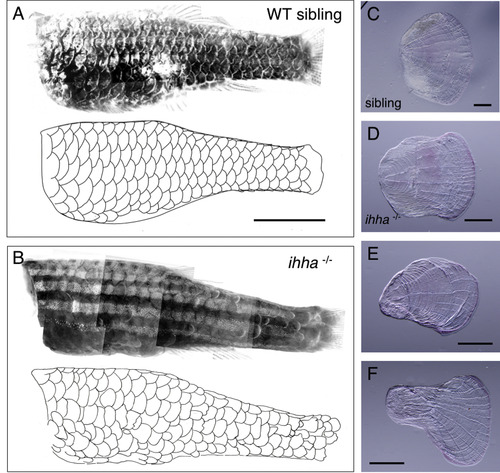
The scales of indian hedgehog homolog a mutant (ihha–/–) fish. (A,B) ihha–/– fish (B) and their wild-type sibling (A) stained with Alizarin red, with scale edges traced in the drawing below the photographs. (C–F) A normal scale (C) and three representative scales of ihha–/– fish (D–F) are shown. Although the scales exhibited irregular and variable shapes, the scale edges and the posterior structures of the radii are normal in ihha–/– fish. Scale bars, 5 mm (A,B); 500 µm (C–F). |
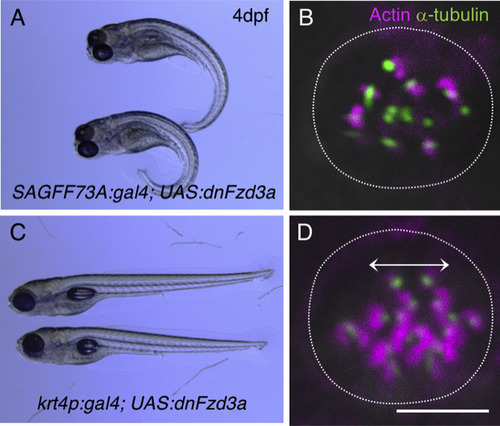
Effects of dnFzd3a on embryonic development. (A,B) When dnFzd3a is expressed ubiquitously using the SAGFF74A:gal4 line, convergent extension movements are affected (A) and the orientation of the lateral line hair cells becomes randomized (B) compared with normal hair cells, which are aligned horizontally along the AP axis of the body. (C,D) Ectopic expression of dnFzd3a in the epidermis using the krt4p:gal4 driver does not affect overall morphology (C) or lateral line hair cells (D), with the orientation of hair cells indicated by the double-headed arrow. Lateral line hair cells were labeled with anti-acetylated α-tubulin antibody and rhodamine–phalloidin. Scale bar, 5 µm. |
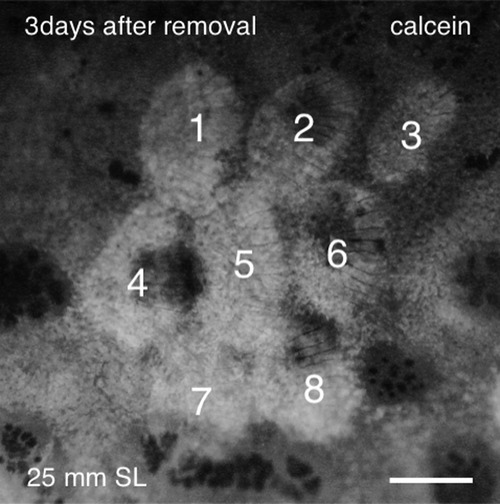
A group of neighboring scales regenerated normally after removal. Eight scales (indicated by numbers) were removed simultaneously and stained with calcein 3 days after scale removal. Scale no. 5 regenerated normally in the absence of six surrounding scales, suggesting that the neighboring scales are not necessary for scale regeneration. Scale bar, 500 µm. |
Reprinted from Developmental Biology, 437(2), Iwasaki, M., Kuroda, J., Kawakami, K., Wada, H., Epidermal regulation of bone morphogenesis through the development and regeneration of osteoblasts in the zebrafish scale, 105-119, Copyright (2018) with permission from Elsevier. Full text @ Dev. Biol.