FIGURE SUMMARY
Title

Aberrant tRNA processing causes an autoinflammatory syndrome responsive to TNF inhibitors

Authors
Giannelou, A., Wang, H., Zhou, Q., Park, Y.H., Abu-Asab, M.S., Ylaya, K., Stone, D.L., Sediva, A., Sleiman, R., Sramkova, L., Bhatla, D., Serti, E., Tsai, W.L., Yang, D., Bishop, K., Carrington, B., Pei, W., Deuitch, N., Brooks, S., Edwan, J.H., Joshi, S., Prader, S., Kaiser, D., Owen, W.C., Sonbul, A.A., Zhang, Y., Niemela, J.E., Burgess, S.M., Boehm, M., Rehermann, B., Chae, J., Quezado, M.M., Ombrello, A.K., Buckley, R.H., Grom, A.A., Remmers, E.F., Pachlopnik, J.M., Su, H.C., Gutierrez-Cruz, G., Hewitt, S.M., Sood, R., Risma, K., Calvo, K.R., Rosenzweig, S.D., Gadina, M., Hafner, M., Sun, H.W., Kastner, D.L., Aksentijevich, I.
Source
Full text @ Ann. Rheum. Dis.

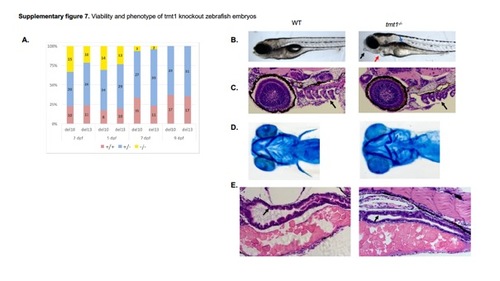
Viability and phenotype of trnt1 knockout zebrafish embryos
A. Survival of trnt1-/- fish. The histogram shows the percentage of live fish with homozygous WT, heterozygous, and homozygous null genotypes for both alleles [knockout mutant alleles del10 (Δ10) and del13 (Δ13)] at the indicated days post fertilization (dpf). Null fish die between 6 to 9 dpf and no null adults are recovered from heterozygous in-crosses. B-E. Defective morphological and histological phenotypes of trnt1-/- embryos at 5 dpf. WT embryos are shown in the left panel and mutant embryos are shown in the right panel. B. trnt1-/- embryos with abnormal jaw (black arrow), pericardial edema (red arrow) and uninflated swim bladder (blue arrow). C-D. Abnormal pharyngeal arches shown by histology analysis (C, black arrow) and cartilage staining (D) E. Abnormal intestinal development. Mutant embryos show lack of epithelial folds in the bulb of intestine. Black arrows mark the indicated structures. Both alleles had similar phenotypes, phenotype for del10 allele is shown here.

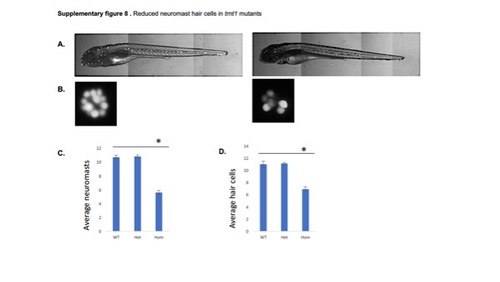
Reduced neuromast hair cells in trnt1 mutant embryos
A. Fluorescent images of WT (left) and mutant (right) embryos at 5 dpf stained with Yopro-1, showing the location of neuromasts. Both embryos are shown with their head to the left. B. Magnified images of hair cells in an individual neuromast in the WT and mutant embryos. C-D. Quantification of neuromast numbers (C) and hair cell numbers (D) in embryos from het in-crosses. Both graphs show the average and the standard error of the mean. The reduction in the number of neuromasts and hair cells is significant in the mutant (t-test, p <0.001). Both alleles had similar phenotypes, phenotype for del10 allele is shown here.

Acknowledgments
This image is the copyrighted work of the attributed author or publisher, and ZFIN has permission only to display this image to its users. Additional permissions should be obtained from the applicable author or publisher of the image. Full text @ Ann. Rheum. Dis.