
- Title
-
Myocardial Polyploidization Creates a Barrier to Heart Regeneration in Zebrafish
- Authors
- González-Rosa, J.M., Sharpe, M., Field, D., Soonpaa, M.H., Field, L.J., Burns, C.E., Burns, C.G.
- Source
- Full text @ Dev. Cell
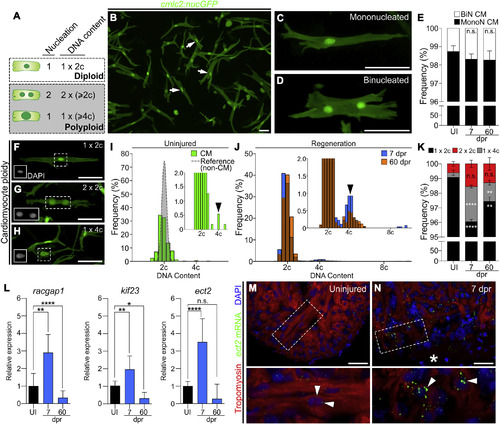
Zebrafish Cardiomyocytes Are Mononucleated, Diploid, and Upregulate Ect2 during Heart Regeneration (A) Schematic depicting cardiomyocyte nucleation and ploidy. See also Figure S1. (B) Cardiomyocytes (white arrows) from dissociated Tg(cmlc2:nucGFP) hearts. (C and D) Mononucleated and binucleated Tg(cmlc2:nucGFP) cardiomyocytes. (E) Average percentages of mononucleated (MonoN) and binucleated (BiN) cardiomyocytes in uninjured (UI), 7-dpr, and 60-dpr ventricles (mean ± SD, n = 9,309, 9,269, and 9,578 total cells, respectively, from 4 biological replicates per group; 2 pooled ventricles per replicate; n.s., not significant by one-way ANOVA test). (F–H) DAPI-stained mononucleated diploid, binucleated tetraploid, and mononucleated tetraploid cardiomyocytes isolated from Tg(cmlc2:nucGFP) hearts. Insets show DAPI signal. (I) Distributions of non-cardiomyocyte (gray) and cardiomyocyte (green) DNA content in homeostatic ventricles (n = 779 and 552 cells, respectively, from 3 biological replicates; 1 ventricle per replicate). Inset is magnification to show low-frequency events (black arrowhead indicates tetraploid cardiomyocytes). (J) Distributions of cardiomyocyte DNA content in 7-dpr and 60-dpr ventricles (blue and orange bars, respectively; overlap appears in brown). Inset is magnification to show low-frequency events (black arrowhead indicates tetraploid cardiomyocytes). (K) Quantification of indicated cardiomyocyte populations from UI, 7-dpr, and 60-dpr ventricles (mean ± SD, n = 3,250, 2,699, and 4,306 total cells from 7, 3, and 4 biological replicates per group, respectively; 3 ventricles per replicate; ∗∗∗∗p < 0.0001; ∗∗p < 0.01 by one-way ANOVA followed by Tukey's multiple comparisons test). (L) qPCR analysis showing relative expression of three genes involved in cytokinesis in UI, 7-dpr, and 60-dpr ventricles (mean ± SD, n = 3 technical replicates, 10 biological replicates, 1 ventricle per replicate, ∗∗∗∗p < 0.0001; ∗∗p < 0.01; ∗p < 0.05 by one-way ANOVA followed by Tukey's multiple comparisons test). See also Figure S2. (M and N) Single confocal sections of ect2 RNAScope (arrowheads) in UI and 7-dpr hearts. Boxed regions are shown at higher magnifications. n = 4 hearts per group with 3 sections per heart. Asterisk indicates wound edge. CM, cardiomyocytes. Scale bars, 50 μm. |
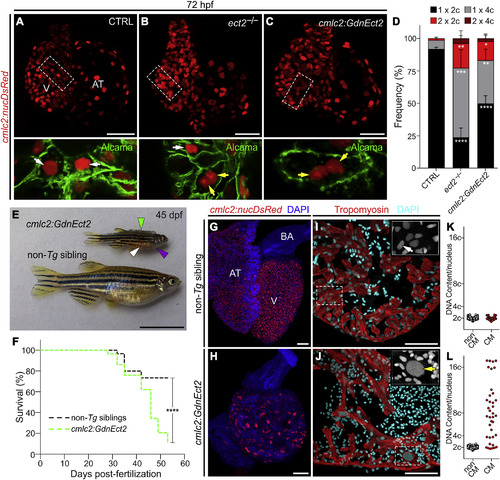
Loss of Ect2 Function Causes Polyploidization of Zebrafish Cardiomyocytes (A–C) Confocal projections of 72-hpf embryonic hearts from control (CTRL), ect2−/−, and Tg(cmlc2:GdnEct2) animals carrying the Tg(cmlc2:nucDsRed) transgene. Single confocal planes of boxed regions are shown at higher magnification with Alcama immunostaining to highlight plasma membranes. White and yellow arrows indicate diploid and polyploid cardiomyocytes, respectively. See also Figures S3 and S4A–S4F. (D) Quantification of indicated cardiomyocyte populations in the indicated cohorts at 72 hpf (mean ± SD, n = 4, 4, and 4 embryos for ect2+/+, ect2−/−, non-Tg, and Tg(cmlc2:dnEct2), respectively. ∗∗∗∗p < 0.0001; ∗∗∗p < 0.001; ∗∗p < 0.01; ∗p < 0.05 by one-way ANOVA followed by Tukey's multiple comparisons test). (E) 45-dpf (e19.5 mm SSL) Tg(cmlc2:GdnEct2) and non-Tg sibling animals with arrowheads highlighting scale bristling (green), blood pooling (white), and pericardial edema (purple) in Tg(cmlc2:dnEct2) zebrafish. 68 of 77 Tg(cmlc2:GdnEct2) and none of 88 non-Tg siblings developed these phenotypes. (F) Representative Kaplan-Meier plot for Tg(cmlc2:GdnEct2) and non-Tg clutchmates from one of three independent experiments. 77 total Tg(cmlc2:GdnEct2) animals and 88 total siblings were followed. ∗∗∗∗p < 0.0001, log-rank test. (G and H) Confocal projections of DAPI-stained whole hearts from 30-dpf non-Tg or Tg(cmlc2:GdnEct2) animals carrying the Tg(cmlc2:nucDsRed) reporter. 19 of 25 transgenic animals showed this phenotype with 6 of 25 showing an intermediate phenotype. (I and J) Ventricular sections from 30-dpf non-Tg or Tg(cmlc2:GdnEct2) animals immunostained to detect tropomyosin and counterstained with DAPI. Boxed regions show DAPI staining at higher magnification. White and yellow arrows indicate diploid and polyploid cardiomyocytes, respectively. (K and L) Nuclear DNA content distributions of non-cardiomyocyte and cardiomyocyte populations from indicated cohorts. Representative data are shown from one of four replicates, one heart per replicate. See also Figures S4G–S4I. AT, atrium; BA, bulbus arteriosus; V, ventricle; Scale bars, 25 μm (A–C, G, and H), 10 mm (E), and 100 μm (I and J). EXPRESSION / LABELING:
PHENOTYPE:
|
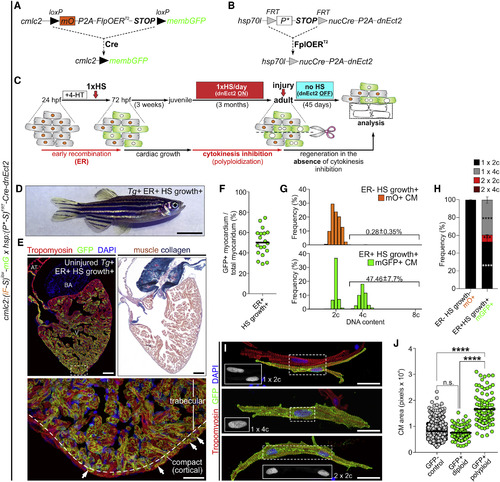
Experimental Strategy to Generate Mosaic Hearts Containing Permanently Labeled Polyploid Cardiomyocytes through Transient Cytokinesis Inhibition (A–C) Transgenes and experimental strategy used to create adult zebrafish with mosaic hearts composed of diploid (GFP−) and polyploid-enriched (GFP+) cardiomyocyte populations. Detailed description of the experimental strategy is provided in Figure S5. (D) External appearance of a double-transgenic adult zebrafish with a mosaic heart composed of GFP− diploid and GFP+ polyploid-enriched cardiomyocytes. (E) Adjacent sections from an adult mosaic heart immunostained for tropomyosin and GFP (left) or stained with acid fuchsin orange G (AFOG) (right). Boxed area shows apex region at higher magnification. White arrows indicate GFP+ cardiomyocytes located in the cortical myocardium. (F) Quantification of the percentage of GFP+ myocardium relative to the total ventricular myocardium from mosaic adult hearts (n = 19). (G) DNA content of GFP− (mO+) and GFP+ cardiomyocytes from mosaic hearts. (H) Quantification of indicated cardiomyocyte populations from (F) (mean ± SD, n = 620 and 520 total cells from 4 to 3 biological replicates per group, respectively; 3 ventricles per replicate; ∗∗∗∗p < 0.0001; ∗∗∗p < 0.001 by one-way ANOVA followed by Tukey's multiple comparisons test). (I) Dissociated cardiomyocytes from a mosaic heart immunostained for tropomyosin and GFP. Boxed regions show DAPI staining. Shown are diploid (top), mononucleated tetraploid (middle), and binucleated tetraploid (bottom) cardiomyocytes. (J) Quantification of cardiomyocyte size from the indicated classes from ventricular dissociations (n = 822, 84, and 97 cardiomyocytes; ∗∗∗∗p < 0.0001; Kruskal-Wallis test followed by Dunn's multiple comparisons test). CM, cardiomyocyte; ER, early recombination; HS, heat-shocked. Scale bars, 5 mm (D), 100 μm (E), and 25 μm (I). |
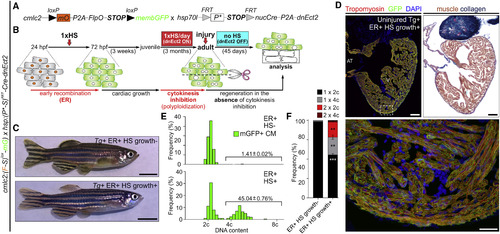
Experimental Strategy to Generate Hearts Highly Enriched in Permanently Labeled Polyploid Cardiomyocytes through Transient Cytokinesis Inhibition (A and B) Transgenes and experimental strategy employed to maximize the percentage of cardiomyocytes susceptible to polyploidization. (C) External appearance of double-transgenic adult zebrafish, subjected to early recombination during embryogenesis, grown in the absence (top) or presence (bottom) of polyploid-inducing heat-shock treatments. (D) Adjacent sections from a fully recombined adult heart immunostained for tropomyosin and GFP (left) or stained with AFOG (right). Boxed area shows apex region at higher magnification. (E) DNA content of GFP+ cardiomyocytes from the indicated cohorts. (F) Quantification of indicated cardiomyocyte populations from l (mean ± SD, n = 564 and 406 total cardiomyocytes from 4 to 4 pooled ventricles, respectively; ∗∗∗p < 0.001; ∗∗p < 0.01, by one-way ANOVA followed by Tukey's multiple comparisons test). CM, cardiomyocyte; ER, early recombination; HS, heat-shocked. Scale bars, 5 mm (C) and 100 μm (D). See also Figure S6. |
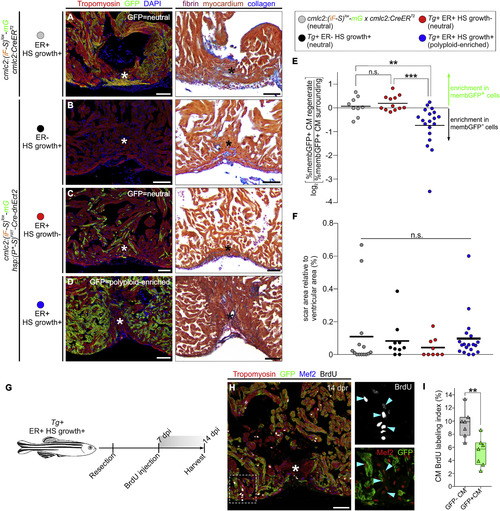
Myocardial Polyploidization Creates a Barrier to Cardiomyocyte Proliferation and Heart Regeneration (A–D) Adjacent sections from 45-dpr hearts from the indicated cohorts, immunostained for Tropomyosin and GFP (left) or stained with AFOG (right). n = 14 (12), 10 (9), 9 (9), and 19 (18) hearts (number of hearts that showed complete regeneration is indicated in parentheses), respectively. Asterisks indicate injured/regenerated area. (E) Relative change in percentage of GFP+ cardiomyocytes in the regenerate compared with the surrounding region in hearts from the indicated cohorts (n = 12, 9, and 19, respectively). ∗∗∗p < 0.001; ∗∗p < 0.01; Kruskal-Wallis test followed by Dunn's multiple comparisons test. (F) Quantification of the scar area of hearts from (A) to (D) normalized to the ventricular area (n = 14, 10, and 19 hearts; solid black line indicates the mean); n.s., not significant by Kruskal-Wallis test. (G) BrdU pulse-chase strategy used to evaluate cardiomyocyte proliferation during regeneration in experiments from (G) and (H). (H) Section from a 14-dpr mosaic heart composed of diploid (GFP−) and polyploid-enriched (GFP+) cardiomyocyte populations, immunostained for tropomyosin, GFP, Mef2, and BrdU. BrdU and Mef2/GFP signals of boxed region are shown at higher magnifications. Blue arrowheads indicate BrdU+ cardiomyocyte nuclei. Asterisks indicate injured/regenerated area. (I) Cardiomyocyte BrdU labeling indices of GFP− and GFP+ populations in injury sites in experiments from (F) and (G). Box-and-whisker plot. n = 7 hearts. ∗∗p < 0.01, Mann–Whitney test. CM, cardiomyocyte; ER, early recombination; HS, heat-shocked. Scale bars, 50 μm. See also Figure S6. |
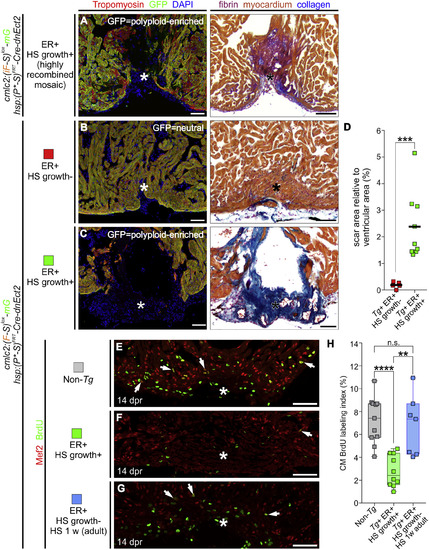
Increasing the Proportion of Polyploid Cardiomyocytes Impairs Heart Regeneration (A–C) Adjacent sections from 45-dpr hearts from the indicated cohorts, immunostained for tropomyosin and GFP (left) or stained with AFOG (right). n = 2 (0), 5 (5), and 9 (0) hearts (number of hearts that showed complete regeneration indicated in parentheses), respectively. Asterisks indicate injured/regenerated area. (D) Quantification of the scar area of hearts from (B) and (C) normalized to the ventricular area (n = 5 and 9 hearts; solid black line indicates the mean); ∗∗∗p < 0.001, two-tailed unpaired t test. (E–G) Sections from 14-dpr hearts of the indicated cohorts, immunostained for Mef2 and BrdU, as described in Figures 5G and 5H. White arrows indicate BrdU+ cardiomyocyte nuclei. Asterisks indicate injured/regenerated area. (H) Cardiomyocyte BrdU labeling index in injury sites in experiments from (E) to (G). Box-and-whisker plot. n = 11, 10, and 7 ventricles, respectively. ∗∗∗∗p<0.0001; ∗∗p<0.01 by one-way ANOVA followed by Tukey's multiple comparisons test. CM, cardiomyocyte; ER, early recombination; HS, heat-shocked. Scale bars, 50 μm. See also Figures S7 and S8. |
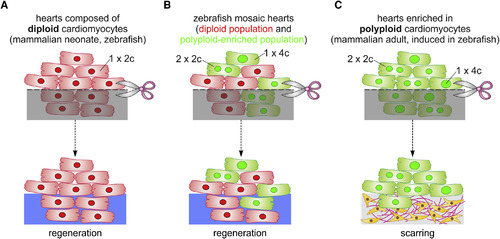
Model of Cardiomyocyte Polyploidization as a Barrier to Heart Regeneration (A) Hearts composed almost exclusively of diploid cardiomyocytes (1×2c), such as those in the adult zebrafish and mouse neonate, regenerate efficiently after amputation through myocardial proliferation. (B) In mosaic hearts composed of diploid (GFP−) and polyploid-enriched (GFP+) cardiomyocyte populations, diploid cardiomyocytes proliferate actively to replace injured muscle, with minor contributions from the polyploid-enriched population. (C) Minimizing the proportion of diploid cardiomyocytes in the zebrafish heart, a situation similar to that in adult mammals, including humans, results in reduced cardiomyocyte proliferation and persistent scarring. Dashed line, plane of amputation; dark area, amputated tissue; blue boxes, regenerated myocardium; red and green cells, diploid and polyploid-enriched cardiomyocyte populations. |
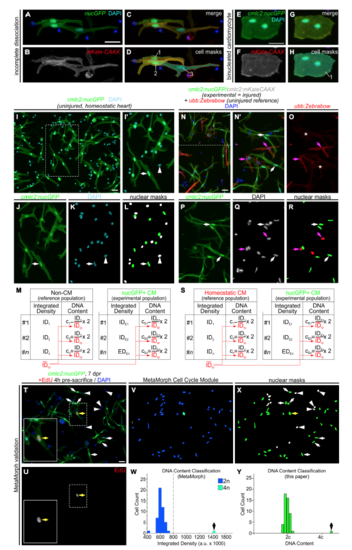
Quantitative strategies to measure cardiomyocyte nucleation and relative DNA content, Related to Figure 1 and STAR Methods. (A-H) Double transgenic reporters allow myocardial cell aggregates to be distinguished from binucleated cardiomyocytes.Fluorescent images of cardiomyocytes dissociated from double transgenic Tg(cmlc2:nucGFP; cmlc2:mKate-CAAX) hearts. Myocardial cell aggregates (A-D) can be clearly distinguished from binucleated cardiomyocytes (E-H). (A,E) Fluorescent images showing overlapping nuclear GFP and DAPI signals. (B,F) Flourescent images showing membrane localized mKate signal. (C,G) Merged images of (A,B) and (E,F), respectively. (D,H) Pseudocolored masks based on mKate-CAAX signal highlight cell contours revealing the presence of either three mononucleated cardiomyocytes (D) or a binucleated primordial cardiomyocyte (H). (I-M) Strategy used to quantify DNA content in cardiomyocytes from homeostatic hearts using non-myocardial cells as the diploid reference population. (I) Representative image of cells from dissociated Tg(cmlc2:nucGFP) ventricles (as shown in Figure 1B), showing GFP and DAPI signals. (I’) Magnification of boxed area in (I). Cardiomyocytes are GFP+ rod-shaped cells with bright nuclei (white arrow). Non-myocardial cells (i.e. fibroblasts, epicardial and endocardial cells) are GFP- (white arrowhead). (J,K) Individual fluorescent channels showing GFP and DAPI signals. (L) Nuclear masks were generated based on DAPI signal. Cardiomyocyte and non-cardiomyocyte nuclear masks appear in green and white, respectively. (M) For each nucleus, the integrated density (ID) of the DAPI signal was obtained. The average ID value of noncardiomyocytes (reference population, IDrp, red) was determined for every picture. This value represents the average DNA content of the diploid population (2c). Then, the ID value of each cell from both populations was divided by the IDrp and multiplied by 2. The resulting value represents the DNA content of a given cell relative to the reference population. See STAR Methods section for further details. (N-S) Strategy used to quantify DNA content in cardiomyocytes from regenerating hearts using homeostatic cardiomyocytes as the reference diploid population. Double transgenic Tg(cmlc2:nucGFP; cmlc2:mKate-CAAX) animals were subjected to apical resection. Because polyploidization of non-myocardial cells from amputated hearts cannot be ruled out, injured ventricles were dissociated in combination with uninjured ventricles from Tg(ubb:Zebrabow) animals, that express mCherry in all cells. mCherry+ ubb:Zebrabow cardiomyocytes were used as the reference diploid population. (N) Representative image of cells from dissociated injured Tg(cmlc2:nucGFP; cmlc2:mKate-CAAX) and uninjured Tg(ubb:Zebrabow) ventricles, showing mCherry, GFP and DAPI signals. (N’) Magnification of boxed area in (N). Cardiomyocytes from regenerating hearts are nucGFP+ (white arrows) and cardiomyocytes from homeostatic hearts are mCherry+ (pink arrows). (OQ) Individual fluorescent channels showing mCherry, GFP, and DAPI signals. Asterisks in (O) indicate faint signal from mKate-CAAX in regenerating cardiomyocytes. (R) Nuclear masks were generated based on DAPI signal. Regenerating cardiomyocyte and homeostatic cardiomyocyte nuclear masks appear in green and red, respectively. (S) For each nucleus, the ID of the DAPI signal was obtained. The average ID value of the mCherry+ reference population (IDrp, red) was determined for every picture. This value represents the average DNA content of the diploid population (2c). Then, the ID value of each cell was divided by the IDrp and multiplied by 2. The resulting value represents the DNA content of a given cell relative to the reference diploid population. (T-Y) Validation of our quantification strategy using the MetaMorph Cell Cycle Module. (T) Representative image of dissociated cells from Tg(cmlc2:nucGFP) ventricles at 7 days post-resection. Animals were injected with 10 μM EdU 4 hours before dissociation to label proliferating cells. (U) Individual fluorescent channels showing EdU signal. Boxed areas are shown at higher magnification. Yellow arrow indicates an EdU+ cardiomyocyte nucleus. (V-W) Ploidy measurement of image shown in (T) using MetaMorph software. (V) Color-coded masks automatically generated by the MetaMorph Cell Cycle Module based on DAPI integrated density. (W) DNA content histogram generated by MetaMorph. The software identified a cell with double the DNA content compared to the rest of the population (black arrow). (X,Y) Ploidy measurement of image shown in (T) using the quantification strategy described above. (X) Nuclear masks generated manually based on DAPI signal. Cardiomyocyte and non-cardiomyocyte nuclear masks appear in green and white, respectively. (Y) DNA content histogram generated by the quantification strategy described above. This method identified a cell with double the DNA content compared to the rest of the population (black arrow). Scale bars: 50 μm. |
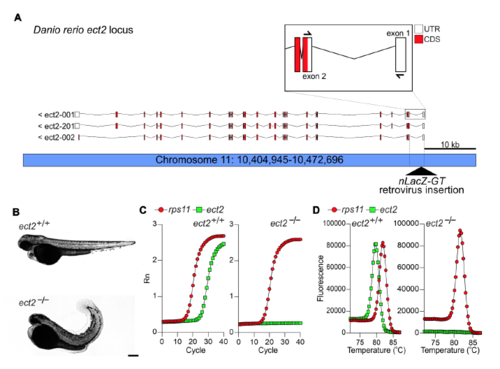
The retroviral insertion hi3820aTg results in disrupted splicing of ect2 mRNA, Related to Figure 2. (A) Schematic representation of the Danio rerio ect2 genomic locus and transcript variants. The hi3820aTg (nLacZ-GT) retroviral integration site is located in the first intron. The retroviral sequence includes splice acceptor sequence and the nLacZ cDNA. Boxed area shows at higher magnification the first three exons and the location of real-time PCR primers used to detect correct splicing of ect2 mRNA. (B) Bright-field images of control (ect2+/+) and ect2hi3820aTg/ hi3820aTg (ect2-/-) embryos at 72 hpf. Mutant embryos exhibit smaller heads and curly tails. (C,D) Real-time PCR amplification (C) and dissociation (D) curves of rps11 (housekeeping control) and ect2 in ect2+/+ and ect2-/- embryos, revealing splicing disruption in ect2 mutant embryos. Scale bar: 200 μm. |
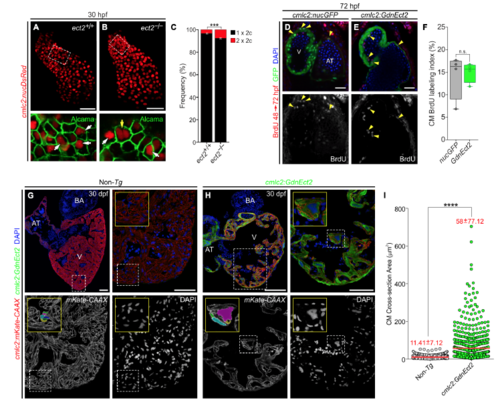
Ect2 is required for cardiomyocyte cytokinesis, but dispensable for entry into S-phase, and constitutive myocardial dnEct2 expression induces cardiomyocyte hypertrophy, Related to Figure 2. (A,B) Confocal projections of embryonic hearts of ect2+/+ (A) and ect2-/- (B) animals carrying the Tg(cmlc2:nucDsRed) transgene at 30 hpf. Single confocal planes of boxed regions are shown at higher magnification with Alcama immunostaining to highlight plasma membranes. White and yellow arrows point to diploid and polyploid cardiomyocytes, respectively. (C) Quantification of indicated cardiomyocyte populations from ect2+/+ (n=4) and ect2-/- (n=4) hearts at 30 hpf (mean±s.d; ** P<0.01 by two-tailed unpaired t-test). (D,E) Single confocal planes of 72 hpf Tg(cmlc2:nucGFP) (D) and Tg(cmlc2:GdnEct2) (E) animals exposed to BrdU between 48 and 72 hpf, immunostained for GFP and BrdU and counterstained with DAPI. Yellow arrowheads indicate BrdU+ cardiomyocyte nuclei. The BrdU signals from (D) and (E) are shown below. (F) Quantification of the Tg(cmlc2:nucGFP) (n=4) and Tg(cmlc2:GdnEct2) (n=4) cardiomyocyte BrdU labeling index at 72 hpf (mean ± s.d, non-significant by two-tailed unpaired t-test). (G,H) Ventricular sections from 30 dpf non-Tg (G) or Tg(cmlc2:GdnEct2) animals (H) carrying the Tg(cmlc2:mKate-CAAX) transgene to label cardiomyocyte cell membranes. Hearts were immunostained to detect mKate and GFP and counterstained with DAPI. Boxed regions are shown at higher magnifications (right and insets). Individual fluorescent channels showing mKate and DAPI signals (bottom) as indicated. Pseudocolored cells depicting the cross-sectional area of individual cardiomyocytes. (I) Quantification of cardiomyocyte cross-sectional area in non-Tg (n=1996 total cardiomyocytes from 3 animals) and cmlc2:GdnEct2 (n=688 total cardiomyocytes from 5 animals). Mean values and standard deviations are shown in red. ****, P<1·10-15, Mann-Whitney test. Scale bars: 25 μm (A-B, D-E) 100 μm (G-H), 50 μm (magnifications from G and H). |
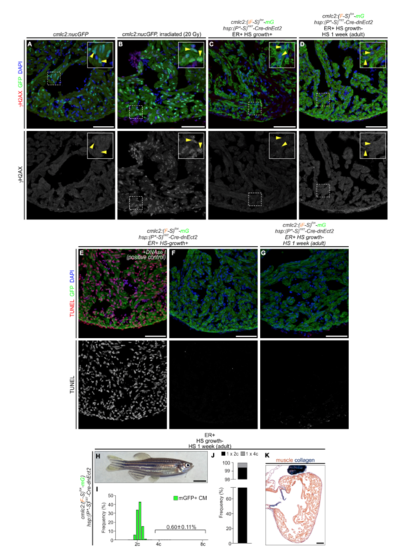
Myocardial dnEct2 expression does not induce DNA damage or apoptosis, and exposure to dnEct2 during adulthood does not induce cardiomyocyte polyploidization, Related to Figure 3 and Figure 4. (A-D) Sections from hearts from the indicated cohorts, immunostained for γH2AX (to detect DNA damage), GFP and counterstained with DAPI. γH2AX signals are shown in bottom panels. Boxed regions are shown at higher magnifications (insets). Irradiated animals (B) serve as a positive control for the DNA damage response. Yellow arrowheads in insets indicate cardiomyocyte nuclei. (E-G) TUNEL staining in sections from hearts from the indicated cohorts, immunostained for GFP and counterstained with DAPI. TUNEL signal is shown in bottom panels. Section in (E) was incubated in DNAse I as a positive control for apoptosis. (H) External appearance of double-transgenic adult zebrafish, subjected to early recombination during embryogenesis, grown in the absence of polyploid-inducing heat-shock treatments and exposed to one week of daily heat-shock treatments during adulthood. (I,J) DNA content (I) and quantification of indicated cardiomyocyte populations (J) from (H). n=2839 total cardiomyocytes from 3 replicates, 3 ventricles per replicate. Scale bars: 50 μm (A-G, K), 5 mm (H). |
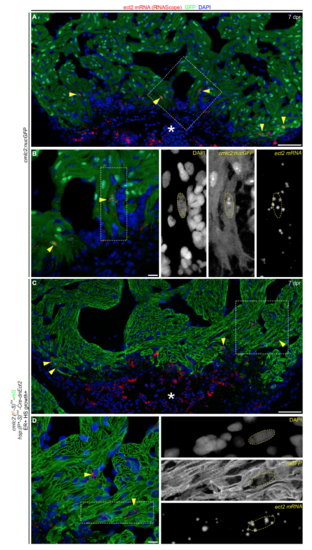
Ect2 is re-expressed after injury in polyploid-enriched hearts, related to Figure 5 and Figure 6. (A,C) RNAScope in situ hybridization showing ect2 transcripts (yellow arrowheads) in a section from the indicated cohorts at 7 dpr, immunostained for GFP and counterstained with DAPI. Asterisk indicates the wound area. (B,D) Magnified regions from (A) and (D). Boxed region is shown to the right with individual fluorescent signals for DAPI, GFP and ect2 mRNA. n=4 hearts per group with 3 sections per heart. Scale bars: 50 μm (A,C), 10 μm (B,D). |
Reprinted from Developmental Cell, 44, González-Rosa, J.M., Sharpe, M., Field, D., Soonpaa, M.H., Field, L.J., Burns, C.E., Burns, C.G., Myocardial Polyploidization Creates a Barrier to Heart Regeneration in Zebrafish, 433-446.e7, Copyright (2018) with permission from Elsevier. Full text @ Dev. Cell