
- Title
-
Microbiota promote secretory cell determination in the intestinal epithelium by modulating host Notch signaling
- Authors
- Troll, J.V., Hamilton, M.K., Abel, M.L., Ganz, J., Bates, J.M., Stephens, W.Z., Melancon, E., van der Vaart, M., Meijer, A.H., Distel, M., Eisen, J.S., Guillemin, K.
- Source
- Full text @ Development
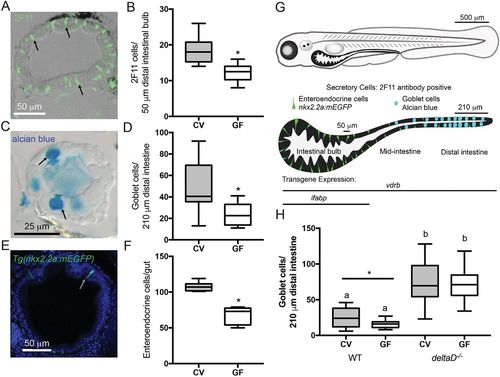
The microbiota promotes intestinal epithelium secretory cell fates through the Notch ligand DeltaD. (A) Representative image of cross-section stained with 2F11 antibody (e.g. black arrows). (B) Number of 2F11-positive secretory cells in CV and GF larvae; n=16. (C) Representative image of mucus-containing vacuole of goblet cells stained with Alcian Blue (black arrows). (D) Counts of Alcian Blue-positive goblet cells in CV and GF larvae; n=18 (CV), 14 (GF). (E) Representative cross-section of Tg(nkx2.2a:mEGFP) larva expressing GFP in (EECs (white arrow). (F) Number of GFP-positive EECs in GF and CV Tg(nkx2.2a:mEGFP) larvae; n=6 (CV), 9 (GF). (G) Schematic of larval zebrafish and larvae intestine. Enteroendocrine and goblet secretory cells are indicated in their normal intestinal locations. The transgene vdrb is expressed through the entire intestine whereas ifabp is expressed only in the bulb. Labeled bars by the isolated intestine schematic indicate the bulb and distal intestine regions scored for 2F11 and Alcian Blue, respectively. (H) Number of Alcian Blue-positive goblet cells in CV and GF WT and deltaD−/− larvae; n=15 (WT), 12 (CV deltaD−/−), 13 (GF deltaD−/−). *P<0.05, Student's t-test. Letters denote P<0.05, ANOVA followed by Tukey's post-hoc test. Each box represents the first to third quartiles, center bar the median, and whiskers the maximum and minimum of each dataset. |
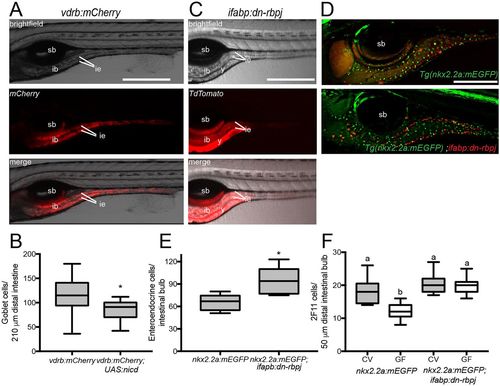
Modulating Notch signaling within the intestinal epithelium is sufficient to alter secretory cell numbers. (A) Expression of Tg(vdrb:GAL4); Tg(UAS:mCherry); (vdrb:mCherry) with brightfield, fluorescence and merged signals; vdrb:GAL4 is expressed throughout the intestinal epithelium. (B) Number of goblet cells in vdrb:mCherry and vdrb:mCherry; Tg(UAS:nicd) zebrafish. n=23 (vdrb:mCherry), 10 [vdrb:mCherry; Tg(UAS:nicd)]. (C) Expression of ifabp:dn-rbpj with brightfield, fluorescence and merged signals; note that ifabp drives expression primarily in posterior intestinal bulb and proximal intestine. (D) Representative images of Tg(nkx2.2a:mEGFP) and Tg(nkx2.2a:mEGFP) crossed with ifabp:dn-rbpj to determine the effect of modulating Notch on EECs (green) in regions in which Notch signaling is augmented or suppressed (red). (E) Number of EECs in ifabp:dn-rbpj larvae; n=5 [Tg(nkx2.2a:mEGFP)], 7 [Tg(nkx2.2a:mEGFP); ifabp:dn-rbpj]. (F) Quantification of 2F11-positive secretory cells in CV and GF Tg(nkx2.2a:mEGFP) and Tg(nkx2.2a:mEGFP); ifabp:dn-rbpj larvae; n=17 for each condition. ib, intestinal bulb; ie, intestinal epithelium; sb, swim bladder; y, yolk. *P<0.05, Student's t-test. Letters denote P<0.05, ANOVA followed by Tukey's post-hoc test. Each box represents the first to third quartiles, center bar the median, and whiskers the maximum and minimum of each dataset. Scale bars: 500 µm (A,C); 250 µm (D). |

ZFIN is incorporating published figure images and captions as part of an ongoing project. Figures from some publications have not yet been curated, or are not available for display because of copyright restrictions. PHENOTYPE:
|
|
ZFIN is incorporating published figure images and captions as part of an ongoing project. Figures from some publications have not yet been curated, or are not available for display because of copyright restrictions. PHENOTYPE:
|
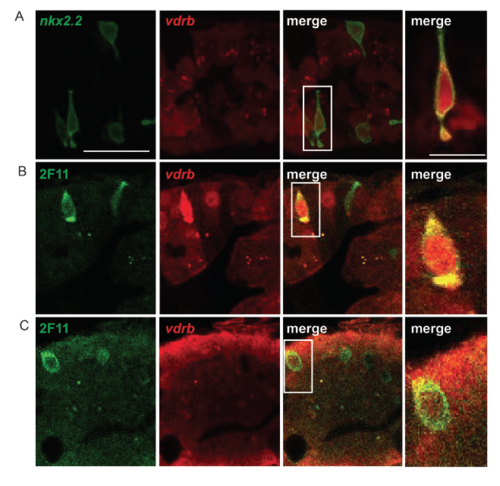
Tg(vdrb:GAL4); Tg(UAS:mCherry) expression throughout the larval intestinal epithelium, including in secretory cells. Co-expression of the enteroendocrine specific Tg(nkx2.2a:mEGFP) transgene with UAS:mCherry driven by the vdrb:GAL4 transgene [Tg(vdrb:mCherry)] (A). Tg(vdrb:mCherry) stained with secretory cell marker 2F11 showing expression in both enteroendocrine cells (B) and goblet cells (C). Each image is a single confocal plane. Scale bar = 25 μm in all panels except the three on the far right. Scale bar for the three panels on the far right = 10μm. |