
- Title
-
Ezh2 promotes clock function and hematopoiesis independent of histone methyltransferase activity in zebrafish
- Authors
- Zhong, Y., Ye, Q., Chen, C., Wang, M., Wang, H.
- Source
- Full text @ Nucleic Acids Res.

ZFIN is incorporating published figure images and captions as part of an ongoing project. Figures from some publications have not yet been curated, or are not available for display because of copyright restrictions. |
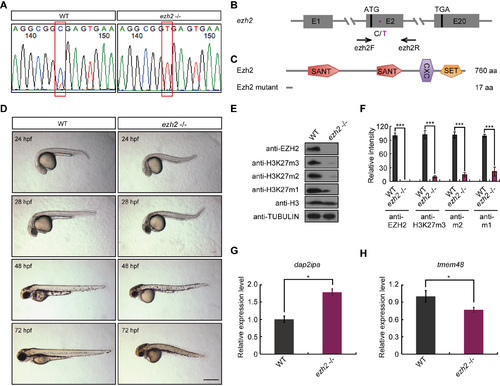
Generation and characterization of a zebrafish ezh2 null mutant. (A) The C to T point mutation in the ezh2 coding region was confirmed by DNA sequencing. WT, wild-type. (B) Gene structure of ezh2 and the point mutation occurs in Exon 2. (C) The C to T nonsense mutation results in a truncated peptide and losses of its major functional domains. SANT, SWI3, ADA2, N-CoR and TFIIIB'' DNA-binding domains; CXC, Tesmin/TSO1-like CXC domain; SET, Su(var)3–9, Enhancer-of-zeste, Trithorax domain. (D) Images of WT and ezh2–/– mutant zebrafish from 24 hpf to 72 hpf. Note that the ezh2–/– mutant zebrafish display curved tail and thin yolk sac extension around 28 hpf and short body length and small eyes after 48 hpf. Scale bar, 0.5 mm. (E) Western Blotting shows that expression of Ezh2 is abolished and that of H3K27 mono-, di- and trimethylation are reduced in ezh2–/– mutant fish. Proteins of zebrafish larvae were extracted with RIPA buffer at 48 hpf. Western Bloting was performed with indicated antibodies. (F) Quantification of western bloting images shown in (E) with ImageJ. Student's t-test was conducted. ***P <0.001. (G, H) qRT-PCR analysis of Ezh2-targeted gene dab2ipa (G) and tmem48 (H) in 28 hpf WT and ezh2–/– mutant zebrafish. Three independent experiments were conducted. Statistical analysis was performed using student's t-test. *P < 0.05. |
|
ZFIN is incorporating published figure images and captions as part of an ongoing project. Figures from some publications have not yet been curated, or are not available for display because of copyright restrictions. |
|
ZFIN is incorporating published figure images and captions as part of an ongoing project. Figures from some publications have not yet been curated, or are not available for display because of copyright restrictions. |
|
ZFIN is incorporating published figure images and captions as part of an ongoing project. Figures from some publications have not yet been curated, or are not available for display because of copyright restrictions. |
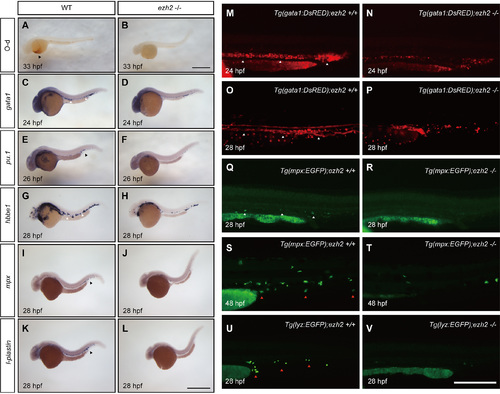
Primitive hematopoiesis is disrupted in ezh2–/– mutant zebrafish. (A, B) O-dianisidine (O-d) staining of wild-type sibling (A) and ezh2–/– mutant fish (B) at 33 hpf. Black arrowhead indicates hemoglobin-staining, which is significantly reduced in ezh2–/– mutant zebrafish. (C–L) In situ hybridization of wild-type (C, E, G, I and K) and ezh2–/– mutant embryos (D, F, H, J and L) using probes of gata1 (C, D), pu.1 (E, F), hbbe1 (G, H), mpx (I, J), l-plastin (K, L) at 26 hpf (C-F) and 28 hpf (G-L), respectively. White arrowheads in (C) and (G) indicate ICM (Intermediate cell mass) and black arrowheads in (E, I and K) PBI (Posterior blood island). Scale bar, 0.25 mm. (M–P) Images of gata1:dsRed cells in WT (M, O) and ezh2–/– mutant (N, P) fish at 24 hpf (M, N) and 28 hpf (O, P). (Q–T) Images of mpx:eGFP cells in wild-type (Q, S) and ezh2–/– mutant (R, T) fish at 28 hpf (Q, R) and 48 hpf (S, T). (U, V) Images of lyz:eGFP cells in wild-type (U) and ezh2–/– mutant (V) fish at 28 hpf. White arrowheads in (M–R) indicate ICM and red arrowheads in (S–V) PBI. Scale bar in (M–V), 0.25 mm. All images shown are lateral view, anterior to left. |
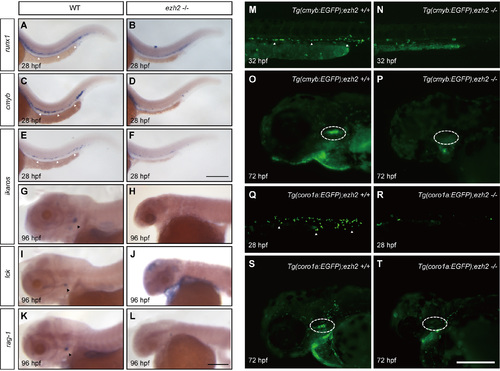
Definitive hematopoiesis is disrupted in ezh2–/– mutant zebrafish. (A–L) In situ hybridization of WT sibling (A, C, E, G, I and K) and ezh2–/– mutant embryos or larvae (B, D, F, G, J and L) using probes of runx1 (A, B), cmyb (C, D), ikaros (E, H), lck (I, J), rag-1 (K, L) at 28 hpf (A, F) and 96 hpf (G, L), respectively. White arrowheads indicate ICM in A, C and E and black arrowheads the thymus in G, I and K. Scale bar, 0.25 mm. (M–P) Images of cmyb:eGFP cells in wild-type (M, O) and ezh2–/– mutant (N, P) fish at 32 hpf (M, N) and 72 hpf (O, P). (Q–T) Images of coro1a:eGFP cells in wild-type (Q, S) and ezh2–/– mutant (R, T) fish at 28 hpf (Q, R) and 72 hpf (S, T). White arrowheads indicate ICM in M, N, Q and R and dashed circle the thymus in O, P, S and T. Scale bar in (M–T), 0.25 mm. All images shown are lateral view, anterior to left. |
|
ZFIN is incorporating published figure images and captions as part of an ongoing project. Figures from some publications have not yet been curated, or are not available for display because of copyright restrictions. |
|
ZFIN is incorporating published figure images and captions as part of an ongoing project. Figures from some publications have not yet been curated, or are not available for display because of copyright restrictions. |
|
ZFIN is incorporating published figure images and captions as part of an ongoing project. Figures from some publications have not yet been curated, or are not available for display because of copyright restrictions. |
|
ZFIN is incorporating published figure images and captions as part of an ongoing project. Figures from some publications have not yet been curated, or are not available for display because of copyright restrictions. PHENOTYPE:
|