
- Title
-
sox2 and sox3 cooperate to regulate otic/epibranchial placode induction in zebrafish
- Authors
- Gou, Y., Guo, J., Maulding, K., Riley, B.B.
- Source
- Full text @ Dev. Biol.
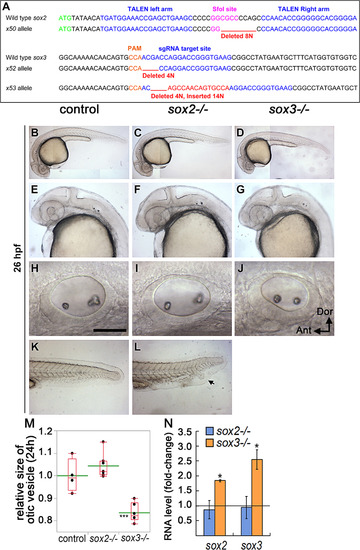
Genetic targeting ofsox2andsox3. (A) Sequences for targeting vectors for sox2 (TALEN) and sox3 (sgRNA) and resulting lesions in sox2 (allele x50) and sox3 (alleles x52 and x53). The deletion in x50 leads to loss of an SfoI restriction site (magenta), which was used for genotyping, whereas sox3 indels were identified by allele-specific PCR primers (see Materials&Methods). (B-L) Live embryos at 26 hpf showing general morphology (B-D), cranial development (E-G), tail development (K-L) and the otic vesicle (H-J, lateral views with anterior to the left; Scale bar, 50 µm) in control, sox2-/- and sox3-/- mutants. Excess cells at the ventral tip of the tail in sox2-/- embryos are indicated (arrow). (M) Box-and-whisker plot of surface area of otic vesicle, normalized to control embryos, in control embryos and sox2-/- and sox3-/- mutants. Green line indicates mean. Asterisk indicates statistically significant difference relative to control embryos (*** P<0.001, Tukey's HSD test). (N) Quantitative real time PCR measurements of fold changes in sox2 and sox3 mRNA levels in sox2-/- and sox3-/- mutants at 36 hpf normalized to wild-type control embryos. Error bars represent standard error of the means. Asterisks indicate statistically significant differences relative to controls (* P<0.05, t-tests). PHENOTYPE:
|
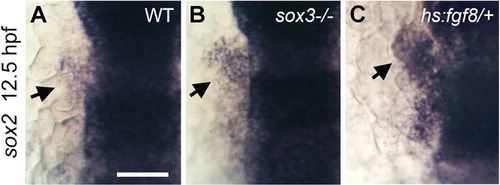
Early placodal expression ofsox2. Otic/epibranchial sox2 expression (arrows) at 12.5 hpf in a wild-type embryo (A), a sox3-/- mutant (B) and a hs:fgf8/+ transgenic embryo (C) heat shocked at 10 hpf, 39 °C for 30 min. Dorsal views with anterior up, lateral to the left. Scale bar, 100 µm. EXPRESSION / LABELING:
PHENOTYPE:
|
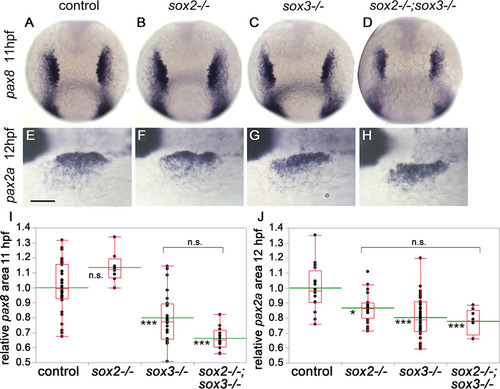
Effect ofsox2-/-andsox3-/-on early placode size. (A-H) Expression of pax8 at 11 hpf (A-D) and pax2a at 12 hpf (E-H) in control embryos (A, E), sox2-/- mutants (B, F), sox3-/- mutants (C, G) and sox2-/-; sox3-/- double mutants (D, H). Dorsal views with anterior up (A-D) or dorsal-lateral views with anterior to the left (E-H). Scale bar (E-H), 100 µm. (I, J) Box-and-whisker plots of relative surface area of otic/epibranchial domain of pax8 (I) or pax2a (J) in control, sox2-/-, sox3-/- and sox2-/-; sox3-/- double mutant embryos. Data are normalized relative to control groups, with means indicated by green lines. Asterisks indicate statistically significant differences relative to control (*P<0.05, *** P<0.001, Tukey's HSD test). Brackets indicate comparisons between non-control groups. n.s., not significantly different. EXPRESSION / LABELING:
PHENOTYPE:
|
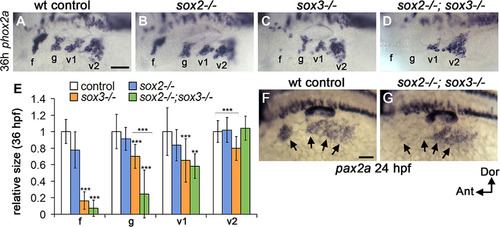
Effect ofsox2-/-andsox3-/-on epibranchial ganglia. (A-D) Expression of phox2a at 36 hpf in a wild-type embryo (A), sox2 (B), sox3-/- (C) and sox2-/-; sox3-/- double mutant (D) embryo. Locations of the facial (f), glossopharyngeal (g), and vagal (v1 and v2) ganglia are indicated. Dorsal-lateral views with anterior to the left. (E) Quantitation of relative surface area of phox2a expression in individual epibranchial ganglia in control, sox2-/-, sox3-/- and sox2-/-; sox3-/- double mutant embryos. Data show means and standard deviations normalized to wild-type controls. Asterisks indicate statistically significant differences relative to controls (** P<0.01, *** P<0.001, Tukey's HSD test), or between non-control groups (bracket). (F, G) Dorsolateral views (anterior to left) showing expression of pax2a at 24 hpf in a control embryo (F) and sox2-/-; sox3-/- double mutant (G). Arrows indicate positions of epibranchial placodes. Scale bars, 50 µm. |

Interaction betweenpax8-/-andsox3-/-during early placode development. (A-C) Expression of pax2a at 12 hpf in a wild-type control embryo (A), a pax8-/- mutant (B) and a pax8-/-; sox3-/- double mutant (C) embryo. Dorsal-lateral view with anterior to the left. Scale bar, 50 µm. (D) Box-and-whisker plot of relative surface area of otic/epibranchial domain of pax2a at 12 hpf in control, pax8-/- and pax8-/-; sox3-/- double mutant embryos. Data are normalized relative to control groups, with means indicated by green lines. Asterisks indicate statistically significant differences relative to controls (*** P<0.001, Tukey's HSD test). n.s., not significantly different. EXPRESSION / LABELING:
PHENOTYPE:
|
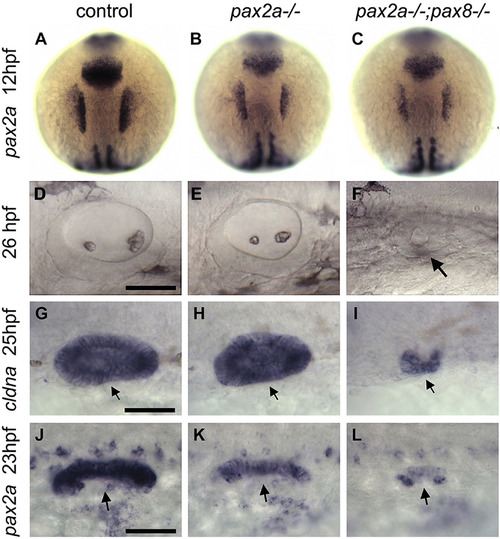
Interaction betweenpax8-/-andpax2a-/-during otic development. (A-C) Expression of pax2a at 12 hpf in control (A), pax2a-/- (B) and pax2a-/-; pax8-/- (C) embryos (dorsal views, anterior to the top). Staging of embryos was confirmed by myoD expression in somites. (D-F) Lateral views (anterior to left) of the otic vesicle in control (D), pax2a-/- (E) and pax2a-/-; pax8-/- (F) embryos imaged live at 26 hpf. The small otic vesicle in the pax2a-/-; pax8-/- double mutant (F) is marked with an arrow. (G-L) Dorsal views (anterior to left) showing expression of cldna (G-I) and pax2a (J-L) at 25 hpf and 23 hpf respectively in control (G, J), pax2a-/- (H, K) and pax2a-/-; pax8-/- (I, L) embryos. Arrows indicate otic expression domains. Scale bars (D-L), 50 µm. EXPRESSION / LABELING:
PHENOTYPE:
|
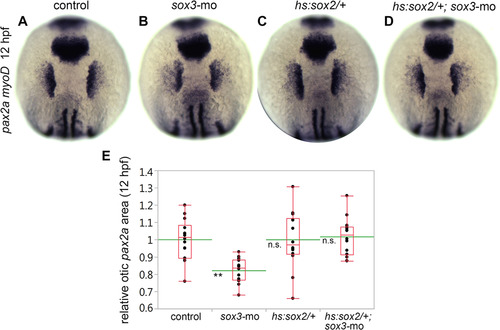
sox2can substitute forsox3during early otic development. (A-D) Dorsal views (anterior to the top) showing expression of pax2a at 12 hpf in a control embryo (A), a sox3-morphant (B), a hs:sox2/+ heterozygote (C) and hs:sox2/+ heterozygote injected with sox3-mo (D). Embryonic staging was confirmed with myoD expression in somites. Embryos were heat shocked at 35 °C from 10 to 12 hpf. sox3-morphants in (B) and (D) were injected with 5 ng each of sox3-mo. (E) Box-and-whisker plots of relative surface area of the otic/epibranchial domain of pax2a at 12 hpf in controls, sox3-morphants, hs:sox2/+ heterozygotes and hs:sox2/+ heterozygotes injected with sox3-mo. Data are normalized relative to control groups, with means indicated by green lines. Asterisks indicate statistically significant differences compare to control (** P<0.01, Tukey's HSD test). n.s., no significant difference compared to controls. EXPRESSION / LABELING:
PHENOTYPE:
|
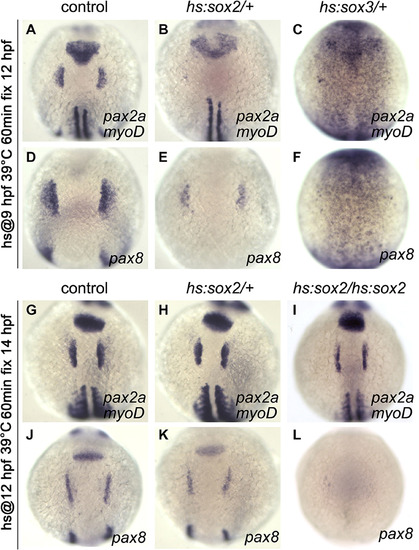
Global misexpression ofsox2orsox3. (A-F) Expression of pax2a (A-C) and pax8 (D-F) at 12 hpf in control embryos (A, D), hs:sox2/+ heterozygotes (B, E) and hs:sox3/+ heterozygotes (C, F) that were heat shocked at 9 hpf, 39 °C for 60 min. (G-L) Expression of pax2a (G-I) and pax8 (J-L) at 14 hpf in control embryos (G, J), hs:sox2/+ heterozygotes (H, K) and hs:sox2/hs:sox2 homozygotes (I, L) that were heat shocked at 12 hpf, 39 °C for 60 min. Embryonic staging was confirmed with myoD expression in somites. All images show dorsal views with anterior to the top. EXPRESSION / LABELING:
PHENOTYPE:
|
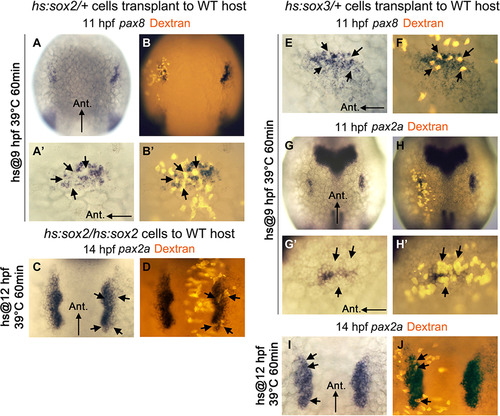
Mosaic misexpression ofsox2orsox3. (A-B′) Expression of pax8 at 11 hpf in a wild-type host embryo into which fluorescent dextran-labeled hs:sox2/+ transgenic cells were transplanted. The embryo was heat shocked at 9 hpf, 39 °C for 60 min. Bright-field (A, A′) and fluorescent (B, B′) images of the same specimen. An enlargement of the left otic placode (A′, B′) shows the positions of transgenic cells (arrows). (C, D) Bright-field (C) and fluorescent (D) images showing pax2a expression at 14 hpf in a wild-type host embryo with fluorescent dextran-labeled hs:sox2/hs:sox2 transgenic cells (indicated by arrows). The embryo was heat shocked at 12 hpf, 39 °C for 60 min. (E, F) Bright-field (E) and fluorescent (F) images showing pax8 expression in the otic placode at 11 hpf in a wild-type host embryo with fluorescent dextran-labeled hs:sox3/+ transgenic cells. The embryo was heat shocked at 9 hpf, 39 °C for 60 min, and the positions of transgenic cells are indicated (arrows). (G-H′) Bright-field (G, G′) and fluorescent (H, H′) images showing pax2a expression at 11 hpf in a wild-type host embryo with fluorescent dextran-labeled hs:sox3/+ transgenic cells. The embryo was heat shocked at 9 hpf, 39 °C for 60 min. An enlargement of the left otic placode (G′, H′) shows positions of transgenic cells (arrows). (I, J) Bright-field (I) and fluorescent (J) images showing pax2a expression at 14 hpf in a wild-type host embryo with fluorescent dextran-labeled hs:sox3/+ transgenic cells. The embryo was heat shocked at 12 hpf, 39 °C for 60 min. Positions of transgenic cells are indicated (arrows). |
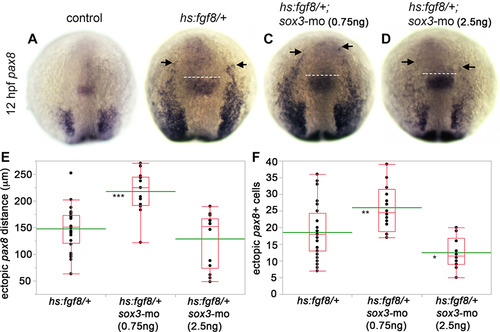
Ectopic otic induction requires an optimal level ofsox3. (A-D) Expression of pax8 at 12 hpf in a control (A), hs:fgf8/+ heterozygote (B), hs:fgf8/+ heterozygote injected with 0.75 ng sox3-mo (C) and hs:fgf8/+ heterozygote injected with 2.5 ng sox3-mo (D) embryo. Embryos were heat shocked at 10 hpf, 39 °C for 30 min. The anterior edge of the midbrain-hindbrain boundary (dashed white line) was used as a reference to measure ectopic expression of pax8. Arrows mark the anterior limit of ectopic pax8 expression (B-D). (E) Box-and-whisker plot of the distance from midbrain-hindbrain border to the anterior limit of ectopic pax8 expression in hs:fgf8/+ heterozygotes, hs:fgf8/+ heterozygotes injected with 0.75 ng sox3-mo and hs:fgf8/+ heterozygotes injected with 2.5 ng sox3-mo. (F) Box-and-whisker plot of the number (per side) of ectopic pax8-expressing cells anterior to the midbrain-hindbrain border in hs:fgf8/+ heterozygotes, hs:fgf8/+ heterozygotes injected with 0.75 ng sox3-mo and hs:fgf8/+ heterozygotes injected with 2.5 ng sox3-mo. The green line indicates the mean. Asterisks indicate statistically significant differences compare to control (* P<0.05, ** P<0.01, *** P<0.001, Tukey's HSD test). EXPRESSION / LABELING:
PHENOTYPE:
|
Reprinted from Developmental Biology, 435(1), Gou, Y., Guo, J., Maulding, K., Riley, B.B., sox2 and sox3 cooperate to regulate otic/epibranchial placode induction in zebrafish, 84-95, Copyright (2018) with permission from Elsevier. Full text @ Dev. Biol.