
- Title
-
Rb1 promotes T cell maturation from premature apoptosis by inhibiting E2F1
- Authors
- Zhang, Z., Liu, W., Zhao, L., Huang, Z., Chen, X., Ma, N., Xu, J., Zhang, W., Zhang, Y.
- Source
- Full text @ Development

ZFIN is incorporating published figure images and captions as part of an ongoing project. Figures from some publications have not yet been curated, or are not available for display because of copyright restrictions. EXPRESSION / LABELING:
PHENOTYPE:
|
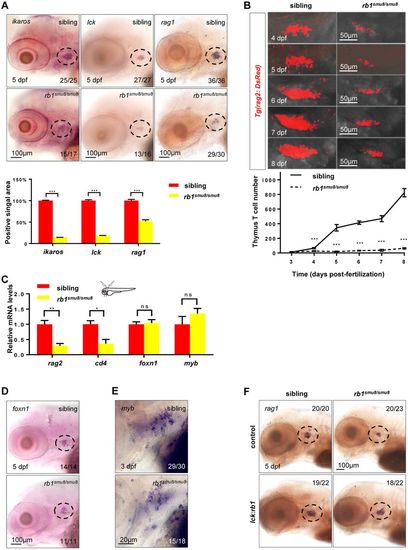
T-cell maturation is impaired in rb1-deficient embryos. (A) Expression of ikaros, lck and rag1 in the thymus (broken line) of siblings and rb1 mutants at 5 dpf (upper panels). Embryos for whole-mount in situ hybridization were obtained from an incross of genotyped heterozygous rb1 mutants. Scale bars: 100 μm. The positive signal areas were analysed using Image-Pro Plus (lower panel) (***P<0.001; mean±s.e.m.; n=16). (B) Confocal images of rag2:DsRed cells in the thymus of the siblings and rb1smu8/smu8 mutants from 4 dpf to 8 dpf (upper panels). Scale bars: 50 μm. Quantification of T-cell number in sibling embryos and rb1smu8/smu8 mutants (lower panel) (***P<0.001; mean±s.e.m.; n=10). (C) Schematic of the lateral view of a zebrafish indicating the region of the thymus excised for RNA extraction (red dot). qPCR analysis of rag2, cd4, foxn1 and myb in the thymus of siblings and rb1-deficient embryos at 5 dpf (mean±s.e.m.; **P<0.01, *P<0.05, ns, not significant; n=30). (D) Whole-mount in situ hybridization of foxn1 in the thymus (broken line) of siblings and rb1smu8/smu8 mutants at 5 dpf. Scale bars: 100 μm. (E) Whole-mount in situ hybridization of cmyb in the thymus of the siblings and rb1smu8/smu8 mutants at 3 dpf. Scale bars: 20 μm. (F) Whole-mount in situ hybridization of rag1 in the thymus (broken line) at 5 dpf after injecting with control and pTol-lck:rb1 plasmid. Scale bars: 100 μm. EXPRESSION / LABELING:
|
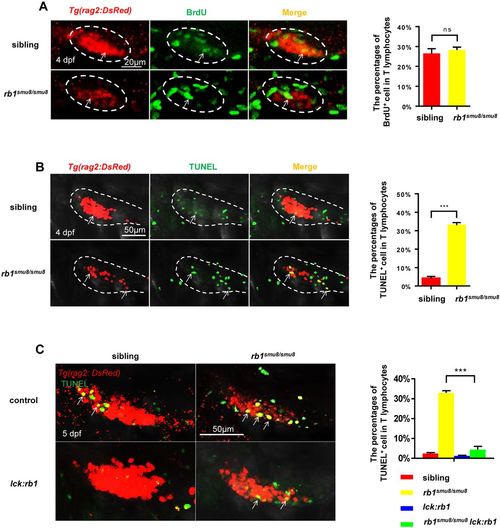
Excessive apoptotic early T lymphocytes in the thymus of rb1smu8/smu8 mutants. (A) Double staining of BrdU/rag2-dsRed show BrdU incorporation of T cells in 4 dpf siblings and rb1smu8/smu8 mutants (left). The white ovals indicate the thymus region. The white arrows indicate proliferative T cells. Scale bars: 20 μm. The graph shows the percentages of rag2:DsRed+ T cells that incorporate BrdU (mean± s.e.m.; ns, not significant; n=10). (B) Double staining of TUNEL/rag2-dsRed shows TUNEL incorporation by T-cells in 4 dpf siblings and rb1smu8/smu8 mutants. The broken line outlines the thymus region. The white arrows indicate apoptotic T cells. Scale bar: 50 μm. The graph shows the percentages of rag2:DsRed+ T cells that incorporate TUNEL (mean±s.e.m.; ***P<0.001; n=9). (C) Confocal images of T cells (red) exhibiting cell apoptosis (overlap of TUNEL staining) of siblings and rb1smu8/smu8 mutant embryos injected with control or pTol-lck:rb1 plasmid at 5 dpf. Scale bars: 50 μm. The graph shows the percentages of T cells (red) exhibiting cell apoptosis (overlap of TUNEL staining) in siblings and rb1smu8/smu8 mutant embryos injected with control or pTol-lck:rb1 plasmid (mean±s.e.m.; ***P<0.001; n=10). |
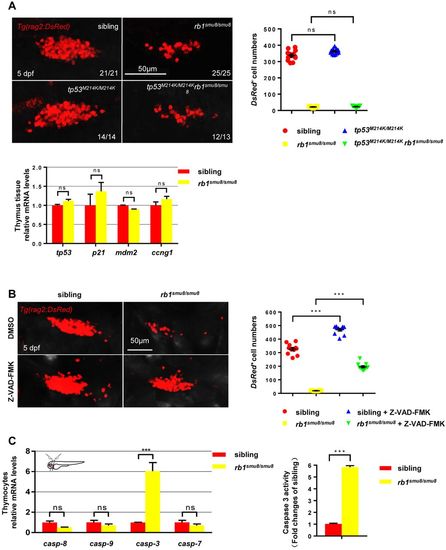
rb1 deficiency induced apoptosis in a caspase-dependent manner. (A) Confocal images of rag2:DsRed cells in the thymus of the siblings, rb1smu8/smu8 mutants, tp53M214K/M214K and tp53M214K/M214Krb1smu8/smu8 double mutants at 5 dpf. Scale bars: 50 μm. Quantification of DsRed+ cell numbers in the thymus (right). Expression of tp53, p21, mdm2 and ccng1 in thymocytes excised from siblings and rb1-deficient embryos at 5 dpf (bottom) (mean±s.e.m.; ns, not significant; n=11). (B) Confocal images of rag2:DsRed cells in the thymus of DMSO-treated siblings, DMSO-treated rb1smu8/smu8 mutants, Z-VAD-FMK-treated siblings and Z-VAD-FMK-treated rb1smu8/smu8 mutants at 5 dpf. Scale bars: 50 μm. Quantification of DsRed+ cell numbers in the thymus of sibling embryos and rb1smu8/smu8 mutants (right) (mean±s.e.m.; ***P<0.001; n=10). (C) Expression of caspase mRNA in thymocytes excised from siblings and rb1-deficient embryos at 5 dpf (mean±s.e.m.; *P<0.05; ***P<0.001; ns, not significant; n=30). The activity of caspase 3 in siblings and rb1smu8/smu8 embryos is expressed as the fold change compared with siblings (mean±s.e.m.; ns, not significant; n=10). |
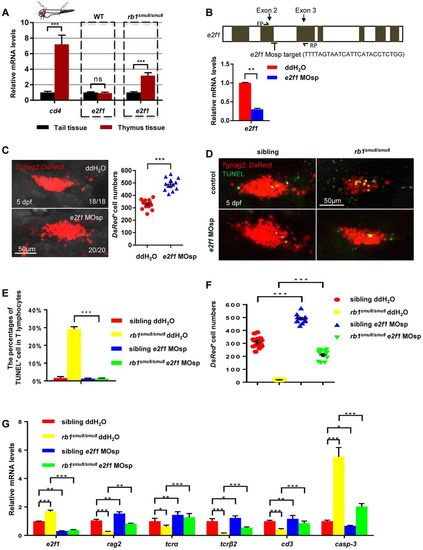
The excessive apoptosis of early T lymphocytes in the thymus of rb1smu8/smu8 mutants is e2f1 mediated. (A) Relative expression of e2f1 in excised thymus and tail tissue from 5 dpf embryos by qPCR analysis (mean±s.e.m.; ***P<0.001; ns, not significant; n=30). (B) The zebrafish e2f1 gene structure. Exons are indicated by grey boxes. Location and sequence of the splice morpholino (MOsp) target site for the e2f1 gene. FP/RP, e2f1 qPCR forward/reverse primers. Relative expression of e2f1 in controls and e2f1 morphants at 5 dpf by qPCR analysis (mean±s.e.m.; **P<0.01; n=30). (C) Confocal images of rag2:DsRed cells in the thymus of wild-type embryos injected with double distilled H2O or e2f1 MOsp at the one-cell stage with rag2:DsRed+ cell number measured at 5 dpf. Scale bars: 50 μm. Quantification of rag2-DsRed+ cells (right panel) (mean±s.e.m.; ***P<0.001; n=13). (D) Confocal images of T cells (red) exhibiting cell apoptosis (overlap of TUNEL staining) in siblings and rb1smu8/smu8 mutant embryos injected with double distilled H2O or e2f1 MOsp at 5 dpf. Scale bars: 50 μm. (E) Percentages of T cells (red) exhibiting cell apoptosis (overlap of TUNEL staining) in siblings and rb1smu8/smu8 mutant embryos injected with double distilled H2O or e2f1 MOsp at 5 dpf (mean±s.e.m.; ***P<0.001; n=20). (F) Quantification of rag2-DsRed+ cell shown in D (mean±s.e.m.; ***P<0.001; n=10). (G) qPCR analysis of e2f1, rag2, tcra, tcrb, cd3 and casp3 expression in mutants injected with double distilled H2O or e2f1 MOsp at 5 dpf (mean±s.e.m.; ***P<0.001, **P<0.01 *P<0.05; n=30). |
|
ZFIN is incorporating published figure images and captions as part of an ongoing project. Figures from some publications have not yet been curated, or are not available for display because of copyright restrictions. |
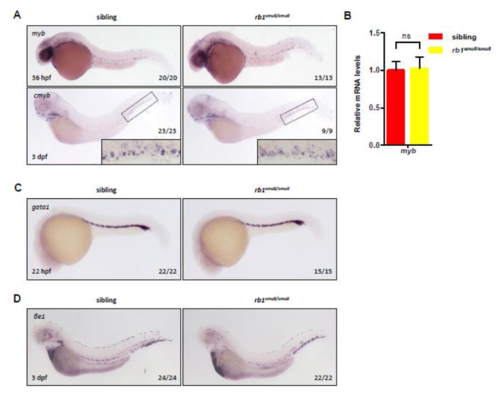
HSCs and erythroid lineages are not affected by rb1 mutation. (A) WISH staining shows cmyb expression at 36 hpf, and 3 dpf siblings and rb1smu8/smu8 embryos. The inset is a high magnification of the boxed region. (B) qPCR analysis of the cmyb mRNA expression of sibling and rb1smu8/smu8 embryos at 3 dpf. ns, not significant. (C and D) WISH staining shows the expression of gata1 at 22 hpf and βe1 at 3 dpf. |
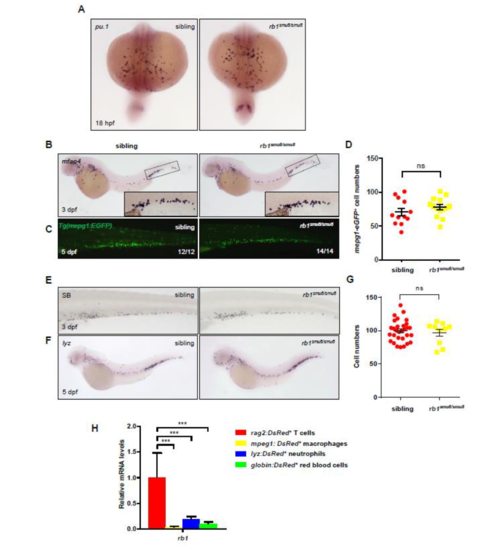
Myeloid cells development was largely unaffected in rb1smu8/smu8 mutant zebrafish. (A) pu.1 WISH staining shows normal myeloid progenitors in the RBI regions of 18 hpf rb1smu8/smu8 mutants compared to siblings. (B and C) mfap4 WISH staining at 3 dpf, and mepg1:EGFP immunochemistry staining at 5 dpf rb1-deficient embryos shows normal development of peripheral macrophages. (D) Quantifications of mepg1+ cells at 5 dpf sibling and rb1-deficient embryos. Error bars represent mean±SEM. ns, not significant. (E and F) Sudan Black (SB) staining at 3 dpf, and lyz WISH staining at 5 dpf rb1-deficient embryos shows normal development of neutrophil. (G) Quantifications of lyz+ cells at 5 dpf sibling and rb1-deficient embryos in the CHT regions. Error bars represent the mean ± SEM; ns, not significant. (H) qPCR analysis of rb1 in different lineages of hematopoietic cells. Fluorescent cells were sorted from 5-dpf transgenic larvae. rag2:DsRed+: lymphocytes; mpeg1:DsRed+: macrophages; lyz:DsRed+: neutrophils; globin:DsRed+: red blood cells. |
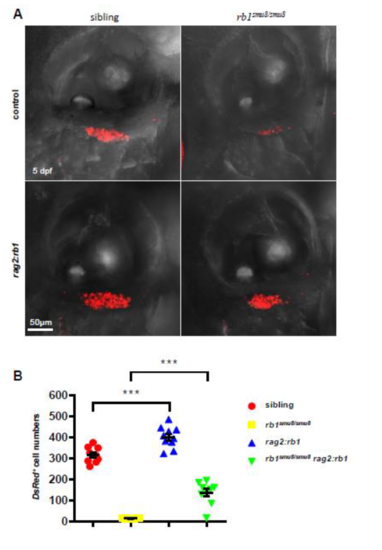
Rescue of T cell numbers in rb1smu8/smu8 mutant with rb1 restoration. (A) Confocal images of rag2:DsRed+ cells in the thymus of 5-dpf larvae injected with pTol-rag2:rb1 construct (lower panel) or control plasmid (upper panel). (B) Quantification of DsRed+ cells in the thymus. (***p<0.001; mean±SEM.; n=10) |