
- Title
-
Maternal Nanog is critical for the zebrafish embryo architecture and for cell viability during gastrulation
- Authors
- Veil, M., Schaechtle, M.A., Gao, M., Kirner, V., Buryanova, L., Grethen, R., Onichtchouk, D.
- Source
- Full text @ Development
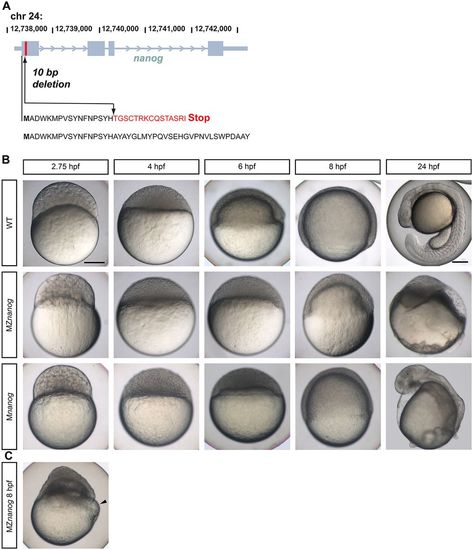
Live phenotypes of Nanog mutants. (A) Scheme of the introduced mutation in the zebrafish nanog gene by TALENs. In the first exon 10 bp were deleted (arrow). Amino acids changed in the nanog mutant are shown in red. The wild-type Nanog amino acid sequence is shown beneath. (B) Lateral view of wild-type (WT), MZnanog and Mnanog embryos from 2.75 to 24 hpf. (C) Blastoderm detachment and start of yolk lysis (arrowhead) in an MZnanog embryo. Scale bar: 200 µm. |
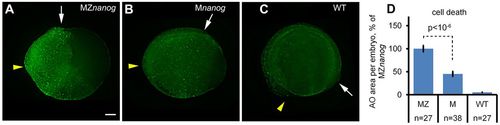
Cell death is increased in Nanog mutants. (A-C) Groups of Acridine Orange (AO)-stained dead cells in 12 hpf MZnanog (A), Mnanog (B) and wild-type (WT, C) embryos are visible as green spots. Yellow arrowheads and white arrows point to anterior and posterior ends of dorsal embryo axes, respectively. Scale bar: 100 µm. (D) The increase in cell death in MZnanog over Mnanog is statistically significant (P<10−6, Student's t-test); n, number of scored embryos. Error bars represent s.e.m. PHENOTYPE:
|
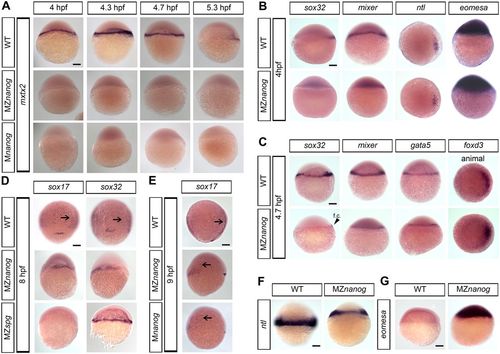
Expression of mxtx2, eomesa and endomesodermal markers in Nanog mutants. Expression of the indicated genes in wild-type (WT), Mnanog and MZnanog embryos was visualized by in situ hybridization. Dorsal is to the right. (A) mxtx2 expression is absent in MZnanog and Mnanog (lateral view). (B) Sphere stage expression of sox32, mixer and eomesa (lateral view) and ntl (animal view). Note that sox32 and mixer are not detectable in MZnanog, but ntl and eomesa expression is not altered. (C) 30% epiboly stage expression for sox32, mixer, gata5 (lateral view) and foxD3 (animal view). f.c., forerunner cells (arrowhead). (D) sox17 and sox32 staining at 8 hpf in WT, MZnanog and MZspg (dorsal view). Note that sox17 and sox32 are both expressed in MZnanog, but only sox32 is expressed in MZspg. (E) sox17 staining in WT, MZnanog and Mnanog (9 hpf, lateral view). In D,E, arrows show scattered endodermal cells. (F) ntl expression at 6 hpf (lateral view). (G) eomesa expression at 5.3 hpf (lateral view). Scale bars: 100 µm. EXPRESSION / LABELING:
PHENOTYPE:
|
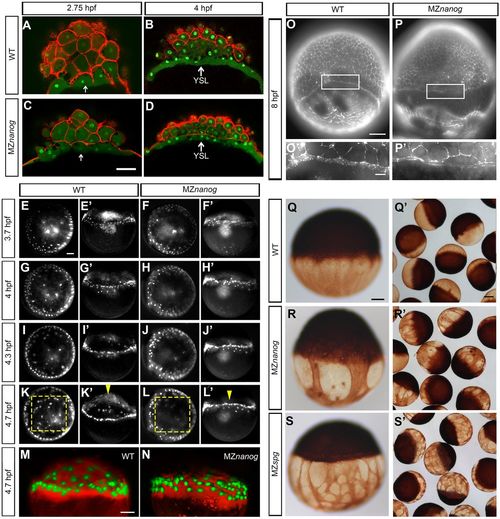
Multiple abnormalities in MZnanog embryo architecture. (A-D) YSL (white arrows) forms normally in MZnanog. Lateral optical sections of wild type (WT; A,B) and MZnanog (C,D) stained for nuclei (SYTOX green) and cell membranes (rhodamine-phalloidin) at the 512-cell (A,C) and sphere (B,D) stages. (E-L′) Animal (E-L) and lateral (E′-L′) view of SYTOX Green-injected WT and MZnanog embryos in images captured from time-lapse recording (Movies 2 and 3). (E-H′) At oblong (E-F′) and sphere (G-H′) stages YSL nuclei of WT and MZnanog show no difference; two to three rows of YSL nuclei are visible in the periphery of blastoderm. (I-J′) Early dome stage (before the doming starts). (I,I′) In a WT embryo, YSL nuclei are compacted and aligned in one row in the periphery of blastoderm. (J,J′) In MZnanog, YSL nuclei do not compact; nuclei distribution is similar to sphere stage. (K-L′) 30% epiboly. In the WT (K,K′), but not in MZnanog (L,L′), some YSL nuclei move from periphery to the central region and doming occurs (compare yellow boxes that frame the YSL centers in K and L and yellow arrowheads that point to the YSL center in K′ and L′). (M,N) Yolk doming is visible in WT (M), but not MZnanog (N) at 4.7 hpf. Lateral view. YSL and YSL nuclei were labeled by tetramethylrhodamine-dextran and SYTOX Green co-injection. (O-P′) Actin was stained with rhodamine phalloidin in WT (O) and MZnanog (P) embryos, 8 hpf. O′ and P′ are magnifications of the boxed areas showing the EVL-YSL border. The punctate F-actin ring colocalized with vesicles is visible in the EVL-YSL border in the WT; no vesicles and two tiny rings are visible in MZnanog. (Q-S′) YCL microtubules were visualized by anti-tubulin staining at 6 hpf in WT (Q,Q′), MZnanog (R,R′) and MZspg (S,S′) embryos. Scale bars: 100 µm (A-D,E-L',M-P,Q-S); 20 µm (O′,P′); 200 µm (Q′,R′,S′). PHENOTYPE:
|
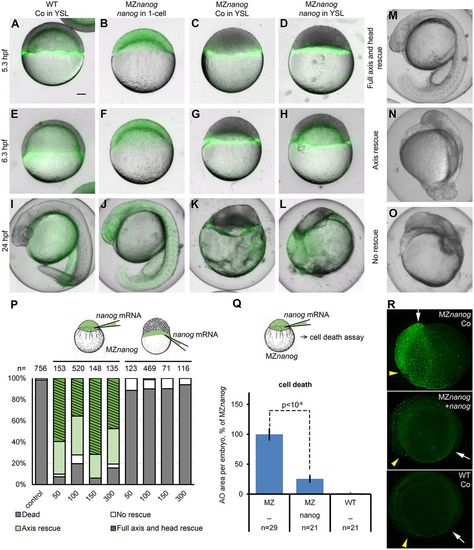
nanog mRNA injection at 1-cell stage completely rescues MZnanog embryos. (A-L) Representative embryo phenotypes from a single rescue experiment: nanog mRNA or control (Co) mRNA, as indicated, was co-injected with Alexa 488 dextran (green) in the YSL (A,C-E,G-I,K,L) or in 1-cell stage (B,F,J) of wild-type (WT; A,E,I) or MZnanog (B-D,F-H,J-L) embryos. Live images in differential interference contrast and green fluorescence were taken at indicated stages. (M-O) Phenotypic classes used for scoring the rescued phenotypes at 24 hpf. (P) Rescue statistics after 24 hpf. Concentrations of nanog mRNA are indicated below the graph in pg per embryo. Numbers of embryos from two experiments are indicated above the bars. Schematics indicate the injection protocol. (Q,R) nanog mRNA injection at the 1-cell stage rescues cell death of MZnanog. MZnanog embryos were injected with nanog mRNA at 1-cell stage or not injected (–; Co) and stained at 9 hpf with Acridine Orange to detect and score dead cells. (Q) Dead cells rescue statistics: nanog mRNA injection significantly reduces cell death in MZnanog (P<10−6, Student's t-test); n, number of scored embryos. Error bars represent s.e.m. (R) Groups of dead cells in MZnanog control, MZnanog nanog-injected embryos and WT, as indicated. Embryos shown at 12 hpf. Yellow arrowheads and white arrows point to anterior and posterior ends or dorsal embryo axes, respectively. Scale bar: 100 µm (A-O). |
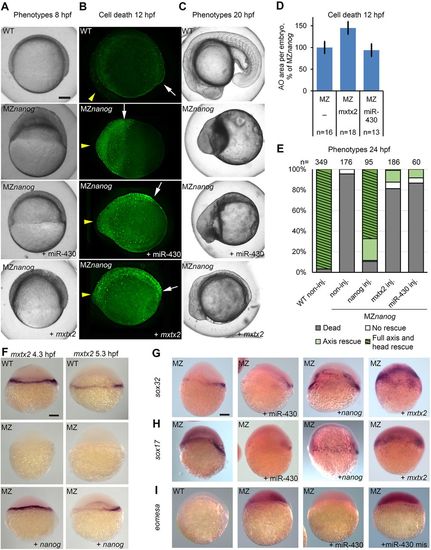
mxtx2 or miR-430 injection at the 1-cell stage rescues epiboly but not cell death in MZnanog embryos. (A-C) MZnanog embryos were injected at the 1-cell stage with mxtx2 mRNA or miR-430, as indicated, or not injected. Wild-type (WT) embryos were used as stage control. (A) Representative phenotypes at 8 hpf. Note the thinning of blastoderm and epiboly progression in injected MZnanog embryos compared with non-injected MZnanog. (B) Staining for dead cells in 12 hpf embryos. Yellow arrowheads and white arrows point to anterior and posterior ends of embryo axes, respectively. (C) Representative phenotypes at 20 hpf. (D) Dead cells rescue statistics: neither mxtx2 nor miR-430 mRNA injection reduced cell death in MZnanog; n, number of scored embryos. Error bars represent s.e.m. (E) Phenotype rescue statistics after 24 hpf. One-cell stage MZnanog embryos were injected as indicated or left non-injected; classes used for scoring are shown in Fig. 5M-O. Numbers of embryos are indicated above the bars. (F-I) In situ hybridization for mxtx2 at 4.3 and 5.3 hpf (F), sox32 at 8 hpf (G), sox17 at 8 hpf (H) and eomesa at 6 hpf (I). Genotypes are indicated top left as MZ (MZnanog) or WT, injected substances are indicated bottom right. Lateral views. Scale bars: 100 µm. |
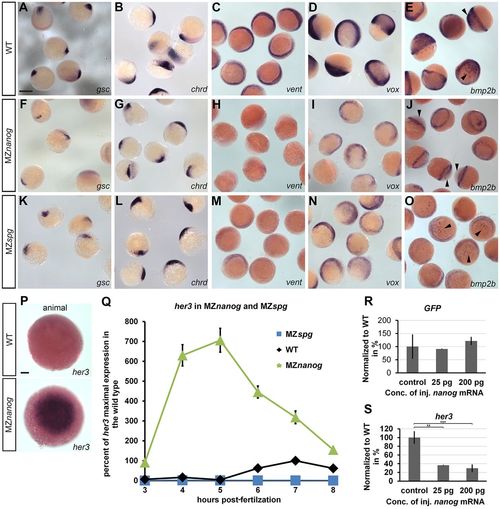
Nanog is required for the expression of the ventral genes bmp2b, vox and vent and for the proper expression levels of the neural gene her3. (A-O) In situ hybridization for dorsal- and ventral-specifying genes was performed in parallel using wild type (WT), MZnanog and MZspg at the shield stage. The dorsal markers gsc (A,F,K) and chrd (B,G,L) are slightly reduced in MZnanog embryos. vent expression (C,H,M) is not detectable in MZnanog but is visible although reduced in MZspg. vox (D,I,N) and bmp2b (E,J,O) expression is reduced in the mesoderm and missing from the ectoderm of MZnanog (arrowheads), whereas in MZspg expression in both tissues is reduced, but detectable. (P) In situ hybridization at 4.7 hpf for her3 in WT and MZnanog (animal view). At this stage, her3 in the WT is expressed in presumptive neural ectoderm (Hans et al., 2004). Because of the upregulation in the MZnanog mutant, the staining reaction was stopped before this staining was visible. (Q) her3 time curve generated by quantitative real-time PCR on WT, MZnanog and MZspg. Embryos were collected at 1 h intervals from 3 hpf to 8 hpf. All expression values were normalized to her3 maximal expression in WT (7 hpf). Error bars represent s.d.; n=3. (R,S) Overexpression of Nanog in Tg(her3enh1-GFP) embryos changes her3 levels. We injected nanog or control mRNA in Tg(her3enh1-GFP) transgenic embryos at the 1-cell stage and performed quantitative RT-PCR on shield stage-embryos measuring changes of her3 and GFP RNA levels. Overexpression of Nanog did not change GFP levels (R) but repressed endogenous her3 (**P<0.001, ***P<1*E−05, Student's t-test) (S). Error bars represent s.d., n=3. Scale bars: 700 µm (A-O); 100 µm (P). EXPRESSION / LABELING:
PHENOTYPE:
|
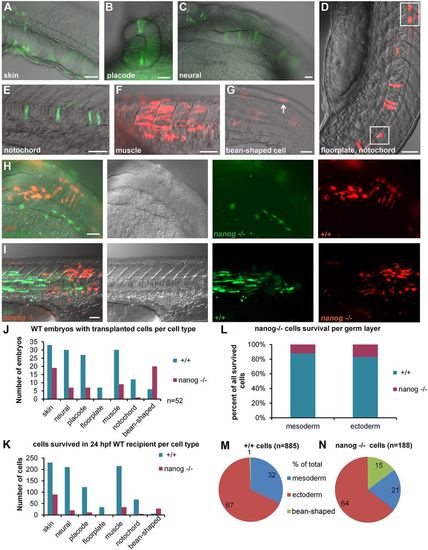
Transplantation experiment reveals cell-autonomous death of nanog−/− cells. (A-G) Scored cell types: skin cells (A), placode, e.g. eye (B), neural epithelial cells in the hindbrain (C), floorplate cells (D), cells in the notochord (E), muscle cells (F), non-specified ‘bean-shaped’ cells (G). Anterior is always to the right, except in D in which anterior is toward the top. (H,I) Two examples of differentiated co-transplanted wild-type (+/+) and nanog−/− cells in 24 hpf wild-type (WT) host. Overlay, differential interference contrast, green and red channels from left to right. (H) Neural tissue: nanog−/− cells (green) differentiated as skin and +/+ cells (red) contributed to neural epithelium in the hindbrain region of the 24 hpf WT host. (I) Trunk muscles: 6 nanog−/− (red) muscle fibers and 27 +/+ (green) muscle fibers are visible. (J) Number of embryos with at least one transplanted cell per cell type for +/+ and nanog−/− cells in 52 hosts (note that the embryos which contained several types of donor cells were scored more than once). (K) Total number of transplanted cells per tissue in 52 hosts. P-values for the difference between the numbers of +/+ and nanog−/− cells were significant for all tissues (P<0.01, paired t-test; see also Table S3). (L) Percentage of surviving cells separated by germ layer: mesoderm (muscle and notochord) and ectoderm (skin, neural cells, placodes and floorplate cells). Contribution of nanog−/− cells to both mesodermal and ectoderm derivatives was <20%. (M,N) Distribution of +/+ and nanog− /− cells between mesodermal and ectodermal tissue and non-specified ‘bean-shaped’ cells. Scale bars: 40 µm (A,C-G,I); 200 µm (B); 100 µm (H). |