
- Title
-
Nr2f1a balances atrial chamber and atrioventricular canal size via BMP signaling-independent and -dependent mechanisms
- Authors
- Duong, T.B., Ravisankar, P., Song, Y.C., Gafranek, J.T., Rydeen, A.B., Dohn, T.E., Barske, L.A., Crump, J.G., Waxman, J.S.
- Source
- Full text @ Dev. Biol.
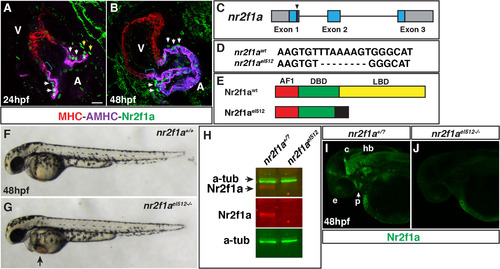
Nr2f1a is expressed in ACs and generation of anr2f1amutant allele. (A,B) IHC for MHC (red), AHMC (purple), and Nr2f1a (green) at 24 and 48 hpf. Nr2f1a+ nuclei in cells at the venous pole adjacent to AMHC+ cells (yellow arrowheads), which we propose are putatively atrial progenitors. Expression in nuclei of ACs (white arrows). Blue brackets indicate AMHC+ region devoid of Nr2f1+ nuclei. Images are Z-stacks of confocal sections. V indicates ventricle and A indicates atrium in all figures. Scale bar indicates 10 µm in A,B. ≥ 10 hearts were examined at each stage. (C) Schematic of deletion in nr2f1a exon 1 from the TALENs. (D) Sequence of the 8-bp deletion in the nr2f1ael512 mutant allele. (E) Schematic indicating the predicted truncation caused by the deletion. Activation domain – AF1 (red), DNA-binding domain – DBD (green), Ligand binding domain – LBD (yellow). Black indicates amino acids after the protein goes out of frame. (F,G) WT and nr2f1ael512-/- mutant embryos at 48 hpf. (H) Western blot indicating that Nr2f1a protein is lost in nr2f1a mutants. (I,J) Confocal images of whole mount IHC indicating Nr2f1a protein is expressed in the same anatomical structure as shown previously with ISH (Love and Prince, 2012) and is lost in nr2f1a mutants. Images are the dorsolateral with anterior left. e – eyes, p – pharyngeal (arrow in I), c – cerebellum, hb –hindbrain.>20 wt sibling and nr2f1a mutant embryos were examined. |
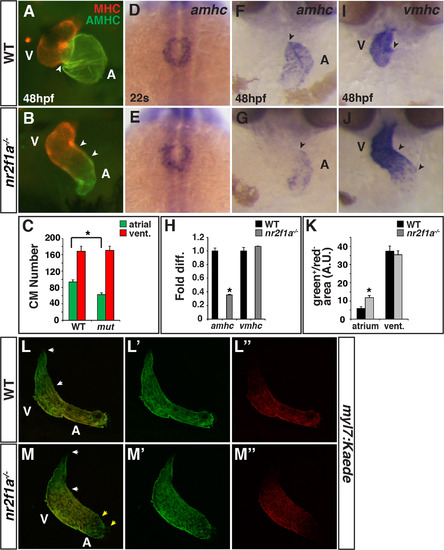
Nr2f1amutants have smaller atria. (A,B) IHC for MHC (red) and AMHC (green). Sharp border between MHC and AMHC in WT embryos (arrowhead in A). Diffuse border of AMHC expression (arrowheads in B). (C) Number of ACs and VCs in WT sibling (n = 12) and nr2f1a mutant (n = 14) embryos. (D,E) ISH for amhc at the 22 s stage. Images are dorsal views with anterior up. (F,G) ISH for amhc at 48 hpf. Border of expression (arrowheads). (H) RT-qPCR for amhc and vmhc in WT sibling and nr2f1a mutant embryos. (I,J) ISH for vmhc at 48 hpf. Distinct border of expression (arrowhead in I). Expansion and diffuse border of expression (arrowheads in J). Images in F,G,I,J are frontal views.>20 embryos per condition were examined for A,B,D,E,F,G,I,J. (K) Amount of green+/red- cells (area) at the venous (atrium) and arterial (ventricular) poles in WT and nr2f1a mutant embryos. (L-M″) Confocal images of hearts depicting the addition of differentiating cells (green+/red- cells) at the venous and arterial poles (yellow and white arrowheads, respectively). Asterisks indicates significant difference (P<0.05) in all figures. EXPRESSION / LABELING:
PHENOTYPE:
|
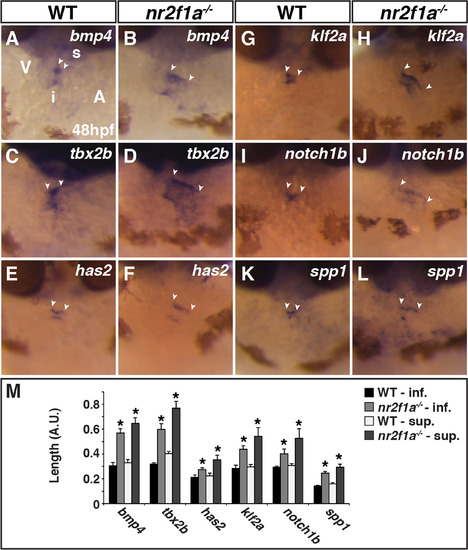
AVC markers are expanded innr2f1amutant hearts. (A-L) ISH for bmp4 (A,B), tbx2b (C,D), has2 (E,F), klf2a (G,H), notch1b (I,J), and spp1 (K,L) in WT and nr2f1a mutant embryos. Images are frontal views with dorsal up. The relative position of the ventricle and atrium is the same in all images. Arrowheads indicate the length of expression on the superior side (s) of the AVC, which is adjacent to the inner curvature of the ventricle. Inferior side (i) of the AVC is adjacent to the outer curvature of the ventricle. (M) Length measurements of marker expression in the AVC. (WT bmp4 n = 7, nr2f1a-/-bmp4 n = 7, WT tbx2b n = 10, nr2f1a-/-tbx2b n = 10, WT has n = 7, nr2f1a-/-has n = 7, WT klf2a n = 6, nr2f1a-/-klf2a n = 6, WT notch1b n = 5, nr2f1a-/-notch1b n = 5, WT spp1 n = 9, nr2f1a-/-klf2a n = 9.). |
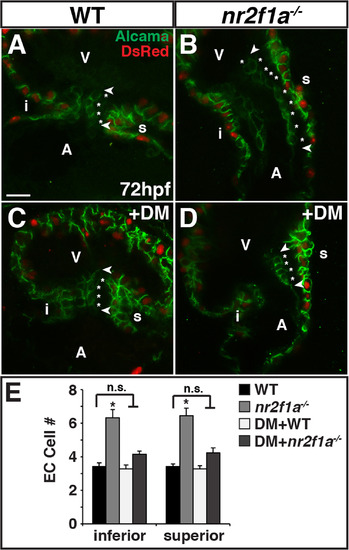
Nr2f1a functions upstream of Bmp signaling to restrict ECs. (A-D) IHC of hearts from myl7: DsRed-NLS WT, nr2f1a mutant, WT DM-treated, and nr2f1a mutant DM-treated embryos for Alcama (green) and DsRed (myocardial nuclei – red). Images are frontal views of confocal stacks. Length of ECs (arrowheads). Individual EC cells (asterisks). Scale bar indicates 10 µm in A-D. (E) Mean EC number from inferior and superior valve sides in WT (n = 12), nr2f1a mutant (n = 9), WT DM-treated (n = 11), and nr2f1a mutant DM-treated (n = 13) embryos. PHENOTYPE:
|
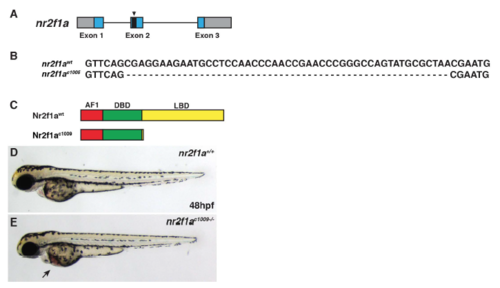
Generation of second nr2f1a deletion allele. (A) Schematic of deletion in nr2f1a exon 2 induced from the CRISPR/Cas9. (B) Sequence of the 49-bp deletion in the nr2f1aci1009 mutant allele. (C) Schematic indicating the predicted truncation caused by the out of frame deletion. (D,E) WT and nr2f1a ci1009-/- mutant embryos at 48 hpf. Arrow indicates blood pooling and edema on yolk. PHENOTYPE:
|
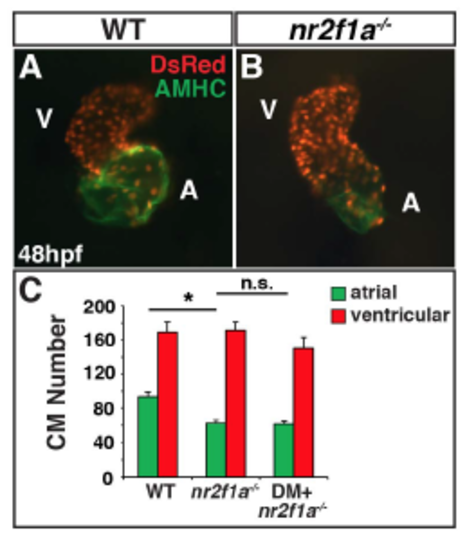
Dorsomorphin does not restore AC number in nr2f1a mutants. (A,B) IHC of hearts from WT sibling and nr2f1a mutant myl7:DsRed-NLS embryos. (C) Graph depicting AC and VC number from WT sibling (n=12), nr2f1a mutant (n=14), and nr2f1a mutant DM-treated (n=15) embryos. Cardiomyocyte numbers for WT sibling and nr2f1a mutants are the same as indicated in Fig. 2I. Asterisks indicated statistically significant difference (P<0.05) using Student’s t-test. PHENOTYPE:
|
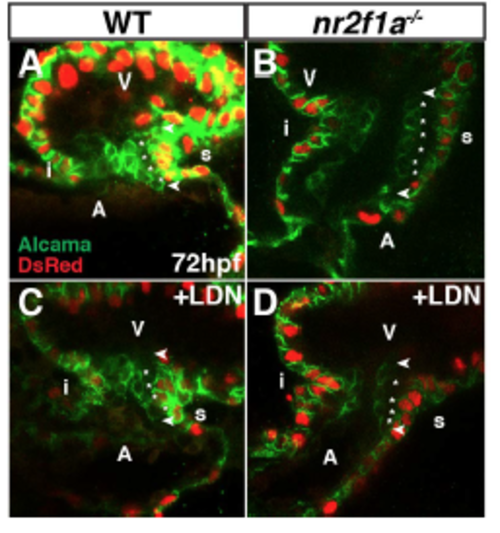
LDN193189 treatment reduces EC cell number in nr2f1a mutants. (A-D) IHC of hearts from myl7:DsRed-NLS WT, nr2f1a mutant, WT LDN-treated, and nr2f1a mutant LDNtreated embryos for Alcama (green) and DsRed (myocardial nuclei – red). Images are frontal views of confocal stacks. Length of ECs (arrowheads). Individual EC cells (asterisks). n ³ 4 examined per condition. |
Reprinted from Developmental Biology, 434(1), Duong, T.B., Ravisankar, P., Song, Y.C., Gafranek, J.T., Rydeen, A.B., Dohn, T.E., Barske, L.A., Crump, J.G., Waxman, J.S., Nr2f1a balances atrial chamber and atrioventricular canal size via BMP signaling-independent and -dependent mechanisms, 7-14, Copyright (2017) with permission from Elsevier. Full text @ Dev. Biol.