
- Title
-
Glioblastoma and glioblastoma stem cells are dependent on functional MTH1
- Authors
- Pudelko, L., Rouhi, P., Sanjiv, K., Gad, H., Kalderén, C., Höglund, A., Squatrito, M., Schuhmacher, A.J., Edwards, S., Hägerstrand, D., Berglund, U.W., Helleday, T., Bräutigam, L.
- Source
- Full text @ Oncotarget
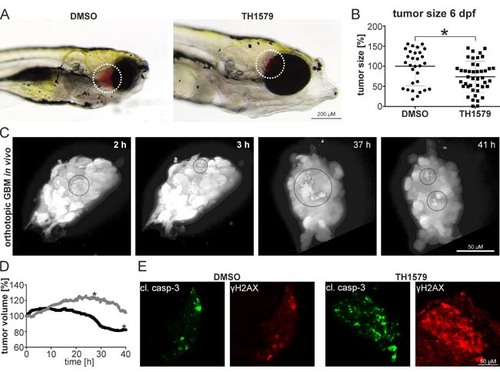
MTH1 inhibitors target GBM and GBM stem cells in vivo. GBM #18-CMV-LUC cell enriched for the CD133+ population have been orthotopically injected into zebrafish embryos. 6 days post injection, embryos exposed to 50 µM TH1579 displayed smaller tumors A. Quantification by luminescence measurements in single embryos showed 26.4 % smaller tumors in TH1579 treated embryos (n = 43) compared to DMSO controls (n = 31; p = 0.011) B. Still images of real-time light sheet microscopy on orthotopic xenotransplants exposed to 50 µM TH1579 apoptotic cells encircled C. Determination of tumor volume of xenotransplant. Grey circle: DMSO control, black circle TH1579 treated (tumor shown in (C). The asterisks mark the time-point when the transplants started leaving the focal plane D. Immunocytochemistry on cleaved caspase as well as y-H2AX in orthotopic xenotransplants treated for 5 days with 50 µM TH1579 or DMSO E. |
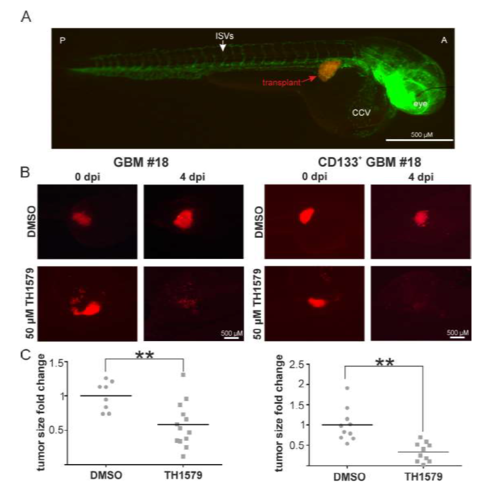
non-orthotopic xenotransplantation GBM cells were injected into the perivitelline space of two day old zebrafish embryos (A), which were subsequently exposed to 50 μM TH1579. The fold change of the tumor area was quantified 4 days after transplantation (B,C). Fold change upon TH1579 exposure for #18: 0.58 ± 0.32 compared to DMSO control, n = 13; p = 0.002 and for CD133+: 0.34 ± 0.24 compared to DMSO control; n = 11; p = 0.005). Dpi: days post injection |