
- Title
-
Conservation of structure and function in vertebrate c-FLIP proteins despite rapid evolutionary change
- Authors
- Sakamaki, K., Iwabe, N., Iwata, H., Imai, K., Takagi, C., Chiba, K., Shukunami, C., Tomii, K., Ueno, N.
- Source
- Full text @ Biochem Biophys Rep
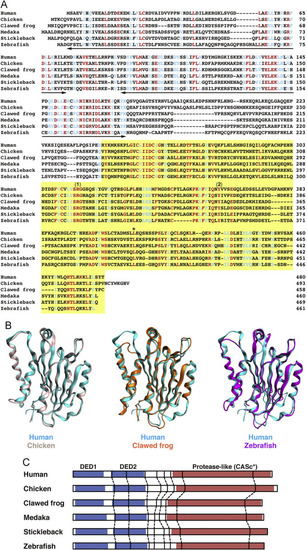
Analysis of the protein structures of c-FLIP proteins. (A) Multiple alignment of amino acid sequences of human, chicken, African clawed frog, medaka, stickleback, and zebrafish c-FLIP proteins. Identical and similar amino acids in all family members are indicated by red and blue, respectively. The two bold lines and a yellow box indicate the DED motif and the protease-like CASc* domain, respectively. The numbers (1) and (2) shown above the sequences indicate the crucial arginine and tyrosine amino acid residues, which are the cause of the deactivation of the protease activity [8], and an asterisk indicates the conserved leucine residue. (B) Structural superposition of human c-FLIP and non-mammalian c-FLIP proteins. Structural models of the CASc* domain of chicken (light pink), clawed frog (orange), and zebrafish (magenta) c-FLIP proteins were computationally generated and superimposed with the CASc* domain of human c-FLIP (cyan, PDB ID: 3H13). (C) Comparison of the exon-intron organization of the CFLAR genes. The splice junction sites of the CFLAR/c-FLIP genes in vertebrates are indicated by vertical lines. Their positions were defined by the comparison of the respective genomic and cDNA sequences from the species listed in Table A2. The regions corresponding to two DED motifs and a CASc* domain are indicated by blue and red boxes, respectively. |
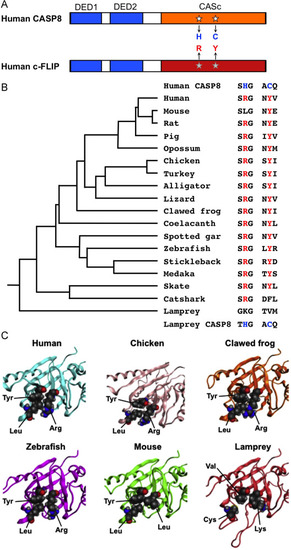
The specified amino acid substitutions of the CASc domain and their evolutionary conservation. (A) A schematic diagram of human CASP8 and c-FLIP proteins. Two DED motifs, a CASc protease domain, and a CASc* protease-like domain are indicated by boxes, respectively. White stars indicate the position of the essential amino acid residues, histidine (H) and cysteine (C) for the catalytic dyad formation in CASP8, whereas the gray stars indicate arginine (R) and tyrosine (Y) of c-FLIP positionally corresponding to two amino acid residues of CASP8, and are also coincident with positions (1) and (2), as shown in Fig. 1A. (B) A summary of critical amino acid residues of c-FLIP proteins conserved in vertebrates. Both the arginine (R) and tyrosine (Y) residues are evolutionarily conserved in most bony vertebrates. In the mouse c-Flip protein, the arginine residue is exceptionally changed to leucine. In the fish lineage, a phenylalanine (F) residue instead of tyrosine is present in the catshark whereas both lysine (K) and valine (V) residues are present at these two critical positions in the lamprey. A taxonomic tree of the species shown at the left was generated based on the previous study [70]. (C) Closeup views of the pseudocatalytic triad of c-FLIP proteins. The arginine, tyrosine, and leucine residues, which are shown in spheres, in human, chicken, clawed frog, and zebrafish c-FLIP proteins are brought close together in the three-dimensional shape forming a triad. In the lamprey, c-FLIP includes lysine, valine, and cysteine residues instead of the conserved amino acids, resulting in the failure of the triad formation. As mouse c-FLIP has replaced the arginine residue with leucine (L), there is little interaction with another leucine. The gray, red, and blue spheres indicate C, O, and N atoms, respectively. |
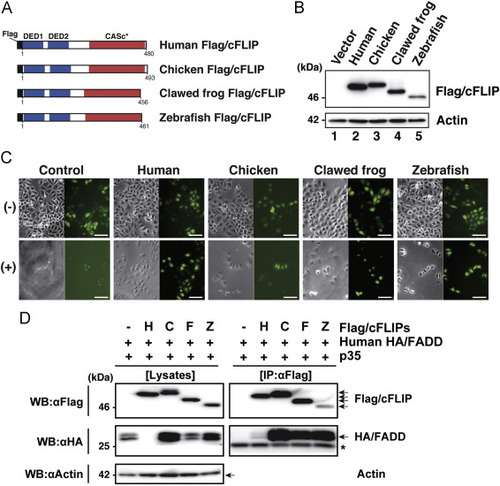
Assessment of the anti-apoptotic activity of the c-FLIP subfamily proteins. (A) The protein structure of Flag-tagged non-mammalian c-FLIP proteins consisting of two DED motifs and a CASc* protease-like domain. (B) Immunoblot analysis of non-mammalian c-FLIP proteins. The empty vector, pCMV-Flag/HsFLIP, pME18S-Flag/GgFLIP, pME18S-Flag/XlFLIP, or pME18S-Flag/DrFLIP were transiently transfected into HeLa cells. After culturing for 48 h, transgene products were analyzed by immunoblotting with an anti-Flag antibody. (C) Cytological analysis of transfectants expressing non-mammalian c-FLIP proteins. HeLa cells expressing Venus with or without human, chicken, clawed frog, and zebrafish c-FLIP were incubated in the presence (lower panels) or absence (upper panels) of anti-Fas antibody and CHX for 8 h, and examined for viability by monitoring Venus-positive cells. Both phase-contrast and fluorescence images in the same field were captured under the microscope. Scale bars represent 100 μm. (D) Co-immunoprecipitation and immunoblot analysis of physical interactions between non-mammalian c-FLIP proteins and human FADD. Human HEK293 cells were co-transfected with pME18S-HA/hFADD in conjunction with pME18S empty vector, pCMV-Flag/HsFLIP, pME18S-Flag/GgFLIP, pME18S-Flag/XlFLIP, or pME-Flag/DrFLIP. Baculovirus p35 was introduced into all transfected cells to prevent cell death. After 2 days of cultivation, transfected cells were harvested and lysed in lysis buffer. The cell lysates were immunoprecipitated with an anti-FLAG M2 affinity gel. Coimmunoprecipitates and aliquots of cell lysates were examined by immunoblot analysis with anti-Flag, anti-HA, and anti-actin antibodies, respectively. An asterisk indicates immunoglobulin light-chain. Abbreviations: H, human; C, chicken; F, clawed frog; Z, zebrafish; IP, immunoprecipitation; WB, western immunoblotting. |
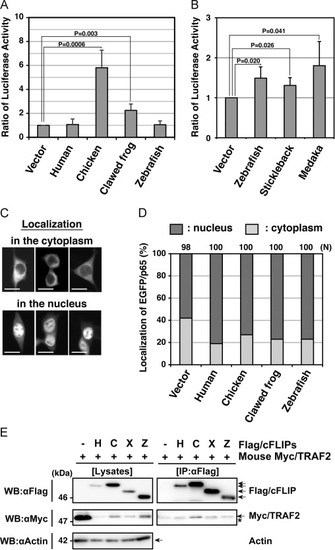
Functional analyses of non-mammalian c-FLIP proteins on NF-κB activation ability. (A, B) Enzymatic analysis of NF-κB activation induced by non-mammalian c-FLIP proteins. The empty vector or plasmids carrying c-FLIP were transiently co-transfected with pNFκB-Luc and pRL-TK into HEK293 cells, and cultured for 48 h. NF-κB activation was analyzed by measuring enzyme activities of dual luciferases produced in transfected cells using a luminometer. Data are presented as the means and standard deviations of samples counted from three independent experiments. The statistically-significant difference between two groups was evaluated by Student’s t-test. (C) Cytological analysis of a NF-κB component, p65, in cells expressing c-FLIP. HEK293 cells were transiently transfected with an empty vector or plasmids carrying c-FLIP together with pEGFP/p65, and cultured for 24 h. The localization of EGFP/p65 proteins in transfected cells was analyzed by fluorescence microscopy. Typical patterns of subcellular localization of EGFP/p65: EGFP/p65 normally localizes in the cytoplasm (upper panels), but it translocates into the nucleus when the NF-κB signaling pathway undergoes activation (lower panels) [35]. Scale bars indicate 20 μm. (D) A summary of cytological analyses on the translocation of EGFP/p65. Within each field, positive cells (dark gray) and negative cells (light gray) for EGFP/p65 translocation were counted under the fluorescent microscope and percentages of total were calculated. N indicates the total number of transfected cells examined in four independent experiments. (E) Co-immunoprecipitation and immunoblot analysis of physical interactions between non-mammalian c-FLIP proteins and mouse TRAF2. HEK293 cells were transfected with either pCMV-Flag/HsFLIP, pME18S-Flag/GgFLIP, pME18S-Flag/XlFLIP, pME18S-Flag/DrFLIP, or control vector in combination with pME18S-Myc/TRAF2. Forty-eight hours after transfection, cells were lysed and the c-FLIP complex was immunoprecipitated from whole cell lysates with an anti-Flag antibody. Samples were analyzed alongside aliquots of the cell lysates by immunoblotting with anti-Flag, anti-Myc, and anti-actin antibodies, respectively. An asterisk indicates immunoglobulin light-chain. Abbreviations: H, human; C, chicken; F, clawed frog; Z, zebrafish; IP, immunoprecipitation; WB, western immunoblotting. |
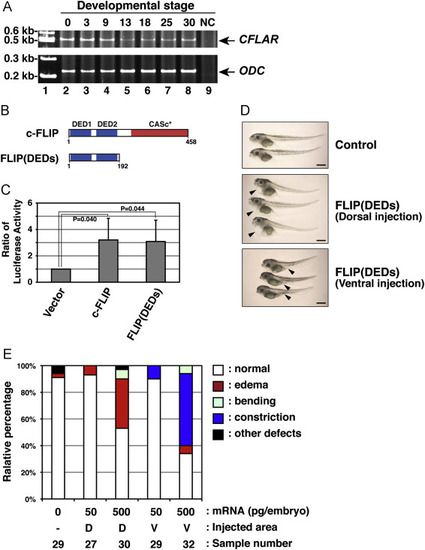
Irregular development of X. laevis embryos expressing a c-FLIP mutant. (A) The expression profile of African clawed frog CFLAR transcripts during embryogenesis. Total RNAs isolated from X. laevis embryos, which were collected at indicated stages (lanes 2–8), was analyzed by RT-PCR. PCR products amplified with primers specific for CFLAR (upper panel) and ODC (lower panel) were resolved by acrylamide-gel electrophoresis. Molecular weight markers were run in lane 1, and a negative control (NC) with no polymerase was run in lane 9. Arrows indicate the expected molecular weights of the CFLAR and ODC PCR products, respectively. (B) The structure of a truncated c-FLIP mutant, FLIP(DEDs), consisting of only two DED motifs. (C) Effect of a FLIP(DEDs) mutant on NF-κB activation. The empty vector or plasmids encoding intact or truncated forms of clawed frog c-FLIP were transiently co-transfected with pNFκB-Luc and pRL-TK into HEK293 cells. After 48 h in cell culture, NF-κB activation was analyzed by measuring enzyme activities of dual luciferases produced in transfected cells using a luminometer. Data are presented as the means and standard deviations of samples counted from three independent experiments. The statistically-significant difference between two groups was evaluated by Student’s t-test. (D) Morphological analysis of embryos expressing FLIP(DEDs). X. laevis embryos were injected without (upper panel) or with mRNA encoding FLIP(DEDs), at the equatorial area of two dorsal (middle panel) or two ventral (lower panel) blastomeres at the four-cell-stage. Images of the developing embryos were acquired at stage 45. Arrowheads indicate the edema and abdominal constriction of the injected embryos, respectively. Scale bars indicate 1 mm. (E) A summary of the phenotypic data presented in (D). Embryos displaying edema (red), abdominal constriction (dark blue), bending (light blue), and other defects (black) were counted under the microscope. Data represent the percentages calculated from five independent experiments. Abbreviations: D, dorsal; V, ventral. |
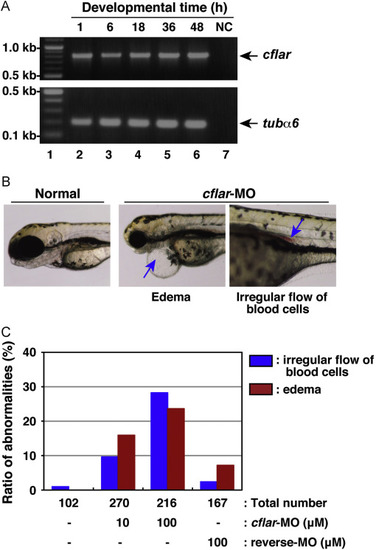
Developmental anomalies in zebrafish embryos with knockdown of cflar transcripts. (A) The expression profile of zebrafish cflar transcripts during embryogenesis. Total RNAs isolated from embryos, which were collected at 1, 6, 18, 36, and 48 h after fertilization (lanes 2–6), was analyzed by RT-PCR. PCR products amplified with primers specific for cflar (upper panel) and tubulin α6 (tubα6) (lower panel) were resolved by agarose-gel electrophoresis. Molecular weight markers were run in lane 1, and a negative control (NC) with no template DNA was run in lane 7. Arrows indicate the expected positions of the cflar and tubα6 PCR products, respectively. (B) Morphological analysis of developing embryos subjected to morpholino oligonucleotide (MO) injection. Fertilized eggs were injected with an antisense MO for cflar, cflar-MO and their development was monitored under the microscope. Images of the developing embryos were acquired at three days later. The resulting abnormal phenotypes consisted of edema (middle panel) and a cluster of blood cells in the vessel (right panel), indicated by an arrow. (C) A summary of the phenotypic data presented in (B). Embryos displaying the edema (red) or irregular flow of red blood cells (blue) were counted under the microscope. Data represent the percentages calculated from four independent experiments. PHENOTYPE:
|