
- Title
-
Genetic and neuronal regulation of sleep by neuropeptide VF
- Authors
- Lee, D.A., Andreev, A., Truong, T.V., Chen, A., Hill, A.J., Oikonomou, G., Pham, U., Hong, Y.K., Tran, S., Glass, L., Sapin, V., Engle, J., Fraser, S.E., Prober, D.A.
- Source
- Full text @ Elife
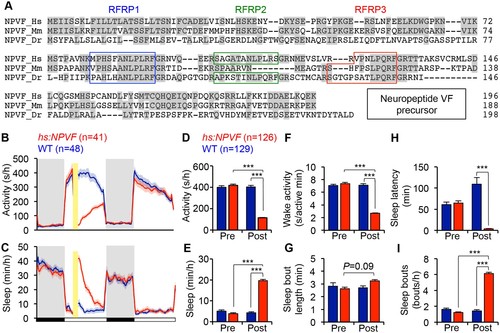
NPVF overexpression decreases locomotor activity and increases sleep. (A) Multiple sequence alignment of human (Hs), mouse (Mm), and zebrafish (Dr) NPVF preproproteins. Colored boxes demarcate identified or predicted mature peptide sequences. Note that the mouse NPVF protein lacks RFRP2. (B–I) NPVF overexpression decreased locomotor activity (B,D) and increased sleep (C,E) in transgenic animals compared to WT siblings and to pre-HS. Yellow bar indicates heat shock. Pre- and Post-HS data is calculated for the day of HS. White and black bars under behavioral traces indicate day (14 h) and night (10 h), respectively. NPVF overexpression decreased wake activity (F), decreased sleep latency (time to first sleep bout following lights on in the morning Pre-HS, or following HS in post-HS measurement) (H) and increased sleep bout number (I), and also caused a trend of increased sleep bout length (G). Mean ± SEM from one representative experiment (B,C), or three pooled experiments (D–I) are shown. n = number of animals. ***p<0.0001 by Two-way ANOVA with Holm-Sidak test. PHENOTYPE:
|
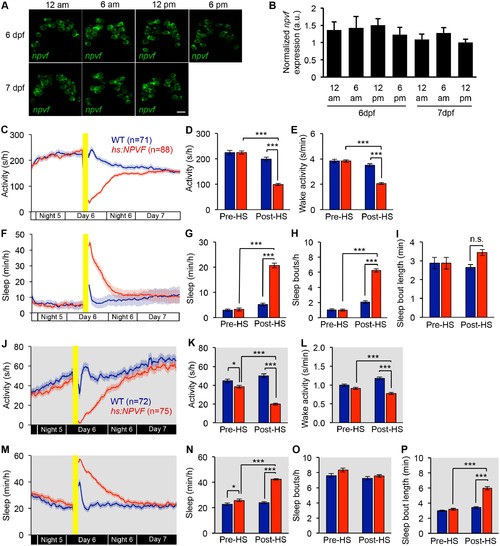
npvf expression levels do not vary in a circadian manner and NPVF overexpression-induced sleep does not require entrained behavioral circadian rhythms. (A,B) Larval zebrafish were raised on a 14:10 h light:dark cycle at 28.5°C with lights on at 9 a.m. and off at 11 p.m. (A) FISH using a npvf-specific probe in animals fixed at the indicated times revealed no obvious circadian pattern of npvf expression. Representative images are shown. (B) At the indicated time points, total RNA was collected from 20-pooled larvae, and npvf mRNA levels were quantified by qPCR normalized to the reference gene ribosomal protein l13a, and then normalized to the sample with the lowest npvf expression level. Results from six combined experiments are shown. There is no significant difference in npvf mRNA level at any time point (p>0.05 by One-way ANOVA). (C–I) Zebrafish larvae raised and tested in constant light (LL) do not exhibit circadian locomotor activity or sleep rhythms (C,F). NPVF overexpression decreased locomotor activity (C,D) and increased sleep (F,G). This phenotype was due to an increase in the number of sleep bouts (H) and was associated with a decrease in wake activity (E). (J–P) Zebrafish larvae raised and tested in constant dark (DD) do not exhibit circadian locomotor activity or sleep rhythms (J,M). NPVF overexpression decreased locomotor activity (J,K) and increased sleep (M,N). This phenotype was due to an increase in the length of sleep bouts (P) and was associated with a decrease in wake activity (L). Yellow bars indicate heat shock. White and black bars below line graphs indicate developmental time periods. Bar graphs represent mean ± SEM for twelve hours pre- and post-HS. n = number of animals. n.s. = not significant. *p<0.05, ***p<0.005 by Two-way ANOVA with Holm-Sidak post-hoc test. |
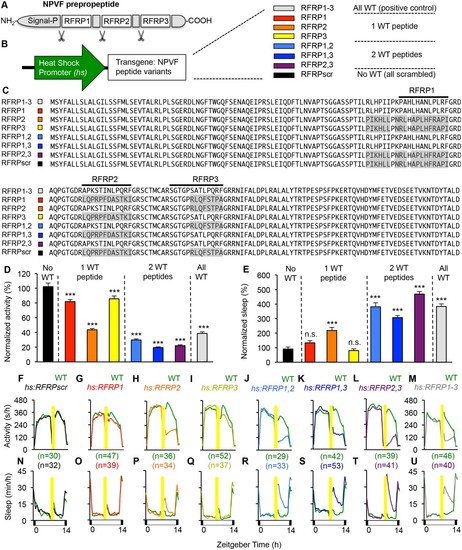
Individual RFRP peptides act synergistically to promote sleep. (A) Schematic diagram of the NPVF preproprotein and its three RFRP peptides. (B) Eight heat shock-inducible transgenes containing all possible combinations of one, two or three scrambled RFRP peptides tested. Colors correspond to those used in panels (C–U). (C) Amino acid sequences of zebrafish Tg(hs:NPVF) transgenes containing single or multiple scrambled RFRP peptides. RFRP peptide sequences are predicted based on conservation with peptides isolated in other species and on the location of glycine amidation signals and lysine or arginine endoproteolytic cleavage sites. The C-terminus of each predicted peptide contains a LPXRF motif, where X = L or Q. Gray shading indicates scrambled sequences. Daytime activity (D) and sleep (E) of transgenic animals normalized to their WT siblings following afternoon heat-shock-induced transgene overexpression are shown as mean ± SEM for two pooled experiments, with at least 64 animals per genotype. Examples of activity and sleep data for each transgene are shown in (F–U). Yellow bars indicate heat shock. White and black bars under behavioral traces indicate day (14 hr) and night, respectively. n = number of animals. n.s. = not significant, ***p<0.0001 by One-way ANOVA compared to scrambled NPVF peptide control (black) using Dunnett’s multiple comparison test. PHENOTYPE:
|
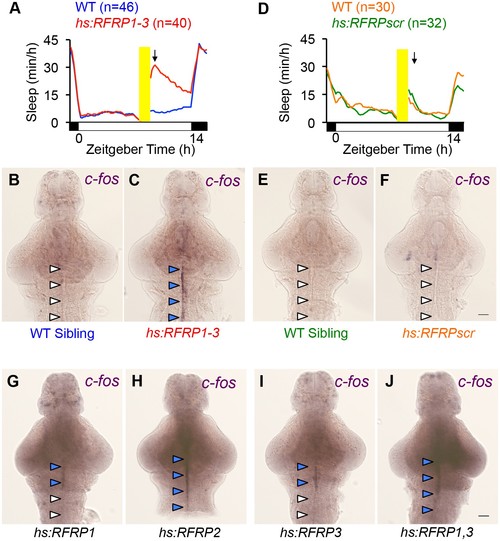
c-fos expression correlates with overexpression of RFRP peptides that induce sleep. One hour after heat-shock, sleep is significantly increased in Tg(hs:RFRP1-3) animals compared to their WT siblings (A, arrow) but there is no effect on sleep in Tg(hs:RFRPscr) animals compared to their WT siblings (D, arrow). We assayed neuronal activity at this time point in animals overexpressing different RFRP peptides by performing c-fos ISH. In animals overexpressing RFRP1-3, we observed prominent c-fos expression along the brain ventricular lining from the hypothalamus to the hindbrain (C), four blue arrowheads) that was absent in WT siblings (B, four white arrowheads). Overexpression of specific RFRP peptides affected c-fos expression in a manner that correlated with their effects on behavior (Figure 2E). No c-fos expression was observed in animals overexpressing RFRPscr, in which all 3 RFRP peptides are scrambled (F, four white arrowheads), weak c-fos expression was observed in animals overexpressing either RFRP1 or RFRP3 (G,I, 2 blue and two white arrowheads), and strong c-fos expression was observed in animals overexpressing RFRP2, or RFRP1 and RFRP3 (H,J, four blue arrowheads), similar to overexpression of RFRP1-3 (C). Yellow bars indicate heat shock. White and black bars under behavioral traces indicate day (14 h) and night, respectively. Scale: 50 μm. |
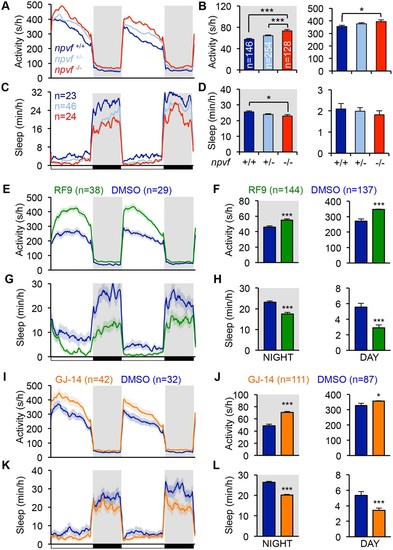
Genetic and pharmacological inhibition of NPVF signaling increases locomotor activity and decreases sleep. (A–D) npvf -/- animals are more active during the day and night (A,B), and sleep less at night (C,D) compared to their npvf +/+ siblings. npvf +/- animals show an intermediate sleep phenotype that is not significantly different than npvf -/- siblings. (E–L) Pharmacological inhibition of NPVF signaling by the NPFFR1/2 antagonists RF9 and GJ-14 increased locomotor activity (E,F,I,J) and decreased sleep (G,H,K,L) during the day and night compared to DMSO control-treated siblings. Mean ± SEM from one representative experiment (A,C,E,G,L,K), three pooled experiments (F,H,J,L), or six pooled experiments (B,D) are shown. White and black bars under behavioral traces indicate day (14 h) and night (10 h), respectively. n = number of animals. *p<0.05; ***p<0.005 by One-way ANOVA with Holm-Sidak test (B,D) and Student’s t-test (F,H,J,L). PHENOTYPE:
|
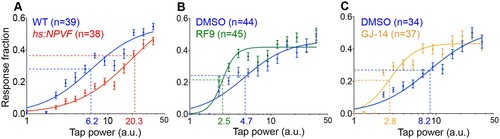
NPVF signaling affects arousal threshold. Representative stimulus response curves generated using a mechano-acoustic stimulus in Tg(hs:NPVF) animals and their WT siblings following heat shock (A), in RF9 and DMSO vehicle treated WT larvae (B), and in GJ-14 and DMSO vehicle treated WT larvae (C). Each data point indicates mean ± SEM. Dashed lines mark the ETP50 value for each genotype or drug treatment. (A) Tg(hs:NPVF) animals had an ETP50 value of 20.3 vs. 6.2 for WT siblings (227% increase, F(1,834)=16.05, p<0.0001 by extra sum-of-squares F test). (B) RF9-treated animals had an ETP50 of 2.5 vs. 4.7 for DMSO-treated siblings (46% decrease, F(1,834)=24.19, p<0.0001 by extra sum-of-squares F test). (C) GJ14-treated animals had an ETP50 of 2.8 vs. 8.2 for DMSO-treated siblings (65% decrease, F(1,834)=49.47, p<0.0001 by extra sum-of-squares F test). n = number of animals. PHENOTYPE:
|
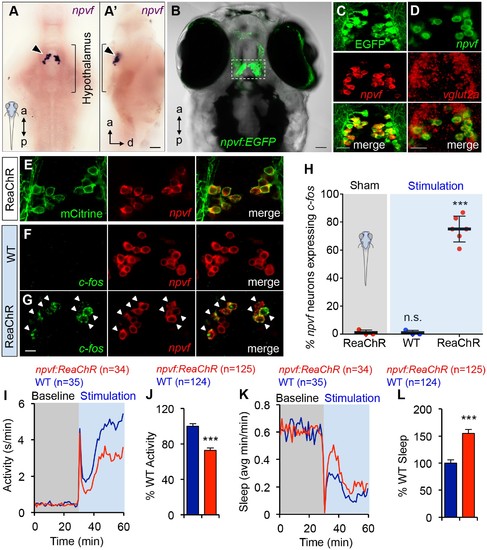
Optogenetic stimulation of NPVF neurons promotes sleep. (A) ISH of NPVF neurons (arrowhead) in a 5-dpf brain. Ventral (A) and side (A’) views are shown. a, anterior; p, posterior; d, dorsal. (B) Live image of a 5-dpf Tg(npvf:EGFP) zebrafish with brightfield and EGFP overlay. White box demarcates region shown in subsequent images. (C) EGFP and npvf coexpression shown using EGFP immunohistochemistry (IHC) and npvf FISH in a 43.4 µm thick image stack. (D) npvf and vglut2a coexpression shown using FISH in a 2.7 µm thick image stack. (E) mCitrine and npvf coexpression in a Tg(npvf:ReaChR-mCitrine) zebrafish shown using EGFP IHC and npvf FISH in a 2.7 µm thick image stack. (F–H) Tg(npvf:ReaChR-mCitrine) and WT siblings were exposed to the same blue light stimulus used in (I–L). (G,H) 75.1 ± 4.1% of NPVF neurons expressed c-fos in Tg(npvf:ReaChR-mCitrine) animals (***p<0.0001; One-way ANOVA with Dunnett’s test to sham), in contrast to similarly stimulated WT siblings (~1%, n.s., not significant) (F,H), or to sham-treated transgenic animals (~1%). (I–L) Optogenetic stimulation of NPVF neurons decreased locomotor activity and increased sleep in transgenic animals compared to WT siblings. Data are from one representative experiment (I,K), or three pooled experiments (J,L). Activity and sleep of transgenic animals are normalized to WT and represented as mean ± SEM (J,L). n = number of animals. ***p<0.0001 by Student’s t-test. Scale: 50 μm (A,B), 20 μm (C,D), 10 μm (G). See also Table 1 and Figure 5—figure supplements 1,2. |

NPVF neuronal projections. (A) A 101 μm thick maximum intensity projection image of a 5-dpf Tg(npvf:EGFP) brain. Imaging plane is denoted in blue in schematic at bottom left. Bracketed areas are magnified in (B,C). NPVF neurons have dense projections within the hypothalamus (red arrowheads) (B), sparse projections to the forebrain (A,A’) and tectum (A’), projections that converge on the raphe nuclei in the hindbrain (green arrowhead) (C), and sparse projections that extend down the spinal cord (yellow arrowhead) (A). Scale: 50 μm (A), 20 μm (B,C). Te = telencephalon; TeO = tectum; Hyp = hypothalamus; MB = midbrain; Hb = hindbrain; A = anterior; p=posterior; L = lateral; D = dorsal; V = ventral. |
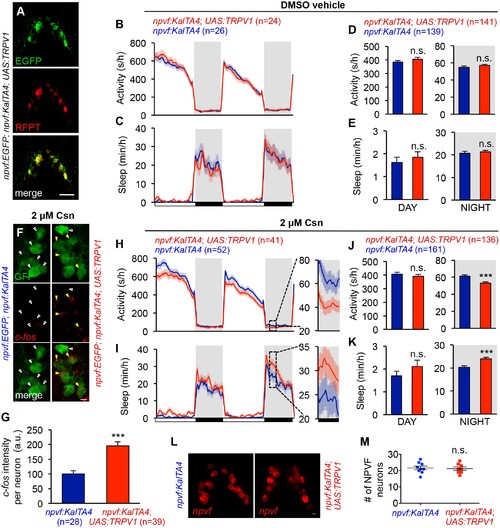
Chemogenetic stimulation of NPVF neurons promotes sleep. (A) TRPV1-TagRFP-T expression in NPVF neurons of a 5-dpf Tg(npvf:EGFP);Tg(npvf:KalTA4);Tg(UAS:TRPV1-TagRFP-T) animal shown using IHC for EGFP and TagRFP-T in a 1.1 μm thick image stack. Locomotor activity and sleep in 6–8-dpf Tg(npvf:KalTA4) and Tg(npvf:KalTA4);Tg(UAS:TRPV1-TagRFP-T) siblings treated with DMSO vehicle (B–E) or 2 μM Csn (H–K) starting at 100-hpf until the end of the experiment. Mean ± SEM for one representative experiment (B,C,H,I) or 4 (D,E) or 5 (J,K) pooled experiments are shown. White and black bars under behavioral traces indicate day (14 h) and night (10 h), respectively. (F) Following 48 hr of treatment with 2 μM Csn, 100% more c-fos expression is observed in NPVF neurons of 6-dpf Tg(npvf:EGFP);Tg(npvf:KalTA4);Tg(UAS:TRPV1-TagRFP-T) animals than their Tg(npvf:EGFP);Tg(npvf:KalTA4) siblings, shown using EGFP IHC and c-fos FISH in a representative 2.6 µm thick image stack, and quantified in (G). Yellow and white arrowheads indicate NPVF neurons with and without bright c-fos puncta, respectively. (L) npvf ISH in a 2.4 µm thick image stack of animals treated with 2 μM Csn for 48 h. There was no significant difference in the number of EGFP-positive neurons between Tg(npvf:EGFP);Tg(npvf:KalTA4) and Tg(npvf:EGFP);Tg(npvf:KalTA4);Tg(UAS:TRPV1-TagRFP-T) siblings, assayed using EGFP IHC. Data presented as mean ± SEM. n = number of animals. n.s. = not significant. **p<0.01,***p<0.005 by Student’s t-test. Scale: 20 μm (A), 5 μm (F,L). |
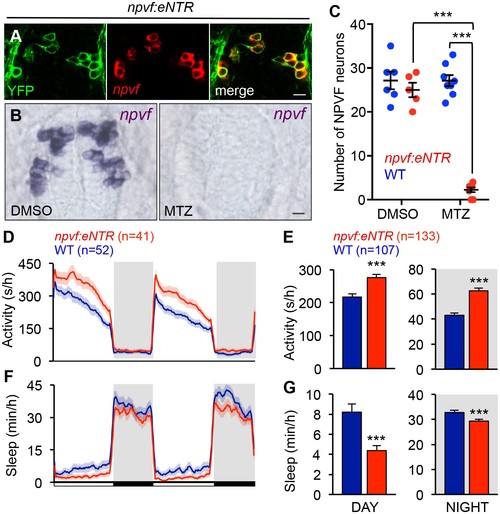
Chemogenetic ablation of NPVF neurons promotes wakefulness. (A) mTagYFP and npvf coexpression in a 5-dpf Tg(npvf:mTagYFP-T2A-eNTR) zebrafish shown using YFP IHC and npvf FISH. (B–G) Tg(npvf:mTagYFP-T2A-eNTR) and WT siblings were treated with 5 mM MTZ for 60 h. Behavior was monitored from 6 to 8 dpf. (B) npvf ISH in 7-dpf Tg(npvf:mTagYFP-T2A-eNTR) zebrafish treated with DMSO or MTZ. Scale: 10 μm. NPVF neuronal loss is quantified as mean ± SEM in (C). (D–G) Transgenic animals treated with MTZ were more active (D,E) and slept less (F,G) than their identically treated WT siblings. Mean ± SEM for one representative experiment (D,F), or three pooled experiments (E,G) are shown. White and black bars under behavioral traces indicate day (14 h) and night (10 h), respectively. n = number of animals. ***p<0.005 by Two-way ANOVA with Holm-Sidak test (C) or Student’s t-test (E,G). See also Table 1 and Figure 6—figure supplement 1. |
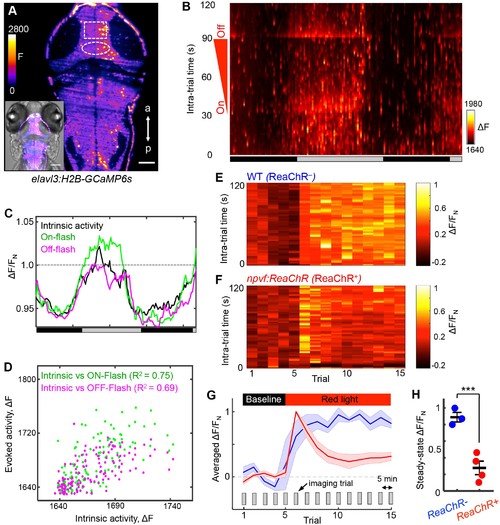
NPVF neuronal activation induces tectal neuronal activity levels similar to normal sleep. (A) Representative 2P-SPIM image of a 6 dpf Tg(elavl3:H2B-GCaMP6s) animal, ~70 μm from the dorsal surface. The white box indicates the region of the optic tectum analyzed in subsequent panels. The white oval indicates the location of NPVF neurons. The inset shows a GCaMP6s image superimposed on a brightfield image. Scale: 50 μm. (B) Neural activity, recorded as GCaMP6s fluorescence, of a representative animal during >36 h of imaging in DD. Imaging sessions were performed for 2 min at 1 Hz every 15 min. No light perturbation was applied during the first 31 s of each trial to record intrinsic brain activity. To assess arousal, a red light was turned on at t = 32 s, gradually increased in intensity until t = 93 s, then turned off. We observed increased neural activity at light onset and offset, with habituation in between. Signal is calculated as ΔF = F – F0 where F0 = lowest signal measured during the recording period. (C) Normalized neural activity, plotted as function of time, smoothed over a 5-trial sliding window, and averaged over 5–25, 32–37, and 93–98 s time windows, representing intrinsic, On-flash evoked response and Off-flash evoked response, respectively. Signal is normalized by FN = average intrinsic activity during subjective day. (D) Correlation of evoked activity to intrinsic activity. (E,F) During subjective day, animals were imaged for 15 trials, each consisting of 2 min of imaging at 1 Hz every 5 min. Conditions were identical to those used in (B). Representative neural activity recorded for individual ReaChR- and ReaChR+ animals are shown. Optogenetic stimulation began after trial 5. Signal for each animal is calculated with baseline F0 = averaged signal over the first five trials, then normalized by FN = peak of signal after red light is turned on, for the same animal. (G) Mean ± SEM of the normalized neural activity for four Tg(elavl3:H2B-GCaMP6s); Tg(npvf:ReaChR-mCitrine) larvae (red) and three Tg(elavl3:H2B-GCaMP6s) siblings (blue). (H) Mean ± SEM steady-state normalized neural activity after optogenetic activation, averaged over trials 10–15, shows 68% lower activity for ReaChR+ animals than their ReaChR- siblings (p<0.001, two-sample t-test). See also Figure 7—figure supplements 1 and 2. |

Chemogenetic stimulation of NPVF neurons decreases neuronal activity at night. (A) Representative image of fluorescence signal from an optical plane ~70 μm from the dorsal surface of a Tg(elavl3:H2B-GCaMP6s) brain at 6 dpf. Scale bar = 100 μm. (B) Automatic segmentation of active neurons, represented by cyan dots, using PCA/ICA. Typically 500–800 active neurons were extracted per animal. Some false positives were extracted from skin auto-fluorescence, contributing about 5% of the total segmented cells, which did not significantly affect subsequent analysis. (C,D) Neural activity (as reported by GCaMP6s fluorescence in Tg(elavl3:H2B-GCaMP6s) animals), averaged over all segmented active neurons, during the day/night cycle for representative Tg(UAS:TRPV1-TagRFP-T) and Tg(npvf:KalTA4); Tg(UAS:TRPV1-TagRFP-T) animals. Animals were treated with 2 μM Csn starting at 4 dpf, and imaging began at 6 dpf. Imaging consisted of 2 min sessions at 1 Hz every 15 min for 20–24 hr. ΔF = F – F0, where the baseline F0 is determined as described in the Materials and methods. (E) Normalized neural activity for representative Tg(UAS:TRPV1-TagRFP-T) and Tg(npvf:KalTA4); Tg(UAS:TRPV1-TagRFP-T) animals is lower at night, consistent with increased sleep. Each animal’s activity was normalized to FN = average activity during the 2 day periods of the same animal. (F) Neural activity during the day, averaged across the 2 day periods. Tg(UAS:TRPV1-TagRFP-T) and Tg(npvf:KalTA4); Tg(UAS:TRPV1-TagRFP-T) animals had the same level of neural activity (p=0.86, two-sample t-test). (G) Comparison of normalized neural activity at night. The night value for each animal is normalized to FN = averaged activity during the day of the same animal. Tg(npvf:KalTA4); Tg(UAS:TRPV1-TagRFP-T) and Tg(UAS:TRPV1-TagRFP-T) animals had decreased neural activity at night (25% and 7%, p=0.022 and p=0.023, respectively, one-sample t-test). The larger difference between day and night activity for Tg(npvf:KalTA4); Tg(UAS:TRPV1-TagRFP-T) compared with Tg(UAS:TRPV1-TagRFP-T) animals (p=0.028, two-sample t-test) is consistent with the increased sleep at night observed upon chemogenetic activation of NPVF neurons (Figure 5—figure supplement 2). Black and white bars in (C–E) indicate day and night. Data for 1 (C–E) or 4 (F,G) animals of each genotype are shown. |

ZFIN is incorporating published figure images and captions as part of an ongoing project. Figures from some publications have not yet been curated, or are not available for display because of copyright restrictions. EXPRESSION / LABELING:
|