
- Title
-
Identify a Blood-Brain Barrier Penetrating Drug-TNB using Zebrafish Orthotopic Glioblastoma Xenograft Model
- Authors
- Zeng, A., Ye, T., Cao, D., Huang, X., Yang, Y., Chen, X., Xie, Y., Yao, S., Zhao, C.
- Source
- Full text @ Sci. Rep.
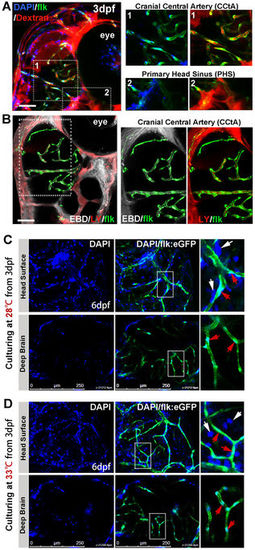
Imaging of functional BBB in 3dpf and 6dpf zebrafish. (A,B) The Dextran Texas Red (70,000 MW, 1 mg/ml), Evans Blue Dye (EBD, 961 MW, 5 mg/ml), Lucifer Yellow (LY, 457 MW, 4 mg/ml) and DAPI (350 MW, 1.5 mg/ml) were mixed and injected into the circulation of 3dpf flk:eGFP or flk:mCherry embryos (5 nl/fish, green indicating endothelial cells) from caudal vein (CV). Z-stack confocal living images of the cerebral capillaries and segmental capillaries (Fig. S2A) were obtained at 30–60 min after injection. (A, area1) Dextran and DAPI were restrained in cerebral capillaries (CCTA), but were leaked out from primary head Sinus (A, area2) and segmental capillaries (Fig. S2A). (B) CBD (white) and LY (red, pseudocolor) were restrained in CCTA (mCherry was pseudocolored as green). Areas in dotted boxes were magnified right. (C) DAPI was injected into the circulation of 6dpf embryos (maintained at 28 °C) from CV. Z-stack confocal living images were taken at 1 h post injection. White arrows indicating nucleus of host cells neighboring to vessels; Red arrows indicating endothelial nucleus. (D)DAPI was injected into the circulation of 6dpf embryos (normally maintained 3dpf zebrafish were shifted to 33 °C for 3days) from CV. Z-stack confocal living images were taken at 1 h post injection. White arrows indicating nucleus of host cells neighboring to vessels; Red arrows indicating endothelial nucleus. EXPRESSION / LABELING:
|
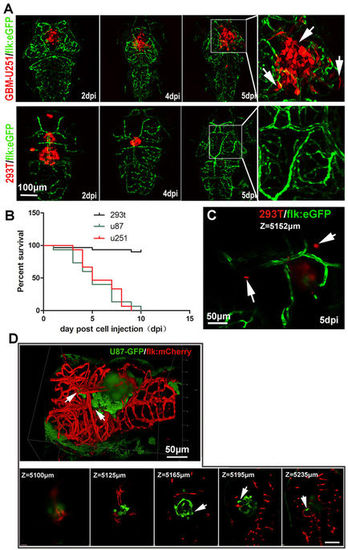
Establishment of GBM xenografts in flk:eGFP Casper zebrafish. (A,B) 200–500 GBM tumor cells (U87-RFP, U251-RFP) were intracranial implanted into 3dpf flk:eGFP Casper zebrafish and monitored by confocal microscope every 24 hours, 293T-RFP cells implantation was set as control. Areas in dotted boxes were magnified right, arrows indicating infiltrating tumor cells. (B) The survivorship curve of U87 and U251 tumor-bearing zebrafish and control 293 T injected zebrafish. (C) A high-resolution image of intracranially implanted 293t-RFP cells at 6dpf, arrows indicating the cell debris. (D) A reconstructed 3D image of a U87-GFP xenograft in the deep brain of flk:mCherry zebrafish at 6dpf, arrows indicating infiltrating tumor cells. Z-stack serial images show the depth of the GBM xenograft in zebrafish brain, arrows indicating infiltrating tumor cells. |
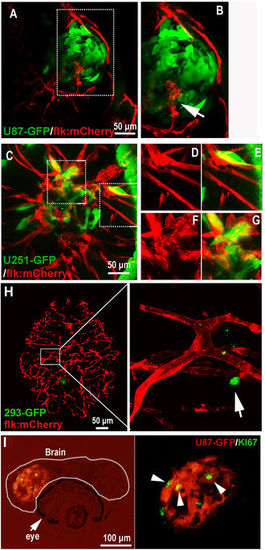
Active interaction between GBM xenografts and cerebral capillaries. (A,B) U87-GFP xenografts induced angiogenesis from neighboring host vessel within the tumor xenograft at 5dpi, area in dotted box was magnified in B, and arrow indicating the endothelial sprouts. (C–G) Tumor induced angiogenesis (F,G) and infiltrative tumor growth (D,E) of U251-GFP xenografts at 5dpi were detected in the zebrafish brain. (H) Representative image showing the 5dpi zebrafish brain with 293-GFP cells (arrow)(200–500 293-GFP cells were implanted into the brain of 3dpf zebrafish); implanted 293-GFP cells failed to survive in the brain parenchyma and cerebral capillaries were not affected by 293-GFP cells. (I) Immunostaining of U87 xenograft in zebrafish brain indicating the implanted tumor cells were proliferating (ki67+), arrowheads indicating the GFP+/ki67+ tumor cells in the xenograft in zebrafish. EXPRESSION / LABELING:
|
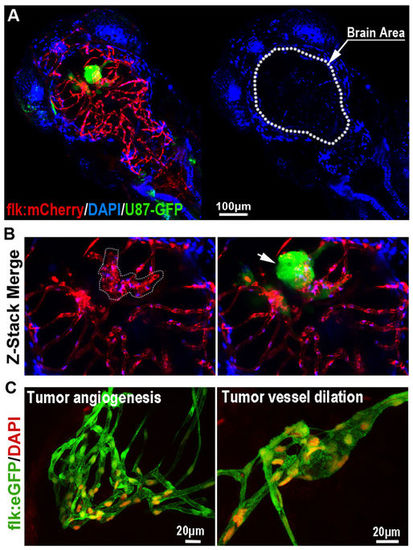
The Blood-brain Barrier is general not disturbed by GBM xenografts. (A) Z-stack confocal images showing the location of GFP-labeled GBM xenograft in a 6dpf zebrafish, and the dilation of tumor-related red cerebral capillaries. DAPI was injected into the zebrafish circulation 1 hour before taking the living image. Dotted line indicates the brain area. (B) Higher resolution image of the GBM xenograft showing the obvious vessel dilation and related endothelial proliferation (indicated by nucleus number) within the tumor (arrow). (C) DAPI was strictly restrained in the tumor vessels of GBM xenografts in 7dpf zebrafish brain. Endothelial nucleus of the GBM cerebral vessels were stained by DAPI (red, pseudo-color), no cells that outside of the vessels were stained, indicating the incapability of DAPI crossing the GBM vessels. |
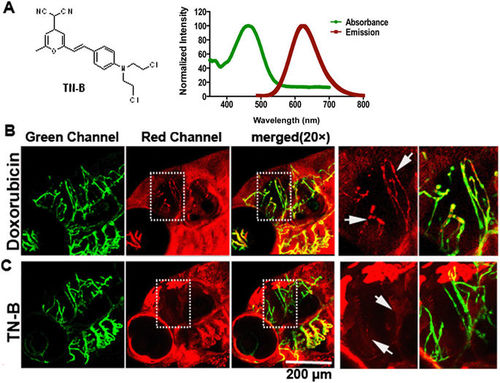
TN-B is capable of crossing the zebrafish BBB efficiently. Doxorubicin (Adriamycin®) and TN-B were injected into the circulation of 6dpf flk:eGFP zebrafish through caudal vein. Living images were obtained about 30 min after injection. (A) The structure of Nitrogen mustard based TN-B (left panel, A). The absorbance spectrum (green bold line) and emission spectrum (red bold line) of TN-B are shown (right panel, A). (B) Doxorubicin (Red Fluorescence) was completely restrained in cerebral capillaries, area in dotted box was magnified right, Doxorubicin was restrained in cerebral capillaries (arrows in B). (C) TN-B (showing with red fluorescence) readily penetrated the BBB into the brain parechyma, areas in dotted boxes were magnified right, TN-B crossing the cerebral capillaries into brain tissue (arrows in C). EXPRESSION / LABELING:
|
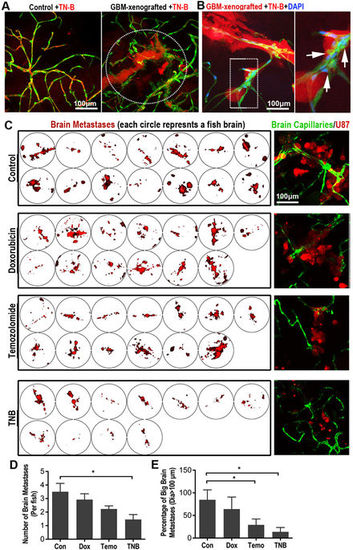
TN-B inhibits the invasion and growth of GBM xenografts in zebrafish brain. (A) TN-B was directly injected into the circulation of 5dpi zebrafish with or without GBM xenografts. Confocal images were taken 1 hour post tracer and drug injection. Dotted circle indicating the tumor area. (B) TN-B and DAPI was injected into the circulation of zebrafish (with 5dpi red GBM xenograft). Confocal images at 8 hours post injection showed the DAPI was still hold in cerebral capillaries (Arrows), indicating the BBB was not destroyed by the TN-B treatment. Area in dotted box was magnified right. (C) Drugs (Doxorubicin, Temozolomide, TN-B and control DMSO) were directly added into the culture medium of living zebrafish embryos (4dpf), which were implanted with GBM-U87 at 3dpf as previously described (n = 20 in each group). After 3days treatment, all the brains of zebrafish embryos were imaged with confocal microscope. Left panels show the intracranial GBM metastases (red) in each zebrafish brain. Right panels show representative images of the intracranial GBM cells (red) and cerebral capillaries (green) with high resolution. (D,E) Quantitative analysis of the number of whole GBM metastases or relative big GBM metastases in zebrafish brain with or without drug treatment at 7dpf, diagrams showing means and SEM. |
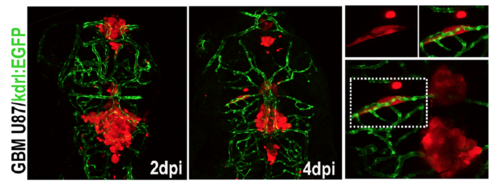
Living tracking of U87-RFP xenograft in flk1:EGFP zebrafish. Part of the area in 4dpi panel was magnified right, seperated channels of areas in dotted boxes were also showing upper. |
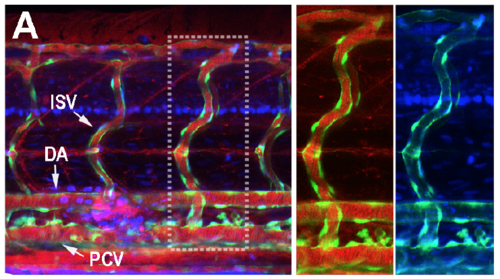
(A) The Dextran Texas Red (70,000 MW, 1mg/ml) and DAPI (350 MW, 1.5mg/ml) were mixed and injected into the circulation of 3dpf embryos (5nl/fish) from caudal vein (CV). Confocal living images of the segmental capillaries were obtained at 30 min after injection. (A) Both Dextran Texas Red and DAPI were leaked out from primary intersegmental vessels (ISV) , dorsal aorta (DA) and post caudal vein (PCV). |
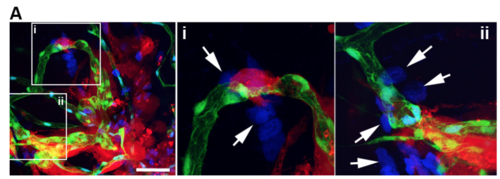
U87-RFP tumor cells were injected into the flk1: EGFP zebrafish brain as described in method section. DAPI was injected into the blood circulation though caudal vein 1 hour before the confocal imaging of the zebrafish brain. Two areas (i and ii) are magnified right, arrows indicate the DAPI leakage, scale bar indicates 100μm。 |