
- Title
-
Dynein/dynactin is necessary for anterograde transport of Mbp mRNA in oligodendrocytes and for myelination in vivo.
- Authors
- Herbert, A.L., Fu, M.M., Drerup, C.M., Gray, R.S., Harty, B.L., Ackerman, S.D., O'Reilly-Pol, T., Johnson, S.L., Nechiporuk, A.V., Barres, B.A., Monk, K.R.
- Source
- Full text @ Proc. Natl. Acad. Sci. USA
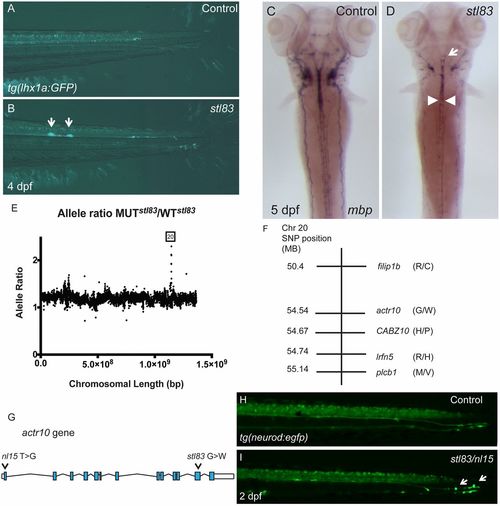
A forward genetic screen uncovers actr10 mutants. (A) tg(lhx1a:gfp) marks axons in the tail of a control zebrafish larva at 4 dpf. (B) stl83 mutants exhibit axonal swellings in the CNS (arrows). (C) mbp ISH in a control animal at 5 dpf shows robust mbp mRNA levels. (D) An stl83 mutant animal exhibits reduced mbp mRNA in the hindbrain (arrow) and spinal cord (arrowheads). (E) Analysis of whole genome sequencing data revealed a higher mutant-to-WT allele ratio on chromosome 20, and SNP subtraction analysis (F) narrowed the number of candidate genes to five. (G) Diagram of actr10 genomic structure shows the location of the nl15 mutation in exon 1 and the stl83 mutation in exon 12. (H) In a tg(neurod:egfp) background, the lateral line is normal in the tail of control animals at 2 dpf. (I) A complementation cross demonstrated that transheterozygous stl83/nl15 animals have axonal swellings in the PNS (actr10stl83/nl15: n = 22) (arrows), which are never seen in either heterozygous or WT animals from either genotype (actr10+/+: n = 47; actr10stl83/+: n = 13; actr10nl15/+: n = 9). A, B, H, and I, lateral views, dorsal up; C and D, dorsal views, anterior up. (Magnification: A and B, 80×; C and D, 50×; H and I, 160×.) |
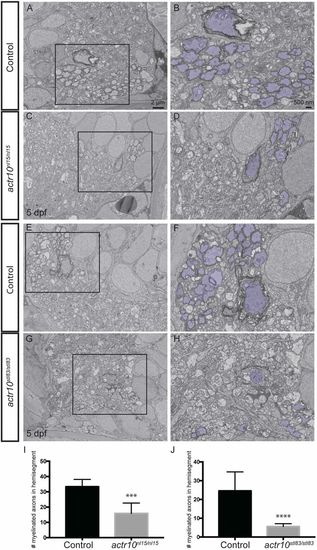
actr10 mutants have fewer myelinated axons in the ventral spinal cord. (A) Myelinated axons in a control larva in a hemisegment of the ventral spinal cord at 5 dpf. (B) Pseudocoloring and higher magnification enhance visualization of control myelinated axons. (C and D) Myelinated axons are similarly shown in a quadrant of the ventral spinal cord in an actr10nl15/nl15 mutant animal. (E and F) Myelinated axons in a control larva in a quadrant of the ventral spinal cord at 5 dpf. (G and H) Myelinated axons are similarly shown in a quadrant of the ventral spinal cord in an actr10stl83/stl83 mutant animal at 5 dpf. (I and J) Quantification revealed a significant difference in the number of myelinated axons in a ventral quadrant between control animals (n = 6) and actr10nl15/nl15 mutants (n = 4; ***P < 0.0006) (I) and between control animals (n = 8) and actr10stl83/stl83 mutants (n = 5; ****P < 0.0001) (J) at 5 dpf. Unpaired t tests with Welch’s correction were used for statistical analysis. PHENOTYPE:
|

actr10nl15/nl15 mutants have fewer OPCs. (A and B) Double transgenic tg(sox10:mgfp);tg(olig2:dsred) larvae were used to identify OPCs in spinal cord cross-sections at 3 dpf. Arrowheads mark OPCs, which are labeled by cytoplasmic DsRed and membrane-tagged GFP. (C) Mutants (n = 7) have significantly fewer OPCs in the spinal cord compared with sibling controls (n = 16; ***P < 0.0002). (D–G) The tg(olig2:dsred) line was used to count the number of olig2-labeled elongated cells in control animals (D and D′, arrows) compared with actr10nl15/nl15 mutants (E and E′, arrows) at 3 dpf and at 4 dpf (pictured). (F) Quantification revealed a significant difference between the number of olig2-labeled dorsal cells in controls (n = 48) compared with actr10nl15/nl15 mutants (n = 16; **P < 0.007) at 3 dpf. (G) Similarly, there was also a significant difference between controls (n = 28) and actr10nl15/nl15 mutants (n = 16; ****P < 0.0001) at 4 dpf. Unpaired t tests with Welch’s correction were used for statistical analysis. EXPRESSION / LABELING:
PHENOTYPE:
|
actr10nl15/nl15 mutants have fewer OPCs. (A and B) Double transgenic tg(sox10:mgfp);tg(olig2:dsred) larvae were used to identify OPCs in spinal cord cross-sections at 3 dpf. Arrowheads mark OPCs, which are labeled by cytoplasmic DsRed and membrane-tagged GFP. (C) Mutants (n = 7) have significantly fewer OPCs in the spinal cord compared with sibling controls (n = 16; ***P < 0.0002). (D–G) The tg(olig2:dsred) line was used to count the number of olig2-labeled elongated cells in control animals (D and D′, arrows) compared with actr10nl15/nl15 mutants (E and E′, arrows) at 3 dpf and at 4 dpf (pictured). (F) Quantification revealed a significant difference between the number of olig2-labeled dorsal cells in controls (n = 48) compared with actr10nl15/nl15 mutants (n = 16; **P < 0.007) at 3 dpf. (G) Similarly, there was also a significant difference between controls (n = 28) and actr10nl15/nl15 mutants (n = 16; ****P < 0.0001) at 4 dpf. Unpaired t tests with Welch’s correction were used for statistical analysis. |
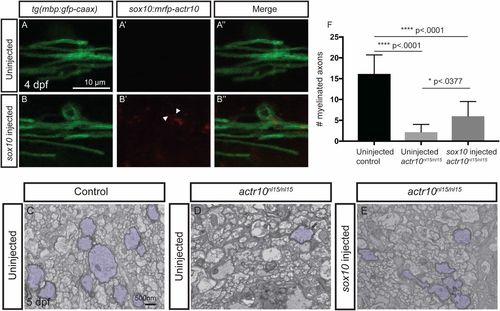
Transient expression of actr10 in oligodendrocytes partially suppresses myelination defects in actr10nl15/nl15 mutants. (A–B′′) Confocal images of mbp-labeled oligodendrocytes in uninjected (A) and sox10:mRFP-actr10 (“sox10 injected”) actr10nl15/nl15 mutants (B). While uninjected actr10nl15/nl15 mutants do not exhibit RFP fluorescence (A′ and A′′), injection of sox10:mRFP-actr10 results in monomeric RFP fluorescence in actr10nl15/nl15 mutants (B′ and B′′). (C–E) TEM images show dorsal spinal cords of uninjected WT and actr10nl15/+ controls (C), uninjected actr10nl15/nl15 mutants (D), and sox10:mRFP-actr10–injected actr10nl15/nl15 mutants (E). Myelinated axons are pseudocolored in purple. (F) Quantification shows that sox10-injected actr10nl15/nl15 mutants (n = 6) have significantly greater numbers of myelinated axons in the dorsal spinal cord compared with uninjected actr10nl15/nl15 mutant siblings (n = 5, P < 0.0377), although sox10:mRFP-actr10 injection does not restore myelination to WT control levels (n = 5, P < 0.0001), indicative of partial rescue. One-way ANOVA with Tukey’s multiple comparisons test was used for statistical analyses. |
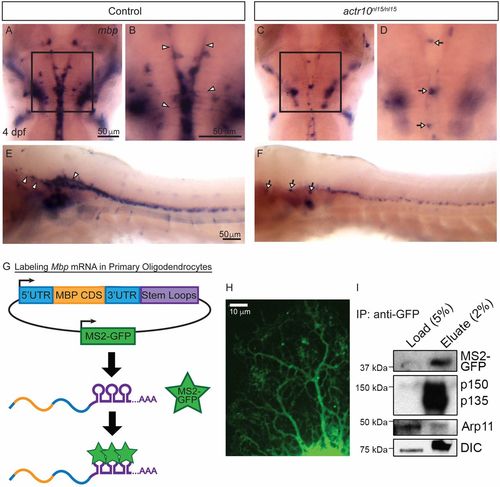
Dynein and dynactin are associated with Mbp mRNA granules. (A) ISH shows robust levels of mbp mRNA in a representative control larva at 4 dpf, and higher magnification (B) shows mbp processes in the control (arrowheads) (n = 47/47). In contrast, an actr10nl15/nl15 mutant (C) has a punctate mbp phenotype, and higher magnification of the same image (D) shows mbp-positive cell bodies (arrows) but no processes (n = 18/18). (E) A lateral view of the brain and spinal cord of a WT animal shows mbp mRNA in processes (arrowheads), while actr10nl15/nl15 mutant animals (F) have cell bodies (arrows) but reduced mbp mRNA-bearing processes. (G) A bidirectional construct expressing MS2-GFP, a RNA-binding reporter, as well as MBP 5′UTR, CDS, and 3′UTR tagged with MS2 stem loops was electroporated into purified rat oligodendrocytes. MS2-GFP binds to stem loops to allow visualization of Mbp mRNA motility. (H) A primary rat oligodendrocyte expressing MS2-GFP–labeled Mbp mRNA imaged using spinning-disk confocal microscopy shows distribution of Mbp mRNA throughout the oligodendrocyte processes. (I) Lysates from primary rat oligodendrocytes expressing the MS2-GFP–labeled Mbp mRNA construct were immunoprecipitated using an anti-GFP antibody and probed with p150Glued, DIC (dynein intermediate chain), and Actr10/Arp11 antibodies (n = 4 independent experiments). |

Acute dynein inhibition arrests both anterograde and retrograde Mbp mRNA transport in cultured oligodendrocytes and perturbs mbp localization in zebrafish. (A) In kymographs representing 60 s of live-cell imaging, MS2-GFP–labeled Mbp mRNA can be seen moving in the retrograde direction in untreated cells (Top). Following acute ciliobrevin D (15 μM) addition, Mbp mRNA displays bidirectional motility characterized by frequent back-and-forth movement and many directional switches (Middle). Finally, around 15 min after ciliobrevin D (15 μM) addition, most cells display arrested motility (Bottom). (B) A scatter plot represents the average anterograde or retrograde net speeds for individual oligodendrocytes. (C and D) Anterograde or retrograde net speeds were averaged for each cell and binned across 27-min time periods following ciliobrevin treatment. At 8–15 min following ciliobrevin treatment, speeds significantly decreased compared with earlier time points. One-way ANOVAs with post hoc Tukey’s test were performed. Anterograde speeds: No CilioD vs. 1–7 min, P = 0.11; No CilioD vs. 8–15 min, **P = 0.0011; 1–7 min vs. 8–15 min, P = 0.077. Retrograde speeds: No CilioD vs. 1–7 min, P = 0.67; No CilioD vs. 8–15 min, P = 0.11, 1–7 min vs. 8–15 min, *P = 0.027. (E) A model shows that Mbp mRNA granules can move processively in the anterograde and retrograde directions as well as bidirectionally and that each Mbp mRNA granule can simultaneously bind to both kinesin and the dynein/dynactin complex. (F–I) mbp ISH of zebrafish larvae treated with ciliobrevin D for 21 h. Larvae were scored as having strong (F), normal (G), reduced (H), or absent (I) mbp localization in oligodendrocyte processes (arrowheads, processes; arrows, cell bodies). (J) Quantification of phenotypic distribution shows that there was a significant difference in scores for DMSO (n = 71) and ciliobrevin D-treated larvae (n = 68), with the latter exhibiting more larvae with reduced or absent mbp localization in oligodendrocyte processes (P < 4.5E-14, Fisher’s exact test). (Scale bar, 50 μM.) |
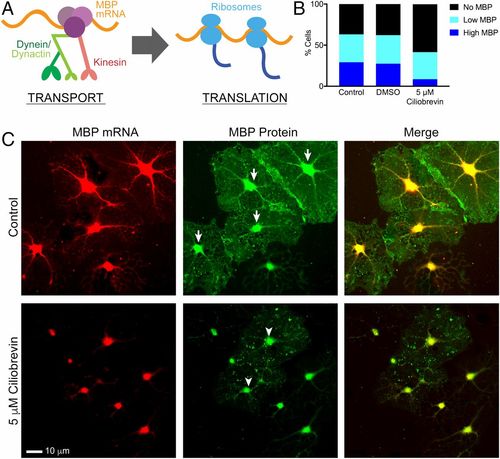
Chronic dynein inhibition disrupts MBP protein translation in cultured oligodendrocytes and disrupts myelination in zebrafish. (A) A model shows that transport of Mbp mRNA granules by microtubule-based motors precedes local translation and recruitment of ribosomes. (B) Quantification of the percentage of DIV3 oligodendrocytes treated for 21 h with 5 μM ciliobrevin that express MBP protein demonstrate that a lower percentage of ciliobrevin-treated cells (42%) are positive for MBP protein compared with control cells (63%, P < 0.001) and DMSO-treated cells (62%, P < 0.001). Of these MBP-containing cells, only 8.5% of ciliobrevin-treated cells highly expressed MBP protein compared with 29% (P < 0.001) and 27% (P < 0.001) in control and DMSO-treated cells. (C) Cells treated with 5 μM ciliobrevin for 21 h were costained with single-molecule FISH probes against Mbp mRNA and with a monoclonal antibody against MBP protein. MBP protein images (Middle) show examples of high expressers (arrows) in control cells and low expressers (arrowheads) in ciliobrevin-treated cells (n = 2 biological replicates using primary cultures from two different animals, four coverslips, 23–32 fields of view per group). |
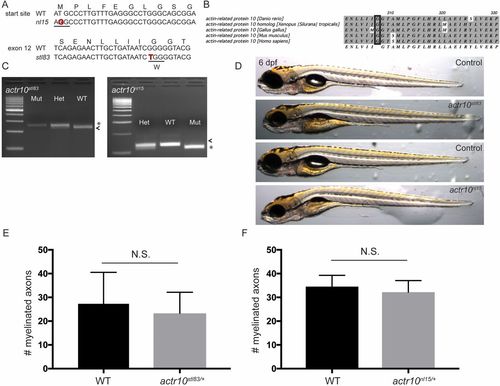
nl15 and stl83 are alleles of actr10 (related to Figs. 1 and 2). (A) The nl15 allele is the result of a mutation in the start site (T to G), while the stl83 allele results from a G-to-T transition. (B) The Actr10/Arp11 amino acid sequence is highly conserved across species, and the glycine altered in the stl83 allele is completely conserved from zebrafish to human (black rectangle). (C) A dCAPS genotyping assay for stl83 inserts an AvaI restriction site in WT, leading to a 224-bp major band in WT used for genotyping (arrowhead) and a minor fragment of 22 bp. Mutants have a 244-bp fragment (asterisk). The nl15 mutation introduces an HaeIII site in mutants resulting in a major band at 112 bp (asterisk) and shorter bands at 50 bp and 14 bp, while WT has a major band at 126 bp (arrowhead) and a minor band of 50 bp. (D) Neither stl83 nor nl15 mutants develop a swim bladder. However, stl83 mutants appear generally healthier than nl15 mutants at 6 dpf. (Magnification: 20×.) (E) There is no significant difference in number of myelinated axons in the ventral spinal cord between sibling actr10+/+ (n = 3) and actr10stl83/+ (n = 4) animals (P < 0.61). (F) Similarly, there is no difference in number of myelinated axons between sibling actr10+/+ (n = 3) and actr10nl15/+ (n = 3) animals. Unpaired t test with Welch’s correction used for statistical analyses. N.S., nonsignificant. |
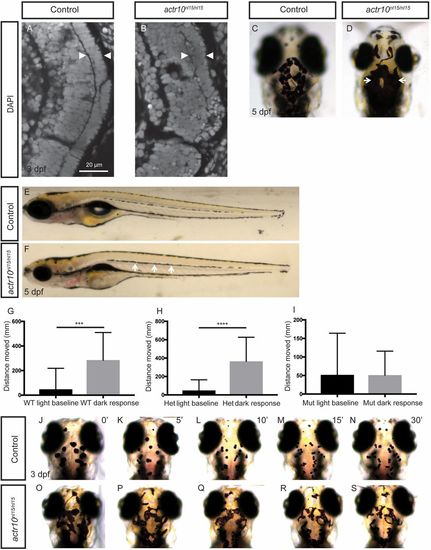
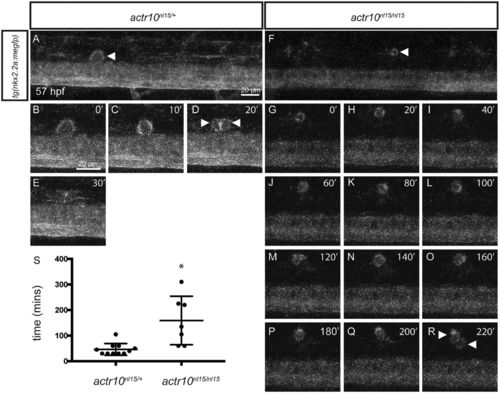
actr10nl15/nl15 mutants have similar phenotypes to dynactin and dynein mutants (related to Fig. 6). (A and B) Photoreceptor layer analysis by DAPI staining at 3 dpf. Controls (n = 4) have a normal photoreceptor layer (A, arrowheads), while actr10nl15/nl15 mutants (n = 3) have a disrupted photoreceptor layer (B, arrowheads). (C and D) Head pigment analysis at 5 dpf. WT controls have normal pigmentation (C), while actr10nl15/nl15 mutants have expanded pigment (D, arrows). (E and F) Lateral line pigment analysis at 5 dpf. WT control animals have intermittent pigment along the lateral line (E), while actr10nl15/nl15 mutants have increased pigment (F, arrows). (G–I) The Noldus DanioVision behavioral system was used to track larval movement at 6 dpf. WT (G, n = 23, ***P < 0.0002) and heterozygous (H, n = 36, ****P < 0.0001) controls showed a significant increase in movement in response to dark, while actr10nl15/nl15 mutants did not (I, n = 26, P < 0.98). An unpaired t test with Welch’s correction was used for statistical analysis. (J–S) Epinephrine treatment to assay retrograde melanosome transport. Before epinephrine treatment at 3 dpf, control animals (n = 19) exhibit similar pigment patterns. After 5 min of epinephrine exposure (K), melanosomes have begun to move back toward the melanophore cell body via retrograde transport. After 10 (L), 15 (M), and 30 min (N), all control animals have small pigment patches representative of aggregated melanosomes. Before epinephrine treatment, actr10nl15/nl15 mutants (n = 11) can be distinguished phenotypically from control animals by excessive pigment (O). After 5 (P), 10 (Q), 15 (R), and 30 (S) min of epinephrine treatment, melanosomes in mutants are still more dispersed relative to those in control animals. Note that representative animals were selected at random, and images may be different animals. (Magnification: C and D, 80×; E and F, 20×; J–S, 80×.) |
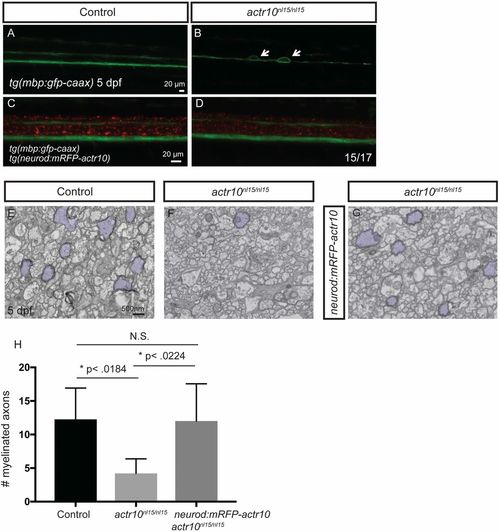
Stable expression of actr10 in neurons suppresses myelination defects in actr10nl15/nl15 mutants (related to Fig. 5). (A–D) Fluorescent micrographs showing tg(mbp:gfp-caax) and tg(neurod:mRFP-actr10) expression in zebrafish of the indicated genotypes harboring the indicated transgenes at 5 dpf. (A) The ventral and dorsal spinal cords are normal in a WT control animal lacking the neurod:mRFP-actr10 transgene. (B) Large caliber swellings (arrows) are present in an actr10nl15/nl15 mutant lacking the neurod:mRFP-actr10 transgene. (C and D) Swellings are not observed in a WT control (C) and are ameliorated in actr10nl15/nl15 mutants harboring the neurod:mRFP-actr10 transgene (n = 15/17). (E–G) TEM images of the dorsal spinal cord show myelinated axons (pseudocolored purple) in WT control animals (E) (n = 4), actr10nl15/nl15 mutants lacking the stable neurod:mRFP-actr10 transgene (F) (n = 3), and actr10nl15/nl15 mutants harboring the stable neurod:mRFP-actr10 transgene (G) (n = 4). (H) Quantification shows that stable neuronal expression of actr10 suppresses actr10nl15/nl15 mutant myelination defects to WT levels (P < 0.99, N.S.), while there is a significant difference between control and actr10nl15/nl15 mutants (*P < 0.018) and actr10nl15/nl15 mutants and actr10nl15/nl15 mutants with the neurod:mRFP-actr10 transgene (*P < 0.022). |
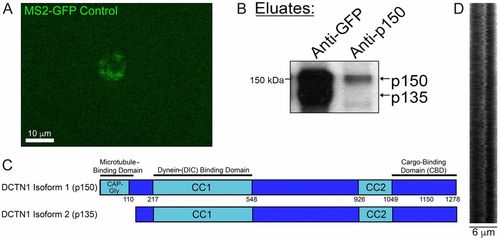
Coimmunoprecipitation pulls out p135 in addition to p150Glued (related to Figs. 6 and 7). (A) Image of a cell expressing a control construct for MS2-GFP, which contains a nuclear localization sequence (NLS). In the absence of any stem loop containing constructs, such as MBP, MS2-GFP localizes to the nucleus. (B) Identity of the p135 band from an anti-GFP immunoprecipitation against MS2-GFP–associated MBP mRNA granules was confirmed by comparing it to the eluted band from an immunoprecipitation using an antibody targeted against the N terminus of p150Glued, which contains its microtubule-binding domain. (C) Ribbon diagram of DCTN1 isoform 1 (p150Glued) shows a CAP-Gly microtubule-binding domain, which is lacking in DCTN1 isoform 2 (p135). (D) Kymograph analysis shows rapid back-and-forth movement of Mbp mRNA granules. |
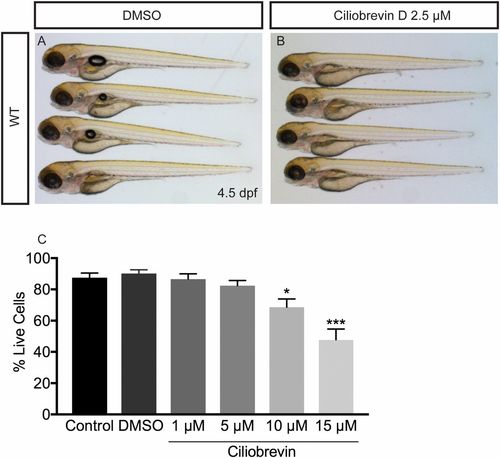
Effects of ciliobrevin D treatment on zebrafish and cultured oligodendrocytes (related to Fig. 7). (A and B) DMSO and ciliobrevin D-treated fish at 4.5 dpf. Compared with fish treated with DMSO for 21 h (A), ciliobrevin D-treated fish look relatively normal. (Magnification: A and B, 16×.) (C) Treatment of oligodendrocytes differentiated for 3 d in vitro with different concentrations of the dynein inhibitor ciliobrevin for 21 h. Cell death was assayed by morphology using DIC microscopy; living cells contained continuous, nonbulbous branches and adhered to coverslips. Concentrations of 1 μM and 5 μM did not significantly alter the percentage of living cells, while 10 μM and 15 μM significantly decreased the percentage of living cells (n = 4 coverslips per group; *P = 0.023, ***P = 0.0001, one-way ANOVA). |