
- Title
-
Pyridoxine-Dependent Epilepsy in Zebrafish Caused by Aldh7a1 Deficiency
- Authors
- Pena, I.A., Roussel, Y., Daniel, K., Mongeon, K., Johnstone, D., Mendes, H.W., Bosma, M., Saxena, V., Lepage, N., Chakraborty, P., Dyment, D.A., van Karnebeek, C.D.M., Verhoeven-Duif, N., Bui, T.V., Boycott, K.M., Ekker, M., MacKenzie, A.
- Source
- Full text @ Genetics
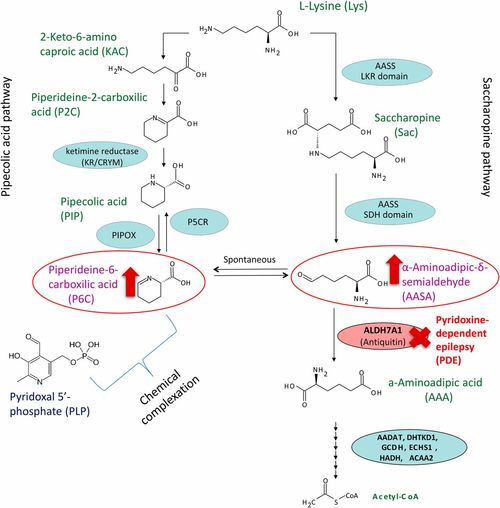
Pipecolic acid (left) and saccharopine (right) pathways for L-lysine catabolism in animals. The L-pipecolic acid pathway. LKR (lysine-ketoglutarate reductase) domain and SDH (saccharopine dehydrogenase) domain of the bifunctional AASS (aminoadipic semialdehyde synthase) enzyme. Antiquitin (encoded by the gene ALDH7A1) is deficient in pyridoxine-dependent epilepsy (red) leading to accumulation of AASA and P6C (red arrows). PIPOX (pipecolic acid oxidase). P5CR (piperideine-5-carboxilic reductase), encoded by the gene PYCR1. Further enzymatic steps convert AAA to Acetyl-CoA. |
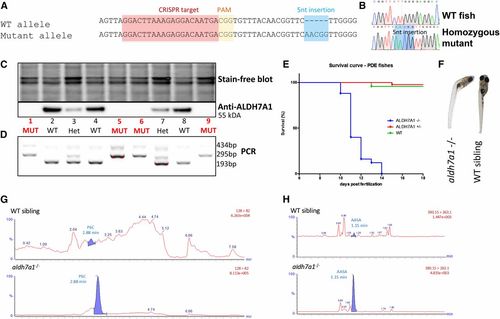
Development of an aldh7a1−/− zebrafish model by CRISPR/Cas9. The allele aldh7a1ot100 contains a 5-nt insertion mutation (A), which leads to a premature stop codon and an N-terminal-truncated Aldh7a1 protein product. Sequencing chromatograms from F3 larvae show the WT and homozygous mutant (B) patterns. Western blot detected the Aldh7a1 protein in WTs, with ∼50% reduction and complete loss of expression in heterozygous and in the homozygous mutants, respectively (C). PCR-based genotyping (D) using DNA extracted from the fins of the larvae shown in (C) were consistent with the western findings. Kaplan–Meier survival plot showing early death in the homozygous mutants (11–14 dpf), n = 12 aldh7a1−/−, n = 18 aldh7a1+/−, n = 10 aldh7a1+/+ (E). Curved body phenotype observed at 11–14 dpf in the mutants after seizure onset (F). Representative liquid chromatography-mass spectrometry analysis of 7 dpf single larva (n = 6 per genotype); polar metabolite extracts revealed detection and accumulation of the PDE biomarkers P6C and AASA exclusively in the mutants (G and H bottom). No P6C or AASA signal was obtained in the extracts from WT or heterozygous siblings (G and H top). AASA, aminoadipate semialdehyde; CRISPR, clustered regularly interspaced short palindromic repeat; dpf, days postfertilization; HET, heterozygote; MUT, mutant; P6C, piperideine 6-carboxylate; PAM, protospacer adjacent motif; PDE, pyridoxine-dependent epilepsy; WT, wild-type. PHENOTYPE:
|
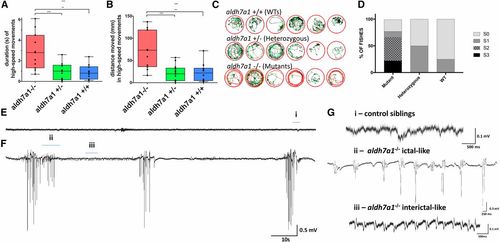
Seizure phenotype in aldh7a1−/− 11-dpf larvae. Video recordings (n = 12 larvae per genotype) were analyzed for high-speed movement in the presence of light stimulus; the calculated duration (A) and distance traveled (B) are shown. Movement traces shown in red, green, and black represent high-speed, intermediate, and slow movements, respectively (C). Blinded classification of seizure scores from video recordings of mutants, heterozygous, and WT larvae (n = 12 larvae per genotype). S0 characterizes normal swimming behavior, S1 reflects increased activity, S2 indicates rapid circular swimming activity, and S3 represents whole-body convulsions. Tectal field recordings of representative 11-dpf WT sibling (E) and aldh7a1−/− (F) showing spontaneous epileptiform-like electrographic activity in the mutants. Amplified view (G) of regions of the traces shown in (E and F): “i” normal activity as seen in WT and heterozygous siblings, “ii” ictal-like, and “iii” interictal-like epileptiform discharge observed in the mutants. Asterisks indicate statistical significance (* P < 0.05, ** P < 0.01, and *** P < 0.001) according to one-way ANOVA test on top of the graphics (in (A) P = 0.0003 and in (B) P = 0.0002) with Tukey’s post hoc pairwise tests. Error bars represent ± SD. All experiments were performed comparing aldh7a1−/− and its heterozygous or WT siblings. dpf, days postfertilization; WT, wild-type PHENOTYPE:
|
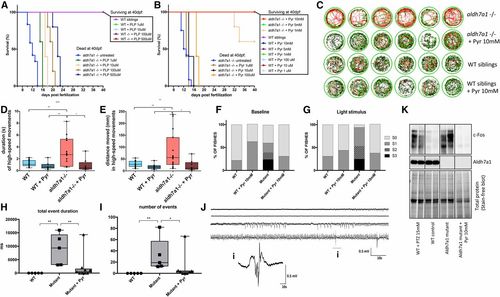
Pyridoxine (Pyr)-dependent epilepsy in aldh7a1−/− larvae. Pyridoxal 5′-phosphate (PLP) treatment promoted dose-dependent increase in survival of mutant larvae (A). Pyr treatment also led to prolonged life span of the null-mutants, with 100% survival until juvenile stage (5 and 10 mM daily) (B). In both cases, experiments were terminated at 40 days postfertilization (dpf) and consisted of n = 5 individuals per group except for untreated aldh7a1−/− (n = 12). Representative movement traces obtained from Zebralab software showing in red, high-speed, green, intermediate, and black, slow movements for mutants and their wild-type (WT) siblings, untreated and treated with Pyr 10 mM (C). Movement analysis using Zebralab showing duration (D) and distance traveled in high-speed movements (E). Blinded analysis of baseline (F) and light stimulus (G) video recordings classified the behavior in seizure scores as described previously. N = 16 aldh7a1−/− untreated, n = 8 aldh7a1−/− + Pyr 10 mM, n = 16 WT untreated, and n = 8 WT + Pyr 10 mM (D–G). Total event duration of the electrographic seizure-like bursts (H) and total number of such events (I) observed in a window of 5 min for n = 5 WT siblings, n = 5 untreated aldh7a1−/−, and n = 9 aldh7a1−/− treated with Pyr 10 mM. Examples of traces of treated mutants showing magnification of one burst are shown in “i” (J). Western blot probing with anti-c-Fos and anti-ALDH7A1 antibodies (K); each lane corresponds to protein extracts of a single larva. Asterisks indicate statistical significance (* P < 0.05, ** P < 0.01, and *** P < 0.001) based on ANOVA test with Tukey’s post hoc pairwise tests. Error bars represent ± SD. All experiments were performed comparing aldh7a1−/− and its WT siblings. Electrophysiology measurements were performed using four different batches of larvae. EXPRESSION / LABELING:
PHENOTYPE:
|
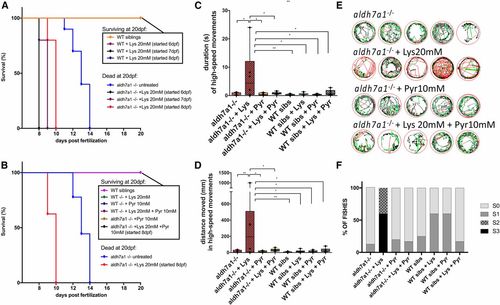
Early seizure onset and death following Lysine (Lys) treatment. Survival of aldh7a1−/− and wild-type (WT) siblings after 48 hr of exposure with Lysine 20 mM (A) started at days 6, 7, or 8 days postfertilization (dpf). Survival of aldh7a1−/− and WT siblings after 48 hr of treatment with Lys with or without daily Pyridoxine 10 mM (Pyr) treatments (B). Survival experiments were terminated at 20 dpf. Video analysis of 9-dpf larvae after 24 hr of treatment with Lys 20 mM, Pyr 10 mM, or both, showing significant increase in duration (C) and distance moved (D) in high-speed movements after light stimulus. Representative movement traces obtained from the Zebralab software at 9 dpf (24 hr after Lys treatment) showing the presence of larvae with hyperactivity and high-speed movements (red) (E). Blinded analysis of the same videos analyzed in (C–E) showing classification of each fish by seizure scores (S0, S1, S2, and S3), n = 8 larvae per group, except for mutant + Lys 20 mM where two fish died during the first 24 hr of treatment (F). Asterisks on top of the graph indicate statistical significance according to one-way ANOVA test [P = 0.0081 in (C) and P = 0.0060 in (D)] and asterisks comparing each pair of samples reflect Tukey’s post hoc pairwise tests (* P < 0.05 and ** P < 0.01). Error bars represent ± SD. PHENOTYPE:
|
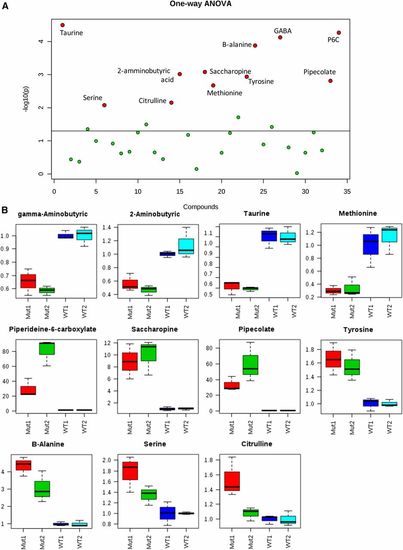
Targeted mass spectrometry allowed the identification of several amino acid perturbations when comparing two different batches of aldh7a1-null mutants (Mut1 and Mut2) and their WT siblings (WT1 and WT2). (A) Graphical summary of one-way ANOVA analysis comparing the four groups of samples, using P-value cutoff of 0.05. Metabolites identified with statistically significant changes are shown in red and labeled. (B) box and whisker plots summarize the normalized values (mean fold change ± SD) for the metabolites shown in red in (B) significantly different between the two batches of WT and Mut. For this experiment, polar metabolite extracts of three pools (five 11-days postfertilization larvae each) were used for each group. GABA, γ-aminobutyric acid; P6C, piperideine 6-carboxylate; WT, wild-type. PHENOTYPE:
|
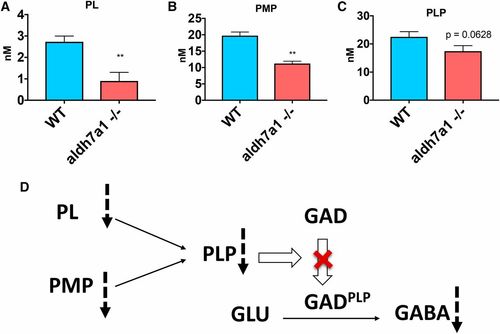
B6 vitamers are changed in aldh7a1−/− larvae compared to WT siblings. Lower levels of PL (A), PMP (B), and PLP (C) were observed in the null-mutants compared to WT according to liquid chromatography-mass spectrometry analysis using polar metabolite extracts (three replicates of six larvae pools). Asterisks indicate statistical significance according to Student’s t-test (* P < 0.05 and ** P < 0.01). Error bars represent ± SD. Possible mechanism for low GABA levels observed in the mutant larvae correlating with lower B6 vitamer levels (D), with potential reduction in the conversion levels of the inactive apo-form of GAD (and other PLP-dependent enzymes) to their catalytically active holo-form (GADPLP) by the covalent attachment of PLP. GABA, γ-aminobutyric acid; GAD, glutamate decarboxylase; PL, pyridoxal; PMP, pyridoxamine 5′-phosphate; PLP, pyridoxal 5′-phosphate; WT, wild-type. PHENOTYPE:
|
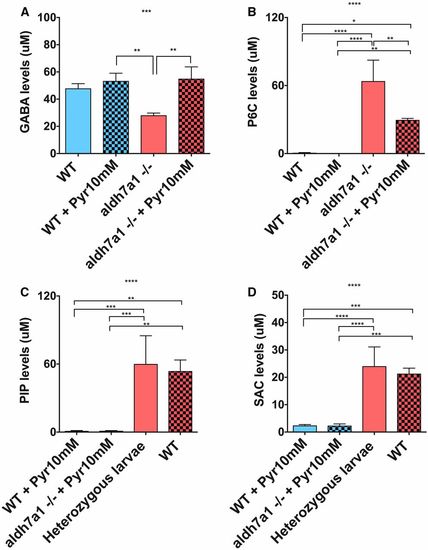
GABA levels are normalized by Pyr treatment but lysine metabolites are mostly unaffected in aldh7a1−/− larvae. Mass spectrometry analysis of lysine metabolites in polar metabolite extracts was obtained from three pools of 11-days postfertilization larvae (six individuals each pool) per experimental condition; GABA (A), P6C (B), SAC (C), and PIP (D). Asterisks indicate statistical significance according to one-way ANOVA Tukey’s post hoc tests (* P < 0.05, ** P < 0.01, *** P < 0.001, **** P < 0.0001). Error bars represent ± SD. GABA, γ-aminobutyric acid; P6C, piperideine-6-carboxylate; PIP, pipecolic acid; Pyr, pyridoxine; SAC, saccharopine; WT, wild-type. PHENOTYPE:
|

ZFIN is incorporating published figure images and captions as part of an ongoing project. Figures from some publications have not yet been curated, or are not available for display because of copyright restrictions. PHENOTYPE:
|
|
ZFIN is incorporating published figure images and captions as part of an ongoing project. Figures from some publications have not yet been curated, or are not available for display because of copyright restrictions. PHENOTYPE:
|
|
ZFIN is incorporating published figure images and captions as part of an ongoing project. Figures from some publications have not yet been curated, or are not available for display because of copyright restrictions. |
|
ZFIN is incorporating published figure images and captions as part of an ongoing project. Figures from some publications have not yet been curated, or are not available for display because of copyright restrictions. PHENOTYPE:
|