
- Title
-
An Effective Feedback Loop between Cell-Cell Contact Duration and Morphogen Signaling Determines Cell Fate
- Authors
- Barone, V., Lang, M., Krens, S.F.G., Pradhan, S.J., Shamipour, S., Sako, K., Sikora, M., Guet, C.C., Heisenberg, C.P.
- Source
- Full text @ Dev. Cell
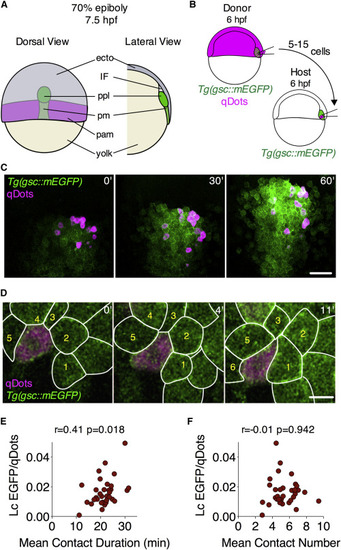
Cell-Cell Adhesion and Goosecoid Expression Positively Correlate within the Prechordal Plate In Vivo (A) Schematic representation of a 70% epiboly stage (7.5 hpf) embryo. Lateral view shows a section through the dorsal midline of the embryo. Ecto, ectoderm; IF, interstitial fluid; ppl, prechordal plate; pm, posterior axial mesendoderm; pam, paraxial mesendoderm. (B) Schematic representation of a homotypic/homochronic transplantation assay. (C) Representative images of ppl cells transplanted from a Tg(gsc::mEGFP) embryo injected with qDots into a Tg(gsc::mEGFP) non-injected embryo. Transplantation was performed at shield stage (6 hpf) and images were taken between 60% epiboly stage (6.5 hpf) and 70% epiboly stage (7.5 hpf). Scale bar, 50 μm. (D) Representative images of cell-cell contact dynamics between transplanted and host ppl cells at 60% epiboly stage (6.5 hpf). Scale bar, 20 μm. (E and F) Correlation between gsc::mEGFP expression rate and average contact duration (E) or average number of contacts (F) in ppl progenitors between 6.5 and 7.5 hpf. Transplanted cells were tracked for 60 min and average EGFP and qDots intensities were measured for each cell at 3 min intervals. The linear coefficient (Lc) of EGFP/qDots as a function of time was normalized by the median EGFP/qDots level of all transplanted cells at the first time point in the respective experiment, and used as a proxy of the level of endogenous gsc expression. Average ppl cell-cell contact duration and number were computed after tracking cell-cell contacts formed by each transplanted ppl cell for 60 min. n (cells), 34; 4 embryos. Pearson correlation (r) and relative p values (p) are shown. See also STAR MethodsSTAR Methods, Figure S1, and Movie S1. |
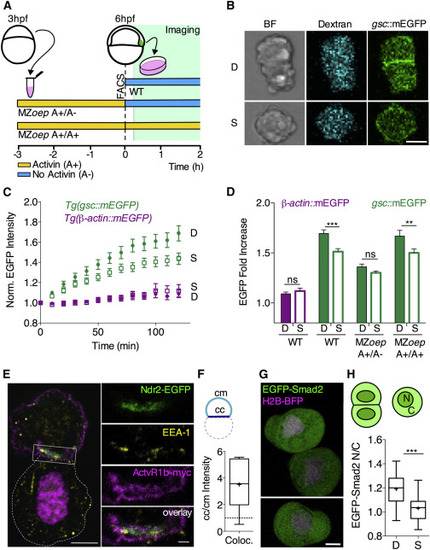
Prechordal Plate Cell-Cell Contact Formation Promotes Nodal Signaling In Vitro (A) Schematic representation of the experimental design. Gsc::mEGFP positive cells were isolated via FACS from WT Tg(gsc::mEGFP) embryos injected with fluorescent dextran-Alexa648 at shield stage (6 hpf) and seeded on non-adhesive substrates for subsequent imaging. MZoep;Tg(gsc::mEGFP) embryos injected with dextran-Alexa648 were dissociated at 3 hpf, and cells were exposed to Activin for 3 hr in culture. Activin-induced Gsc::mEGFP positive cells were then selected by FACS and seeded on non-adhesive substrates for subsequent imaging. During imaging, selected cells were kept in culture medium either containing Activin (MZoep A+/A+) or not (MZoep A+/A-). (B) Representative images of doublets (D) and single cells (S) obtained from WT Tg(gsc::mEGFP) at shield stage (6 hpf) after 160 min in culture. Scale bar, 10 μm. (C) Fold increase of average gsc::mEGFP intensities in single cells (S) versus cell doublets (D) as a function of time in culture for ppl cells isolated from Tg(gsc::mEGFP) or Tg(gsc::tRFP);Tg(β-actin::mEGFP) at shield stage (6 hpf). Plotted values, mean ± 95% CI. n (gsc::mEGFP, single cells), 41; n (gsc::mEGFP, doublets), 40; 5 independent experiments. n (β-actin::mEGFP, single cells), 18; n (β-actin::mEGFP, doublets), 19; 5 independent experiments. (D) Average gsc::mEGFP fold increase for doublets (D) and single (S) ppl cells taken from WT or MZoep;Tg(gsc::mEGFP) embryos at shield stage (6 hpf) and cultured for 120 min in the presence (A+/A+) or absence (A+/A–) of Activin within the culture medium. Plotted values, mean ± SEM. n (β-actin::mEGFP, single cells), 18; n (β-actin::mEGFP, doublets), 19; 5 independent experiments. n (gsc::mEGFP, single cells), 52; n (gsc::mEGFP, doublets), 42; 5 independent experiments. n (MZoep, gsc::mEGFP, (A+/A−), single cells), 52; n (MZoep, gsc::mEGFP, (A+/A−), doublets), 47; n (MZoep, gsc::mEGFP, (A+/A+), single cells), 36; n (MZoep, gsc::mEGFP, (A+/A+), doublets), 36; 7 independent experiments. Statistical test, two-way ANOVA and Bonferroni post test; ∗∗p < 0.005; ∗∗∗p < 0.001; ns, not significant. (E) Confocal image of a ppl cell doublet isolated from embryos overexpressing Ndr2EGFP and ActvR1b-myc at 6 hpf and kept in culture for 60 min, showing the subcellular localization of Ndr2-EGFP relative to ActvR1b-myc and EEA1 visualized by immunohistochemistry in the top cell. The bottom cell (outlined by white dashed line) only expresses H2A-Cherry to mark its nucleus. Scale bar, 5 μm. Inset shows high magnification of the colocalization between EEA1, Ndr2-EGFP, and ActvR1b-myc at the cell-cell contact. Scale bar, 1 μm. (F) Intensity ratios of colocalizing EEA1, Ndr2-EGFP, and Actvr1b-myc at cell-cell (cc) versus cell-medium (cm) interfaces of ppl cell doublets obtained from embryos at 6 hpf and kept in culture for 60 min. Values are shown as Tukey box-and-whisker plots with median (bar) and average values (cross). n (doublets), 6; 2 independent experiments. (G) Representative images of ppl cells isolated from Tg(gsc::tRFP) embryos at shield stage (6 hpf) expressing EGFP-Smad2 and H2B-BFP after 60 min in culture. Scale bar, 5 μm. (H) EGFP-Smad2 nuclear-to-cytoplasmic (N/C) ratios for ppl cell doublets (D) and single cells (S) taken from WT Tg(gsc::tRFP) embryos expressing EGFP-Smad2 and H2B-BFP after 60 min in culture. Values are shown as Tukey box-and-whisker plots with median (bar) and average values (cross). n (single cells), 27; n (doublets), 22; 3 independent experiments. Statistical test, Student t test, two tailed; ∗∗∗p < 0.001. See also Figure S2 and Movie S2. |
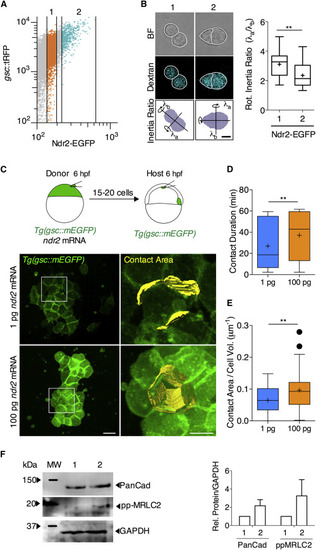
Nodal Signaling Promotes Prechordal Plate Cell-Cell Contact Formation In Vitro and In Vivo (A) FACS sorting strategy: mesendoderm (ppl) cells were obtained from 6 hpf Tg(gsc::tRFP) embryos injected with ndr2-EGFP mRNA at the one-cell stage and sorted into two groups according to Ndr2-EGFP expression levels. (B) Representative bright-field images of cell doublet shapes from the two groups. Cell doublet compaction was quantified as the ratio of rotational inertia along the longest and shortest axis. Values are shown as Tukey box-and-whisker plots with median (bar) and average (cross) values. n (1), 18, n (2), 35; 3 independent experiments. Scale bar, 5 μm. Statistical test, Student t test, two tailed. ∗∗p < 0.01. (C) Representative multi-photon images of mesendoderm progenitor cells transplanted from Tg(gsc::mEGFP) embryos injected with either 1 pg or 100 pg ndr2 mRNA into the animal pole of similar staged WT Tg(gsc::mEGFP) embryos. Transplantation was performed at shield stage (6 hpf), and images were taken between 65% epiboly stage (7 hpf) and 75% epiboly stage (8 hpf). Scale bar, 20 μm. (D) Average contact durations for mesendoderm cells expressing either low (1 pg) or high (100 pg) levels of ndr2. Cell-cell contacts were tracked for 60 min between 65% epiboly stage (7 hpf) and 75% epiboly stage (8 hpf). Values are shown as Tukey box-and-whisker plots with median (bar) and average (cross) values. n (1 pg), 72; n (100 pg), 82; 2 independent experiments each. Statistical test, Mann-Whitney t test, two tailed. ∗∗p < 0.01. (E) Average size of cell-cell contacts between mesendoderm progenitor cells expressing either low (1 pg) or high (100 pg) levels of ndr2 mRNA. Cell-cell contact area was measured 120 min after transplantation at 75% epiboly stage (8 hpf) and normalized on cell volume to account for variation due to cell size. Values are shown as Tukey box-and-whiskers plots with median (bar) and average values (cross). n (1 pg), 51; n (100 pg), 48; 2 independent experiments each. Statistical test, Mann-Whitney t test, two tailed. ∗∗p < 0.01. (F) Representative western blot showing the level of Pan-Cadherin (anti-PanCad antibody), phosphorylated myosin regulatory light chain 2 (anti-pp-MRLC2 antibody), and glyceraldehyde-3-phosphate dehydrogenase (anti-GAPDH antibody; control) expression in the two groups. PanCad/GAPDH and pp-MRLC2/GAPDH ratios were calculated after densitometry of 4 different experiments. See also Figure S2. |
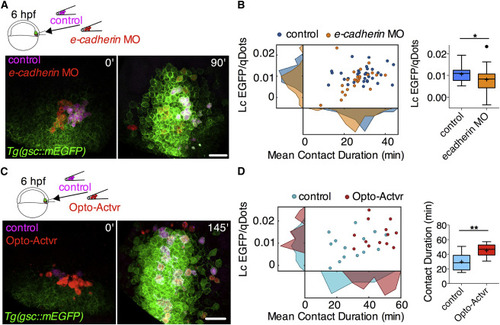
Mutual Enhancement between Prechordal Plate Cell-Cell Contact Formation and Nodal Signaling In Vivo (A) Representative multi-photon images of ppl cells transplanted from Tg(gsc::mEGFP) embryos injected with either control MOs, qDots, and dextran-Cascade Blue (control cells), or e-cadherin MOs and qDots (e-cadherin morphant cells) into similar staged WT Tg(gsc::mEGFP) embryos. Transplantation was performed at shield stage (6 hpf) and images were taken between 65% epiboly stage (7 hpf) and 75% epiboly stage (8 hpf). Scale bar, 50 μm. (B) Linear coefficient (Lc) of gsc::mEGFP/qDots increase as a function of mean contact duration for transplanted control and e-cadherin morphant cells between 7 and 8 hpf. Frequency distributions of linear coefficients and mean contact durations are shown on the respective axes. Lc values are also shown as Tukey box-and-whisker plots. n (control cells), 33; n (e-cadherin morphant cells) 24; 2 independent experiments. Statistical test, Student t test, two tailed. ∗p < 0.05. (C) Representative multi-photon images of ppl cells transplanted from Tg(gsc::mEGFP) embryos injected with either mRNA encoding for a chemically activated form of Actvr1, qDots, and dextran-Cascade blue (control cells) or mRNA encoding for a light-activated form of Actvr1 and qDots (Opto-Actvr1 cells) into similar staged WT Tg(gsc::mEGFP) embryos. Transplantation was performed at shield stage (6 hpf), and images were taken between 75% epiboly stage (8 hpf) and 90% epiboly stage (9 hpf). Scale bar, 50 μm. See also Figure S3. (D) Linear coefficient (Lc) of gsc::mEGFP/qDots increase as a function of mean contact duration for transplanted control and Opto-Actvr1-expressing cells between 8 and 9 hpf. Frequency distributions of linear coefficients and mean contact durations are shown on the respective axes. Mean contact durations are also shown as Tukey box-and-whisker plots. n (control cells), 14; n (Opto-Actvr1 cells), 13; 2 independent experiments. Statistical test, Student t test, two tailed. ∗∗p < 0.01. Note that the absolute values of Lc may differ from Figures 1Figures 1E and 1F as a later temporal window has been analyzed in these experimental sets. |
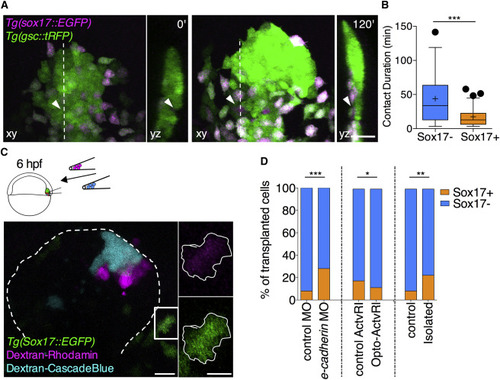
A Positive Feedback Loop between Prechordal Plate Cell-Cell Contact Formation and Nodal Signaling Determines Cell-Fate Specification (A) Representative images of cells within the ppl of Tg(gsc::tRFP);Tg(sox17::EGFP) embryos at shield (6 hpf, 0 min) and 75% epiboly stages (8 hpf, 120 min). Each image contains a planar x,y view (left) of the ppl and y,z cross-section (right) through the ppl at the level indicated by the dashed white line in the planar view. Arrowheads indicate a tracked ppl cell eventually expressing sox17::EGFP. Scale bar, 50 μm. (B) Average contact durations for ppl cells either remaining within the ppl or ppl cells that are about to leave the ppl and turn into sox17::EGFP-expressing endoderm cells. Values are shown as Tukey box-and-whisker plots with median (bar) and average (cross) values. n (sox17-), 56; n (sox17+), 85. Statistical test, Mann-Whitney t test, two tailed. ∗∗∗p < 0.001. (C) Representative confocal image of the ppl of a Tg(sox17::EGFP) host embryo at 90% epiboly stage (9 hpf) containing a mix of transplanted ppl cells from Tg(sox17::EGFP) donor embryos injected with either dextran-Rhodamine or dextran-Cascade blue. Transplantation was performed at shield stage (6 hpf), and images were taken at 90% epiboly stage (9 hpf). Dashed line, ppl outline. Scale bar, 50 μm. Insets, transplanted cell expressing sox17::EGFP with its shape outlined in white. Scale bar, 20 μm. (D) Relative distribution of sox17::EGFP positive versus negative cells within the population of transplanted ppl cells for three different experimental setups: (1) a mix of control cells expressing control MOs and experimental cells expressing e-cadherin MOs were transplanted. n (control transplanted cells), 305; n (e-cadherin-MO transplanted cells), 323; 3 independent experiments; (2) a mix of control cells expressing a chemically inducible Actvr1 and experimental cells expressing a light-activatable Opto-Actvr1 were transplanted followed by exposition of the transplanted embryos to blue LED light. n (control transplanted cells), 140; n (Opto-Actvr1 transplanted cells), 113; 3 independent experiments; (3) control cells and experimental cells were transplanted with the experimental cells being kept for 20 min in isolation before transplanting them. n (control transplanted cells), 89; n (isolated transplanted cells), 145; 3 independent experiments. Statistical test, resampling, and bootstrap, see STAR MethodsSTAR Methods. ∗p < 0.05; ∗∗p < 0.01; ∗∗∗p < 0.001. |
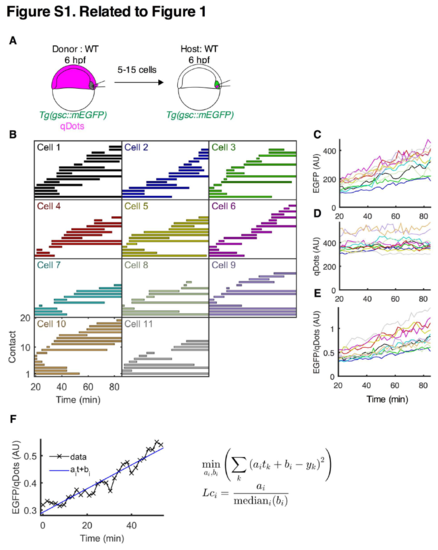
Prechordal plate progenitor cell-cell contact formation and gsc expression in vivo. Related to Figure 1. (A) Schematic representation of a homotypic/homochronic transplantation assay. (B-E) Representative homotypic/homochronic transplantation experiment. 5-15 ppl cells were transplanted from a Tg(gsc::mEGFP) embryo injected with qDots into a Tg(gsc::mEGFP) non-injected embryo. Transplantation was performed at shield stage (6 hpf) and host embryos were imaged for 60 min between 60% epiboly stage (6.5 hpf) and 70% epiboly stage (7.5 hpf). (B) Cell-cell contact dynamics between transplanted donor and host ppl cells between 60% epiboly stage (6.5 hpf) and 70% epiboly stage (7.5 hpf). Cell-cell contacts formed by each of the transplanted cells (Cell 1-11) were manually tracked over a period of approximately 60 min. Each line within a graph represents one tracked cell-cell contact; n (cells), 11; n (contacts), 167. (C-E) Average fluorescence intensities measured for the 11 transplanted ppl cells as a function of time. Each line represents one cell; color coding matches cell-cell contact duration plots in (B). Transplanted cells were tracked for 60 min and average EGFP (C) and qDots (D) intensities were measured for each cell at 2 min intervals. The ratio between EGFP and qDots average intensities was then calculated for each time point (E) and used to compute the linear coefficient (Lc). Note that this ratio grew approximately linearly with time for all cells during the experimental period. (F) Lc computation of a representative transplanted ppl cell. For each cell, a line was fitted to the evolution of the ratio between EGFP and qDots. The Lc then corresponds to the slope of this line normalized by the median of the intersections with the y-axis over all cells in the same experiment to compensate for varying qDots concentrations between experiments. |
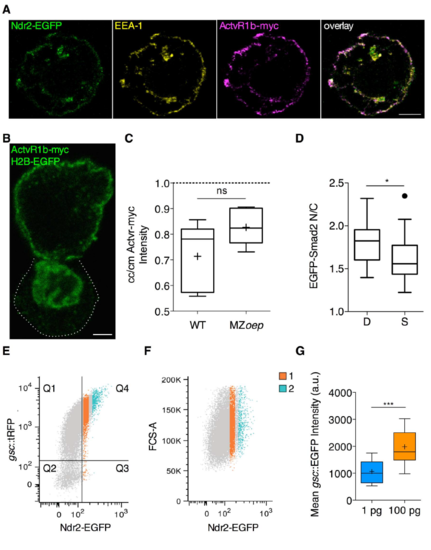
Localization of Nodal signaling pathway components in ppl cells in vitro and FACS sorting strategy for Ndr2-EGFP expressing cells. Related to Figure 2 and 3. (A) Confocal image of a ppl single cell isolated from embryos over-expressing Ndr2-EGFP and ActvR1b-myc at 6 hpf and kept in culture for 60 min, showing uniform subcellular localization of Ndr2-EGFP relative to ActvR1b-myc and EEA1 visualized by immunohistochemistry. Scale bar, 5 μm. (B) Confocal image of a ppl cell doublet isolated from MZoep embryos over-expressing ActvR1b-myc at 3 hpf, exposed to Activin and kept in culture for 60 min after FACS sorting, showing of ActvR1b-myc visualized by immunohistochemistry in the top cell. The bottom cell (outlined by white dashed line) only expresses H2B-EGFP to mark its nucleus. Scale bar, 5 μm. (C) Intensity ratios of Actvr1b-myc on the plasma membrane at cell-cell (cc) versus cell-medium (cm) interfaces of ppl cell doublets obtained from WT embryos and MZoep embryos and kept in culture for 60 min. Values are shown as Tukey box-and-whiskers plots with median (bar) and average values (cross). n (WT), 6; n(MZoep), 6; 2 independent experiments each. (D) EGFP-Smad2 nuclear-to-cytoplasmic (N/C) ratios for cell doublets (D) and single cells (S) taken from MZoep embryos expressing EGFP-Smad2 and H2B-BFP after exposure to Activin for 3h and kept in culture in the presence of Activin for 60 min after FACS isolation (equivalent to MZoep A+/A+ condition in Figure 2D). Values are shown as Tukey box-and-whiskers plots with median (bar) and average values (cross). n (single cells), 21; n (doublets), 14; 2 independent experiments. Statistical test, Student t test, two tailed; P values,*< 0.05. (E) FACS sorting strategy: mesendoderm (ppl) cells were obtained from 6 hpf Tg(gsc::tRFP) embryos injected with ndr2-GFP mRNA (100 pg/embryo) at the one-cell stage and sorted into 2 groups according to their Ndr2-EGFP expression levels. The scatter plot shows the correlation between gsc::tRFP and Ndr2-EGFP signal. Cells in Q4 are positive for both signals. FACS recording for one representative experiment. (F) Cell size control: the forward scattering signal (FCS-A) shows there is no cell size difference between cells expressing low (1) and high (2) levels of Ndr2-EGFP. FACS recording for one representative experiment. (G) Mean EGFP intensity of mesendoderm progenitor cells isolated from Tg(gsc::mEGFP) expressing either low (1 pg) or high (100 pg) levels of ndr2 mRNA and transplanted in the animal pole of host embryos at 6 hpf. Mean EGFP intensity was measured 120 minutes after transplantation at 75% epiboly stage (8 hpf). Values are shown as Tukey box-and-whiskers plots with median (bar) and average values (cross). n (1 pg), 27; n (100 pg), 26; 2 independent experiments each. Statistical test, Mann Whitney t test, two tailed. P value: ***<0.001. See also Figure 2 and 3. |
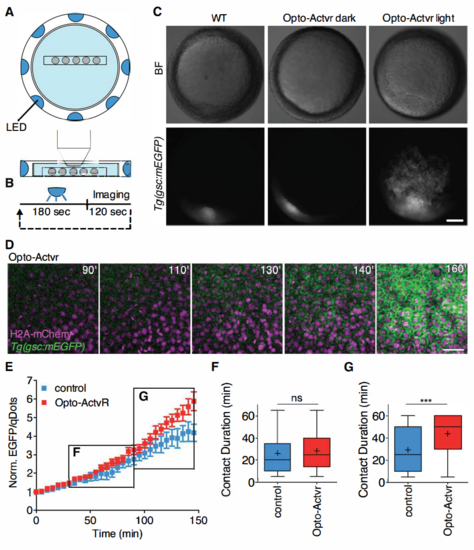
Light activation of Opto-Actvr expressing ppl progenitor cells. Related to Figure 4. (A) Schematic representation of the LED illumination system coupled to a multi-photon imaging setup. (B) LED illumination was remotely controlled. The sample was exposed to LED light for 180 sec, followed by multi-photon imaging for 120 sec. These cycles were repeated for a period of 160 min. (C) Stereoscope images of Tg(gsc::mEGFP) embryos ubiquitously expressing Opto-Actvr. WT Tg(gsc::mEGFP) or Tg(gsc::mEGFP) embryos injected with mRNA encoding for Opto-Actvr were imaged from sphere stage (3 hpf) to shield stage (6 hpf) with a multi-photon microscope coupled to a LED illumination system. Control Tg(gsc::mEGFP) embryos injected with mRNA encoding for Opto-Actvr were kept in a light tight box for the duration of the experiment (Opto-Actvr dark). Images were taken at shield stage (6 hpf). Scale bar, 100 μm. (D) Representative images of a time-lapse recording of a Tg(gsc::mEGFP) embryo ubiquitously expressing Opto-Actvr and H2A-mCherry. Images were taken between sphere stage (3 hpf) and shield stage (6 hpf) with alternating LED illumination and multi-photon imaging. Animal pole views with cells ectopically expressing gsc::mEGFP. Scale bar, 40 μm (E) gsc::EGFP expression in ppl cells transplanted from Tg(gsc::mEGFP) embryos injected with mRNA encoding for a chemically-activated form of Actvr1 together with qDots and dextran-cascadeblue (control cells) or mRNA encoding for a light-activated form of Actvr1 together with qDtos (Opto-Actvr1 cells) into similar staged WT Tg(gsc::mEGFP) host embryos. Transplantation was performed at shield stage (6 hpf) and images were taken between 60% epiboly stage (6.5 hpf) and 90% epiboly stage (9hpf). Average EGFP/qDots ratios were computed for each cell, normalized on the first imaging time point and plotted as a function of time. n (control cells), 14; n (Opto-Actvr1 cells), 13; 2 independent experiments. (F-G) Cell-cell contact persistence in transplanted ppl cells. Ppl progenitor cells were transplanted from Tg(gsc::mEGFP) embryos injected with either mRNA encoding for a chemically-activated form of Actvr1 together with qDots and dextran-cascadeblue (control cells) or mRNA encoding for a light-activated form of Actvr1 together with qDtos (Opto-Actvr1 cells) into similar staged WT Tg(gsc::mEGFP) embryos. Transplantation was performed at shield stage (6 hpf) and images were taken between 60% epiboly stage (6.5 hpf) and 90% epiboly stage (9hpf). (F) Cell-cell contacts formed between transplanted ppl donor cells and host cells were tracked between 65% epiboly stage (7 hpf) and 80% epiboly (8 hpf) stages. Values are shown as Tukey box-and-whiskers plots with median (bar) and average (cross) values. n (control), 173; n (Opto-Actvr), 146; 2 independent experiments. (G) Cell-cell contacts formed between transplanted ppl donor cells and host cells were tracked between 80% epiboly (8hpf) and 90% epiboly stages (9 hpf). Values are shown as Tukey box-and-whiskers plots with median (bar) and average (cross) values. n (control), 159; n (Opto-Actvr), 113; 2 independent experiments. Statistical test, Mann Whitney t-tes; P values, ***< 0.001, ns = not significant. |
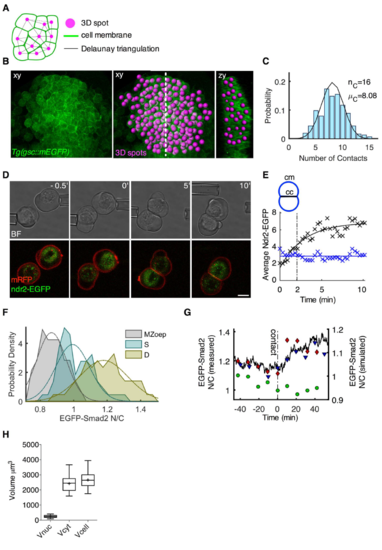
Experiments to parametrize the mathematical model. Related to Figure 5. (A-C) Quantification of cell-cell contact number within the ppl in vivo. (A) A Delaunay triangulation was computed using 3D coordinates of spots objects and used to infer the number of cell-cell contacts (direct neighbours) of each cell. All edges whose midpoint was closer to another vertex than it was to one of its end vertices were eliminated from the triangulation (dotted edge). (B) Multi-photon images of the ppl of Tg(gsc::mEGFP) embryos at 65% epiboly stage (7 hpf). A 3D spot object was created at the center of each ppl cell, shown in magenta. (C) Probability distribution of ppl cells as a function of their number of cell-cell contacts in vivo. Black curve shows the prediction of our cellular model with a maximum and an average number of contacts of 16 and 8.08, respectively. (D-E) Dynamics of Nodal accumulation at cell-cell contact sites. (D) Bright-field and confocal images of cell-cell contact formation between ppl progenitor cells in culture. Induced ppl progenitor cells were isolated from shield stage (6 hpf) embryos expressing Ndr2-EGFP and membrane-bound RFP (mRFP). Cell-cell contact formation was initiated by gently bringing two cells together using micropipettes, and the newly formed cell doublet was imaged over a period of 10 min at 30 sec intervals. Scale bar, 5 μm (E) Example of Ndr2-EGFP localization in a newly formed ppl cell doublet. Average Ndr2-EGFP intensities at the cell-cell (cc, black crosses) and cell-medium (cm, blue crosses) interfaces were measured independently and plotted as a function of time. The increase in Ndr2-EGFP intensities at the cell-cell interface is best described by an exponential fit (black curve), reaching the half-maximum after 2 min. Ndr2-EGFP intensity remains largely unchanged at the cell-medium interface (blue line). (F) EGFP-Smad2 nuclear-to-cytoplasmic (N/C) ratios of embryonic progenitor cells in culture. Embryonic progenitor cells were isolated via FACS from shield stage (6 hpf) MZoep mutant embryos expressing EGFP-Smad2 and H2A-mCherry. Ppl progenitor cells were isolated via FACS from shield stage (6 hpf) Tg(gsc::tRFP) embryos also expressing EGFP-Smad2 and H2B-BFP. n (MZoep), 14; n (single cells), 22; n (doublets), 21; 3 independent experiments. (G) Changes in EGFP-Smad2 nuclear-to-cytoplasmic ratio upon cell-cell contact formation in three cells. Ppl progenitor cells were isolated via FACS from shield stage (6 hpf) Tg(gsc::tRFP) embryos also expressing EGFP-Smad2 and H2B-BFP, and EGFP-Smad2 nuclear-to-cytoplasmic ratios were measured before and after contact formation. The ratios of the 3 analyzed cell doublets are shown as red diamonds, black triangles and green dots. Note that in 1 (green dots) of the 3 doublets, the EGFP-Smad2 nuclear-to-cytoplasmic ratio did not change upon contact formation. Black dash-dotted line shows time of contact formation, and black curve the Smad2 dynamics of a realization of the stochastic model (see also STAR Methods). Note the different scalings of the y-axis used for the simulated (right y-axis) and measured data (left y-axis) due to higher than average EGFP-Smad2 nuclear-to-cytoplasmic ratios in the measured cells at the beginning of the analysis. (H) Volumes of ppl cells in culture. Ppl progenitor cells were isolated via FACS from shield stage (6 hpf) Tg(gsc::tRFP) embryos expressing also H2B-BFP and nuclear (Vnuc), cytoplasmic (Vcyt) and whole cell (Vcell) volumes were measured after 60 min in culture. Values are shown as Tukey box-and-whiskers plots with median (bar) and average (cross) values. n, 21. |
Reprinted from Developmental Cell, 43(2), Barone, V., Lang, M., Krens, S.F.G., Pradhan, S.J., Shamipour, S., Sako, K., Sikora, M., Guet, C.C., Heisenberg, C.P., An Effective Feedback Loop between Cell-Cell Contact Duration and Morphogen Signaling Determines Cell Fate, 198-211.e12, Copyright (2017) with permission from Elsevier. Full text @ Dev. Cell