
- Title
-
Zebrafish knockout of Down syndrome gene, DYRK1A, shows social impairments relevant to autism.
- Authors
- Kim, O.H., Cho, H.J., Han, E., Hong, T.I., Ariyasiri, K., Choi, J.H., Hwang, K.S., Jeong, Y.M., Yang, S.Y., Yu, K., Park, D.S., Oh, H.W., Davis, E.E., Schwartz, C.E., Lee, J.S., Kim, H.G., Kim, C.H.
- Source
- Full text @ Mol Autism
Generation of dyrk1aa KO zebrafish and microcephaly phenotype analysis. a Schematic representation of the genomic structure of dyrk1aa and a 7 bp deletion generated by gene targeting with TALEN. b Predicted structures of WT and dyrk1aa KO mutant proteins in zebrafish. The 7 bp deletion resulted in a frame-shift mutation and premature termination at the kinase domain. c, d Similar brain size in WT (c) and KO fish (d) is seen at the 2-week-old stage. Fluorescent live neurons are visible in the genetic background of HuC:eGFP transgenic zebrafish. Anterior to the left, dorsal view. Scale bars 0.2 mm. e – j Sections of a 3-week-old zebrafish head region were immuno-stained with an antibody against activated caspase-3. Coronal sections at the level of the eye: bright-field image (e, h) and fluorescent image (f, g, i, and j). g, j Magnification of inset in (f, i). Arrows indicate caspase-3 positive cells in the brain. Scale bars 0.2 mm. k The number of caspase-3 positive cells is increased in the brain of KO fish. Five animals for each WT and KO fish were used for the analysis. Data are presented as mean ± SEM. * p < 0.05 by Student’s t test. l, m Pictures of adult WT and KO zebrafish. dyrk1aa KO zebrafish were normal in body length and overall morphology except for a reduction of brain size. Arrowheads indicate the position of the brain in the head region. Scale bars 5 mm. n, o Photograph of dissected brains from WT and KO zebrafish, showing microcephaly phenotype in KO zebrafish. Anterior olfactory bulbs were positioned at the left, ventral view. Scale bars 0.4 mm. p, q Confirmation of microcephaly phenotype in KO zebrafish by histological examination. Dashed line in n and o indicates the relative section position used in p and q. Brain sections were stained with H&E. KO zebrafish brain had wider ventricle space than WT zebrafish. Arrows point to TeV. Scale bars 0.4 mm PHENOTYPE:
|
Novel tank assay showing anxiolytic behavior in dyrk1aa KO zebrafish. a An illustration of a novel rectangular tank. Dashed lines indicate the boundaries of three vertically different zones (top, middle, and bottom). b, c Representative images of zebrafish behavior in the early time phase (1–5 min). dyrk1aa KO zebrafish display reduced anxiety-like phenotype, swimming more time in middle and top zones. d–f Duration per minute in each zone. Upon introduction to the novel tank, zebrafish display a preference to remain at the bottom zone. dyrk1aa KO fish spent significantly less times in this zone, compared to WT siblings. Black line for WT and gray line for dyrk1aa KO zebrafish. Number of fish used in this assay: n = 8 for WT fish, n = 8 for KO fish, respectively. Data are presented as mean ± SEM. * p < 0.05, ** p < 0.01, *** p < 0.001 by Student’s t test PHENOTYPE:
|
Social interaction assay showing impaired social behavior in dyrk1aa KO zebrafish. a Here, three fish were used as a social cue against a tester fish. Bold dashed line indicates the position of the separator in the water tank. Three narrow dashed lines indicate the boundaries of four different zones (I, II, III, and IV) in the moving space of the tester fish, ranging from the most proximal to the most distal, respectively from the social cue fish group. Arrows indicate the transition of tester fish between zones. b, c Video tracking of 5-min movements of WT or dyrk1aa KO fish, showing the social interaction with the social cue. d Duration time for tester fish in each different zone. Black bars for WT fish and white bars for KO mutant fish. e Number of transit movements of tester fish at each zone boundary; movement from “I” to “II”, “II” to “III”, and “III” to “IV” zone. Number of tester fish used in this assay: n = 30 for WT fish, n = 30 for KO fish, respectively. Data are presented as mean ± SEM. * p < 0.05, ** p < 0.01, *** p < 0.001 by Student’s t test PHENOTYPE:
|
In situ hybridization of c-fos and crh in the brain of KO and WT fish. a–d Detection of c-fos mRNA expression in the dissected brain of WT (a, b) and KO (c, d) fish. Induction of strong c-fos expression is seen in specific brain regions (white asterisk) in WT fish (b) during social interaction, compared to that in KO fish (d). Higher expression of c-fos is observed in the diffuse nucleus of the inferior lobe (DIL) in the KO fish brain. fb, forebrain; mb, midbrain; hb, hindbrain; hy, hypothalamus. Ten animals for each WT and KO fish analysis were used. e–h Detection of crh expression in the brain of WT (e, f) and KO (g, h) fish. After acute social isolation for 24 h, crh-expressing cells are slightly reduced in preoptic area (PO, black asterisk) in KO fish (h), compared to that of WT fish (f). Eight animals for each WT and KO fish analysis were used. Anterior to the top and ventral view. b, d, f, and h Magnification of the ventral hypothalamic region boxed in a, c, e, and g. Scale bars 0.2 mm (a, c, e, and g), 0.76 mm (b, d), and 0.94 mm (f, h) |
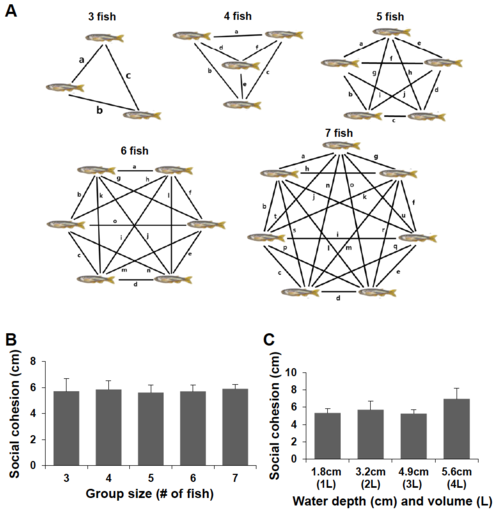
dyrk1aa KO zebrafish show impaired social behavior in the shoaling assay. a Schematic description of the “mini shoal” formed at the ridge of water body in a flat and round bowl. b–f Snapshots of shoaling behavior in a group of WT fish, ranging from three to seven fish/group. In most cases, the WT fish group showed “social cohesion” moving together along the narrow space of “mini shoal” in the round bowl. g A snapshot of group behavior during the shoaling assay. Three fish were used as a group in this assay. Arrows indicate individual adult fish. h Mean distance between individuals (cm) was used to show the degree of social cohesion. The dyrk1aa KO fish group showed “loosened” social cohesion, compared to WT fish. Number of trials for this experiment: n = 10. Data are presented as mean ± SEM. *** p < 0.001 by Student’s t test PHENOTYPE:
|
Tracking of individual fish in a group of five fish show impaired social cohesion in KO fish. a–d Movement of a group of five fish was analyzed after video tracking. The position of individual fish during short periods of 1.5 s at two different time windows (5 and 10 min, respectively) was traced, and their path was presented in different colors (#1 fish in red, #2 fish in green, and so on). Aggregation of WT fish group in a corner of tank is apparent (a, c), compared to independent free swimming of individual KO fish (b, d) PHENOTYPE:
|
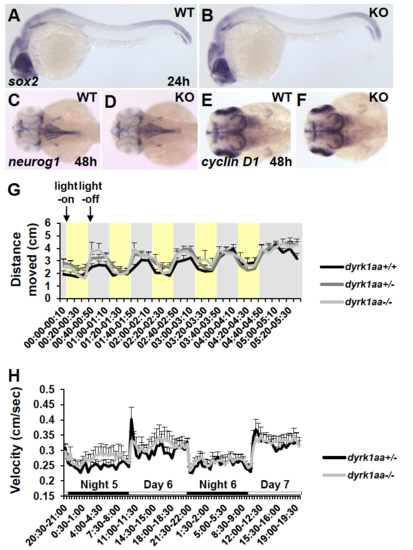
Characterization of early neural development and larval behavioral tests in WT and dyrk1aa KO fish. (A-F) Whole-mount in situ hybridization analysis with various molecular markers at 24 hpf (A, B, lateral view) and 48 hpf (C-F, rostral dorsal view): sox2, neural stem cell marker; neurog1, neuronal determination marker; and cyclin D1, cell proliferation marker. Anterior is to the left. Number of fish used for the analysis: 1) after sox2 staining and photography, each embryo was genotyped for WT (5/19) and KO homozygote (3/19); 2) for neurog1, it was WT (6/16) and KO homozygote (4/16); and 3) for cyclin D1, WT (3/16) and KO homozygote (5/16), respectively. (G) Locomotion response to dark flashes in WT and dyrk1aa KO larvae at 6 dpf. Movement distance was measured by video tracking analysis (cm per every 10 s). With light-on in 30 s-intervals, zebrafish larvae showed a freezing response (yellow box in the graph). However, they showed a startle response to light-off dark condition (gray box). The number of fish used for this assay: n = 14 for WT (+/+), n = 25 for heterozygote (+/−), and n = 9 for KO homozygote (−/−). (H) Circadian rhythms in WT and dyrk1aa KO larvae between 5 and 7 dpf. Circadian rhythms of locomotor activity under LD (day-night) cycles were measured. Both WT and dyrk1aa KO larvae display a similar pattern of locomotor activity in daytime or nighttime. The number of fish used for this assay: n = 11 for control heterozygote (+/−), and n = 13 for KO homozygote (−/−). Data are presented as mean ± SEM. (PDF 1219 kb) |
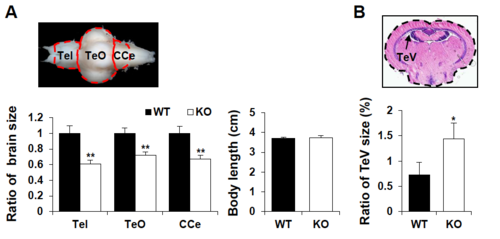
Comparison of brain size in WT and dyrk1aa KO fish. (A) Relative size of brain compartments in KO fish brain was shown as a ratio, compared to those in WT fish brain. Also, body length (cm) of WT and KO fish used for this analysis was constant. Tel, Telencephalon; TeO, Tectum Opticum; CCe, Corpus Cerebelli. Number of dissected brains: n = 13 for WT fish and n = 13 for KO fish. (B) Percent of TeV space in the total brain. Mean value for the TeV sizes was measured in relative sections of multiple brain samples. Number of fish used for this assay: n = 6 for WT fish and n = 5 for KO fish. Data are presented as mean ± SEM. * p < 0.05, ** p < 0.01 by Student’s t test. (PDF 1033 kb) PHENOTYPE:
|
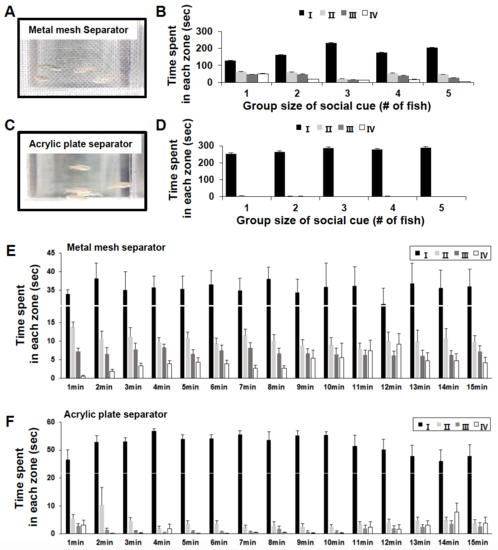
Schematic illustration of the social interaction assay with different separation materials. (A-F) Two kinds of materials were used for the separator: metal mesh (A, B, and E) and a clear acrylic plate (C, D, and F). (B, D) Changes of duration time for tester fish, when added to a different number of fish (1–5 fish) as the social cue group, was analyzed in 4 different zones between 6 and 10 min. Multiple trials (n = 5) were performed for each group size. (E, F) Detailed information for duration time for tester fish in different zones over the course of 15 min. Data are presented as mean ± SEM. (PDF 1033 kb) |
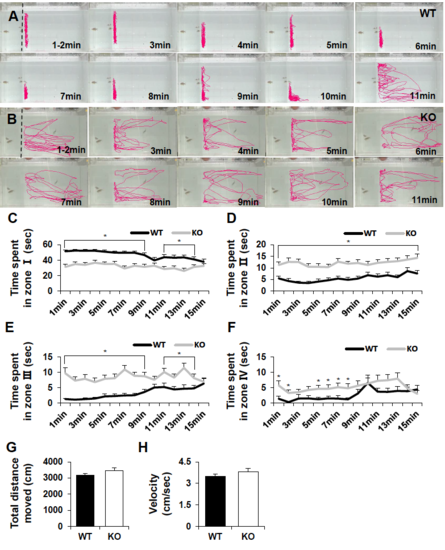
Analysis of various parameters in social interaction assay. (A, B) Video tracking of WT and dyrk1aa KO zebrafish in the social interaction assay. Dashed lines indicate position of a separator and a transparent acrylic plate was used in this experiment. Red lines show tracking of swim movement of WT and KO zebrafish. Fish were tracked every minute for 15 min during the social interaction assay. In this experiment, 3 fish were used as the social cue group in left side and 1 tester fish in right side. (C-F) Duration time for WT and dyrk1aa KO zebrafish in each zone; very close zone “I” (C), close zone “II” (D), far zone “III” (E), and very far zone “IV” (F). (G, H) Total distance moved (cm) and mean velocity (cm/s) are no different in both WT and KO fish during the test. Data were collected from video tracking for 15 min and every minute was analyzed. Number of tester fish used in the assay: n = 30 for WT and n = 30 for KO. Data are presented as mean ± SEM. * p < 0.05 by Student’s t test. (PDF 1029 kb)
|
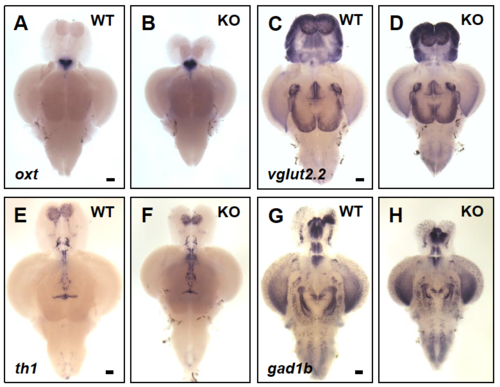
Presence of neuromodulator producing cells in the brain of WT and dyrk1aa KO zebrafish. (A-H) Expression of oxt, th, vglut2.2, and gad1b in the brain of WT and dyrk1aa KO zebrafish at adult stages. In situ hybridization revealed dyrk1aa KO fish show unchanged neuromodulator-producing cells in the brain. (A, B) oxt, oxytocinergic marker. (C, D) vglut2.2, glutamatergic marker. (E, F) th1, dopaminergic marker. (G, H) gad1b, GABAergic marker. Anterior to the top and ventral view. Scale bars: 0.2 mm. (PDF 1051 kb) |
Presence of neuromodulator producing cells in the brain of WT and dyrk1aa KO zebrafish. (A-H) Expression of oxt, th, vglut2.2, and gad1b in the brain of WT and dyrk1aa KO zebrafish at adult stages. In situ hybridization revealed dyrk1aa KO fish show unchanged neuromodulator-producing cells in the brain. (A, B) oxt, oxytocinergic marker. (C, D) vglut2.2, glutamatergic marker. (E, F) th1, dopaminergic marker. (G, H) gad1b, GABAergic marker. Anterior to the top and ventral view. Scale bars: 0.2 mm. (PDF 1051 kb) |

Unillustrated author statements PHENOTYPE:
|