- Title
-
Re-evaluating functional landscape of the cardiovascular system during development
- Authors
- Takada, N., Omae, M., Sagawa, F., Chi, N.C., Endo, S., Kozawa, S., Sato, T.N.
- Source
- Full text @ Biol. Open
|
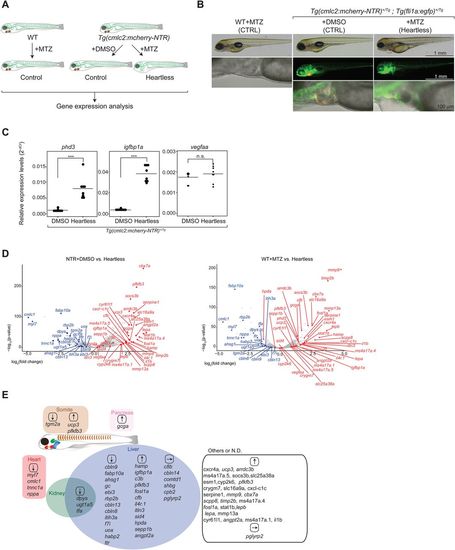
Characterization of ‘heartless’. (A). Schematic description of the ‘heartless’ model and the experimental strategy. (B). Specific absence of cardiomyocytes in ‘heartless’. Scale bars: 1 mm (top); 1 mm (middle); 100 µm (bottom). Red, cardiomyocytes; green, vECs and endocardium. Bright-field/DIC images are shown for WT-MTZ as they do not carry a fluorescent reporter. (C). qRT-PCR analysis of pan-hypoxia indicator genes in ‘heartless’. ***P<0.001; n.s., not significant. n=8 for both Tg(cmlc2:mcherry-NTR)+DMSO and ‘heartless’. (D). Volcano plot representing the differentially expressed genes in ‘heartless’, as compared to Tg(cmlc2:mcherry-NTR)+DMSO (NTR+DMSO) (left) and WT+MTZ (right). n=2. Up- and downregulated genes (as also confirmed by qRT-PCR, see Table S1) are highlighted in red and blue, respectively. (E). Organ-specific expression patterns of differentially expressed genes in ‘heartless’. They are placed in each organ. Up- and downregulated genes are indicated by ↑and ↓, respectively. Some of the genes unaffected in ‘heartless’ are also included and indicated by →. Many of the liver-specific genes were also confirmed by whole-body transcriptome analysis of the liver-ablated larvae (‘liverless’) (Fig. S3). |
|
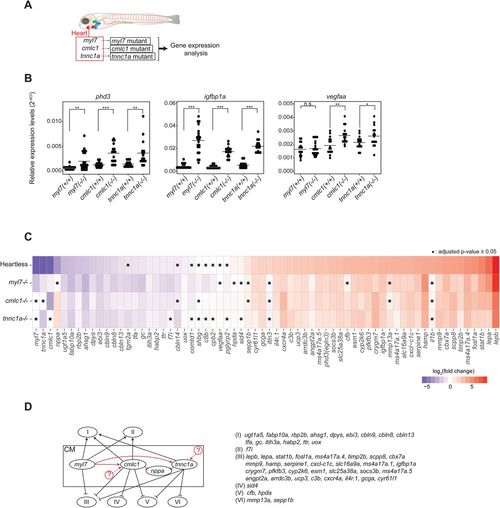
Characterization of cardiomyocyte-specific gene mutants. (A). Schematic description of the cardiomyocyte-specific gene mutant models and the experimental strategy. (B). qRT-PCR analysis of pan-hypoxia indicator genes in each mutant. *P<0.05; **P<0.01; ***P<0.001; n.s., not significant. Student’s t-test. n=16 (WT siblings), 22 (myl7−/−), 16 (cmlc1−/−), 16 (tnnc1a−/−). (C). Heatmap representing the expression patterns of each gene in each mutant. ▪P≥0.05, Student’s t-test followed by Benjamini-Hochberg procedure to correct errors for the multiple tests. n=16-22. (D). Genetic interactions among mutants. See the text for the detailed description of each category. Black arrows and lines indicate interactions between cardiomyocytes and noncardiac organs. Red arrows and lines indicate intracardiac interactions. The possibility of yet unidentified upstream regulators of cmlc1 and/or tnnc1a is indicated by circled question marks. |
|
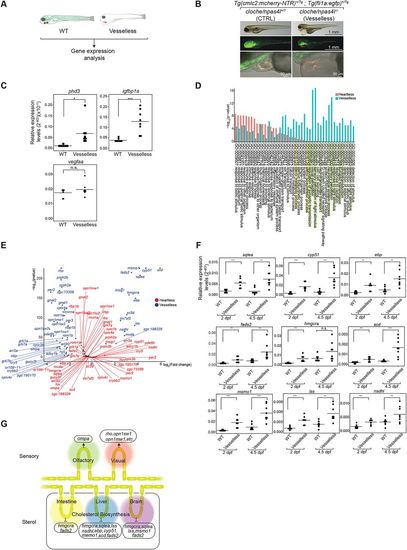
Characterization of ‘vesselless’. (A). Schematic description of the ‘vesselless’ model and the experimental strategy. Green, vECs, endocardium and hematopoietic cells; red, cardiomyocytes. (B). Specific absence of hematovascular cells (i.e. vECs, endocardium, hematopoietic cells) in ‘vesselless’. Green, vECs and endocardium; red, cardiomyocytes. Scale bars: 1 mm (top); 1 mm (middle); 50 µm (bottom). (C). qRT-PCR analysis of pan-hypoxia indicator genes in ‘vesselless’. *P<0.05; ***P<0.001; n.s., not significant. Student’s t-test. n=8 (WT siblings), 8 (‘vesselless’). (D). GO enrichment analysis of ‘vesselless’ (blue) and ‘heartless’ (red). The top 44 GO terms are shown. Highlighted are neural/sensory (green) and sterol (yellow)-related GOs. (E). Volcano plot representing differentially expressed genes in ‘vesselless’. Shown are genes that are specifically affected in ‘heartless’ (red) and in ‘vesselless’ (blue). n=2. (F). qRT-PCR analysis of cholesterol biosynthesis genes. **P<0.01; ***P<0.001. n.s., not significant. Student’s t-test. n=8 (WT siblings), 7 (‘vesselless’ at 2 dpf), 8 (‘vesselless’ at 4.5 dpf). (G). Summary of differentially expressed genes in ‘vesselless’. |
|
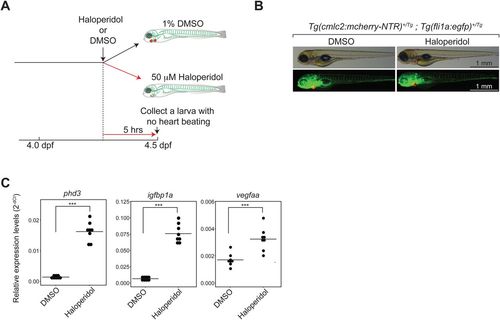
Characterization of a cardiotoxin-treated model. (A). Schematic description of a cardiotoxin-treated model and the experimental strategy. (B). Presence of cardiomyocytes and hematovascular cells in the model. Green, hematovascular cells; red, cardiomyocytes. Scale bars: 1 mm. (C). qRT-PCR analysis of pan-hypoxia indicator genes. ***P<0.001. Student’s t-test. n=8 (DMSO-treated control), 8 (Haloperidol-treated). |

ZFIN is incorporating published figure images and captions as part of an ongoing project. Figures from some publications have not yet been curated, or are not available for display because of copyright restrictions. |
|
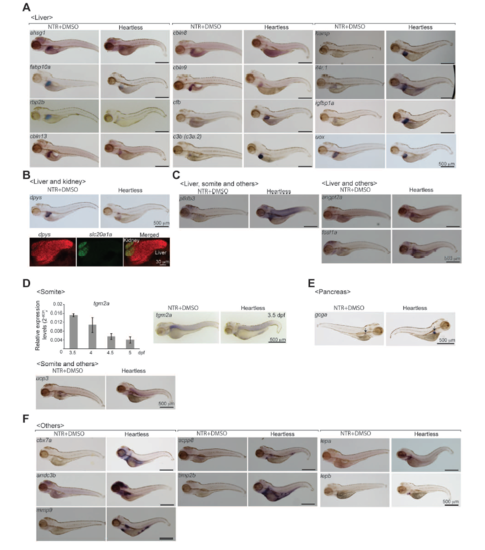
WISH expression patterns of the genes differentially expressed in “heartless”. The patterns are shown for Tg(cmlc2:mcherry-NTR) treated by DMSO (NTR+DMSO) and “heartless” larvae at 4.5 dpf for each gene. A. Liver genes. B. Liver/kidney genes. The renal expression of dpys in 4.5 dpf larva is shown by co-staining with a marker for proximal convoluted tubule, slc20a1a. C. Genes expressed in the liver/somite/others (pfkfb3) and the liver/others (angpt2a and fosl1a). D. Somite gene. qRT-PCR result (top graph) shows the higher expression of tgm2a at 3.5 dpf. E. Pancreas gene. F. Genes expressed in undefined tissues/organs (Others). Scale bars, 500 μm. |
|
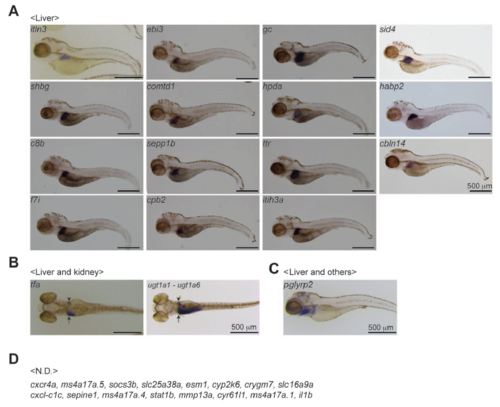
WISH expression patterns of the other genes. A. Liver genes. B. Genes expressed in both the liver and kidney. C. Genes expressed in the liver and tissues/organs that are undefined (Others). D. Genes whose expressions are not determined (N.D.). Scale bars, 500 μm. |
|
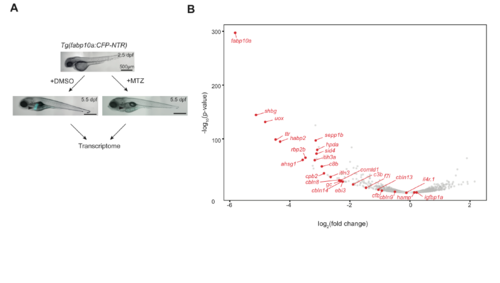
Liver genes. A. Generation of “liverless”. Scale bars, 500 μm. Arrowheads denote fluorescent (Cyan) liver. B. Volcano plot of the body-wide transcriptome data of “liverless” showing the liver genes (red). Their expression was significantly reduced in “liverless”, except two genes (igfbp1a and hamp). However, their expression in the liver was confirmed by WISH (Fig. S1A). It is possible that they are upregulated in the small residual liver tissues in “liverless”. |
|
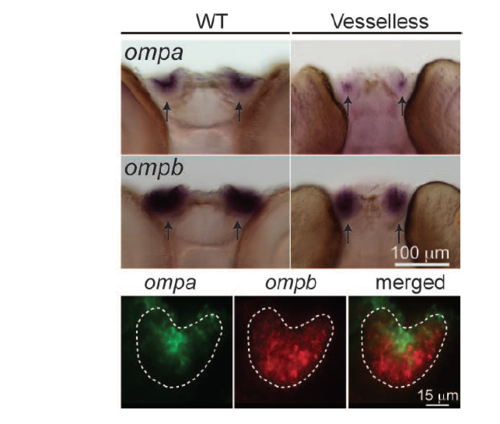
Ompa is expressed in a sub-domain of the olfactory bulb. WISH patterns of olfactoryspecific genes, ompa and ompb. Scale bar, 100 μm. Double WISH staining for ompa and ompb (bottom). Green: ompa. Red: ompb. Scale bar, 15 μm. Dotted white line, olfactory epithelium. |
|
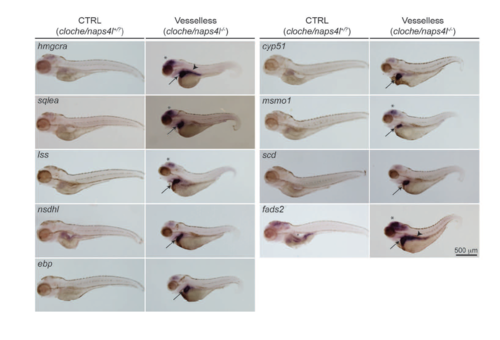
Expression patterns of genes encoding cholesterol biosynthesis. WISH patterns for each gene are shown. Arrows: Liver. Arrowheads: Intestine. *: Brain. Scale bar, 500 μm. |
|
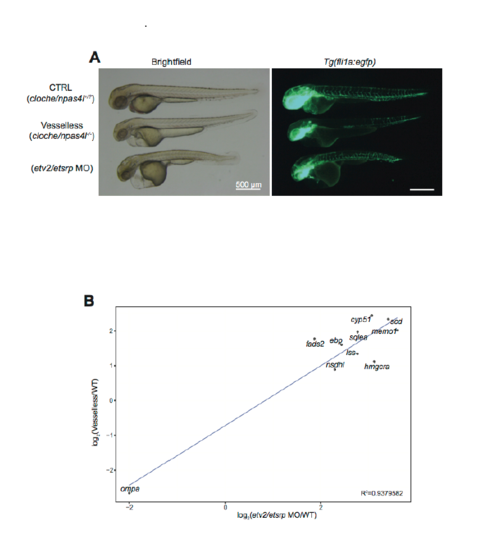
Characterization of etv2/etsrp morphant. A. Reduced vasculature in etv2/etsrp morphant. The vasculature of cloche/npas4l+/?, cloche/npas4l-/- (i.e., “vesselless”) and etv2/etsrp morphant is compared by fli1a:egfp signals. Scale bars, 500 μm. B. Correlational plot of “vesselless” and etv2/etsrp morphant (etv2/etsrp MO). R2=0.9379582. n=19 (WT), n=26 (MO), n=8 (“vesselless”), n=8 (sibling control). |

