
- Title
-
Biochemical adaptations of the retina and retinal pigment epithelium support a metabolic ecosystem in the vertebrate eye
- Authors
- Kanow, M.A., Giarmarco, M.M., Jankowski, C.S., Tsantilas, K., Engel, A.L., Du, J., Linton, J.D., Farnsworth, C.C., Sloat, S.R., Rountree, A., Sweet, I.R., Lindsay, K.J., Parker, E.D., Brockerhoff, S.E., Sadilek, M., Chao, J.R., Hurley, J.B.
- Source
- Full text @ Elife
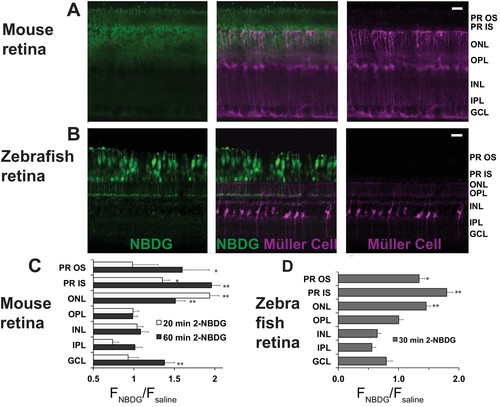
(A) 2-NBDG (green) accumulation in a mouse retina 20 min after oral gavage. MGCs are identified by tdTomato expression in cells in which the Rlbp1 promoter is active. (B) 2-NBDG accumulation in a zebrafish retina 30 min after oral gavage. MGCs are identified by tdTomato expressed from the GFAP promoter. Labels on the right of panels A and B represent approximate positions of the retinal layers, (C) Quantification of 2-NBDG fluorescence from mouse retinas (n = 5 animals, 17 slices for 20 min 2-NBDG; three animals, 8 slices for 1 hr 2-NBDG; three animals, eight slices for saline). FNBDG/Fsaline compares fluorescence from retinas of mice gavaged with 2-NBDG vs. with saline. Error bars report SEM. (D) Quantification of 2-NBDG fluorescence from zebrafish retinas (three animals, 8 slices for 30 min 2-NBDG; two animals, three slices for saline). PR OS, photoreceptor outer segments; PR IS, photoreceptor inner segments; ONL, outer nuclear layer; OPL, outer plexiform layer; INL, inner nuclear layer; IPL, inner plexiform layer; GCL, ganglion cell layer. Scale bars represent 20 μm. * indicates p<0.05 and ** indicates p<0.01 for the comparison of FNBDG to Fsaline. |