
- Title
-
A chemical screen in zebrafish embryonic cells establishes that Akt activation is required for neural crest development
- Authors
- Ciarlo, C., Kaufman, C.K., Kinikoglu, B., Michael, J., Yang, S., D Amato, C., Blokzijl-Franke, S., den Hertog, J., Schlaeger, T.M., Zhou, Y., Liao, E., Zon, L.I.
- Source
- Full text @ Elife
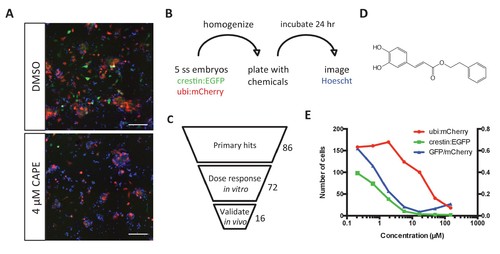
Chemical screening in zebrafish embryonic cell cultures identifies inhibitors of neural crest development. (A) CAPE decreases crestin:EGFP+ cells in culture while leaving ubi:mCherry+ cells unchanged. Scale bar: 100 μm. Characterization of cultured crestin:EGFP+ cells is shown in Figure 1—figure supplement 1. (B) Chemical screen design. Whole embryos were mechanically homogenized and plated on standard tissue culture coating in neural crest medium with chemicals. After 24 hr of culture, Hoechst 33342 was added to stain nuclei before imaging. (C) Screen hits were validated in the primary screen assay and tested for an effect on crestin:EGFP expression in vivo. (D) Structure of CAPE. (E) CAPE shows a greater than 10-fold selectivity for crestin:EGFP+ cells versus ubi:mCherry+ cells in vitro. |
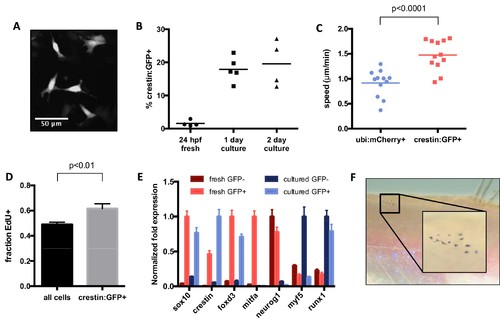
Characterization of cultured crestin:EGFP+ cells. (A) Cell size and morphology visualized by crestin:EGFP. (B) Percentage of crestin:EGFP+ cells determined by FACS. Bars indicate mean and points indicate independent experiments. (C) Crestin:EGFP+ cells are more migratory than a random population of cells. Points indicate individual cells in a single experiment. (D) Crestin:EGFP+ cells are slightly more proliferative than the culture average, as determined by EdU staining after 4 hr of EdU treatment. Mean and standard deviation of three frames from the same experiment are shown. Similar results were obtained in two independent experiments. (E) Crestin:EGFP+ cells cultured for 24 hr express neural crest genes comparable to freshly isolated (24 hpf) crestin:EGFP+ cells and do not express markers of more differentiated tissues. Gene expression was determined by qPCR and normalized to β-actin. The highest expressing sample for each group was assigned a value of 1. Average and standard deviation of three technical replicates are shown. Myf5 and runx1 are negative controls. Results are representative of three independent experiments. (F) Crestin:EGFP+ cells form pigmented melanocytes in vivo. Cells were sorted for crestin:EGFP after two days of culture and injected under the scale of a casper fish lacking endogenous melanocytes. Pigmented cells were observed at 4 days post transplant in 4/8 EGFP+ transplants and 0/10 EGFP- transplants. Student’s t-test was used for statistical analyses. |
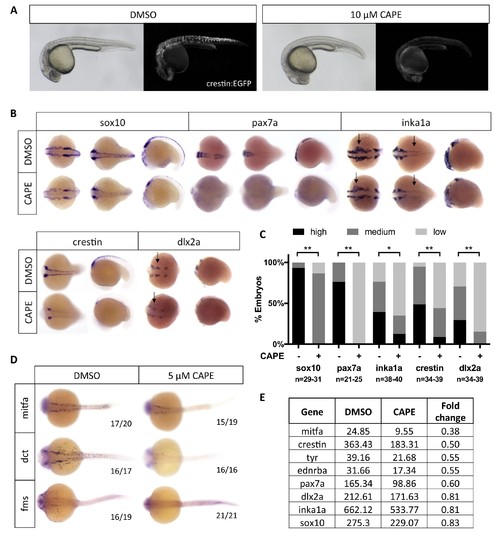
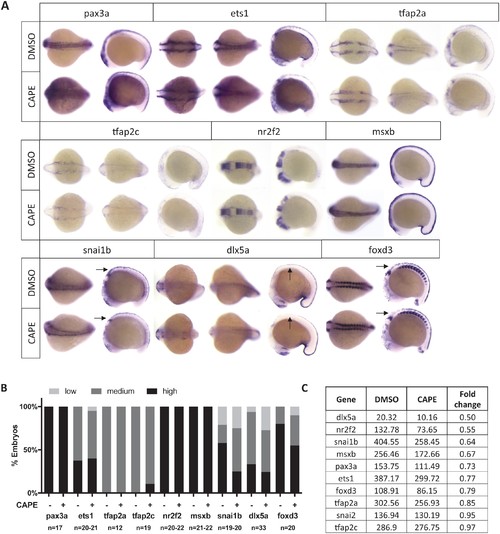
CAPE decreases neural crest gene expression. (A) CAPE dramatically reduces crestin:EGFP expression at 26 hpf. Figure 2—figure supplement 1 shows the response of a smaller (396 bp) crestin promoter fragment to CAPE and the timing of crestin response to CAPE. (B) CAPE decreases neural crest gene expression as determined by whole mount in situ hybridization (ISH) at 15–17 ss. Expression of some genes is decreased ubiquitously while others are only altered in specific anatomic locations (arrows). Images are representative of at least two independent experiments. (C) Scoring of ISH in (B). (D) CAPE reduces expression of pigment cell genes at 24 hpf. (E) FPKM values from RNA-sequencing of sox10:Kaede+ cells confirmed decreases in neural crest genes, though to a lesser extent than by ISH. Cells were sorted from control or CAPE-treated embryos at 17 ss. Figure 2—figure supplement 2 shows neural crest genes with no significant change by ISH. Figure 2—figure supplement 3 shows that a change in cell number does not account for neural crest gene expression changes. Figure 2—figure supplement 4 shows other gene expression changes in neural crest cells. *p<0.001, **p<0.0001, chi-square test. EXPRESSION / LABELING:
PHENOTYPE:
|
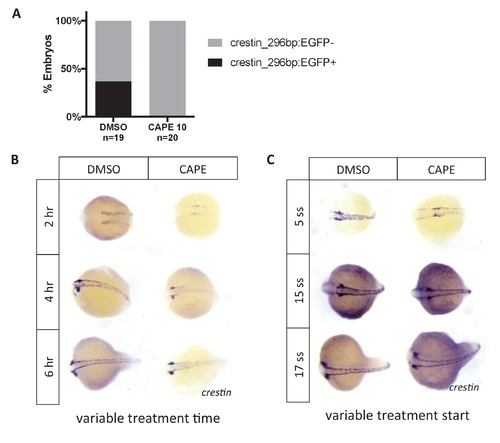
Crestin_296bp:EGFP expression in CAPE-treated embryos and time course of CAPE treatment. (A) CAPE decreases expression of crestin_296bp:EGFP. Embryos were treated at 2 ss and imaged at 24 hpf. A single clutch is shown. (B) CAPE reduces crestin expression within two hours of treatment. Embryos were treated at 2 ss for the indicated amount of time and fixed for ISH. (C) CAPE has no effect on crestin expression after 15 ss. Embryos were treated for 2 hr at the indicated developmental stage. |
Neural crest genes not significantly affected by CAPE treatment as determined by ISH. (A) Representative embryos from ISH. Images are representative of at least two independent experiments. Arrows point to regions with subtle decreases in expression. (B) Scoring of ISH in (A). Images with arrows were scored only in the region of interest. No statistically significant changes were observed in the genes listed (p>0.05, chi-square test). (C) Expression as determined by RNA-seq of sox10:Kaede+ cells. Some genes that appeared unchanged by ISH were decreased by RNA-seq. |
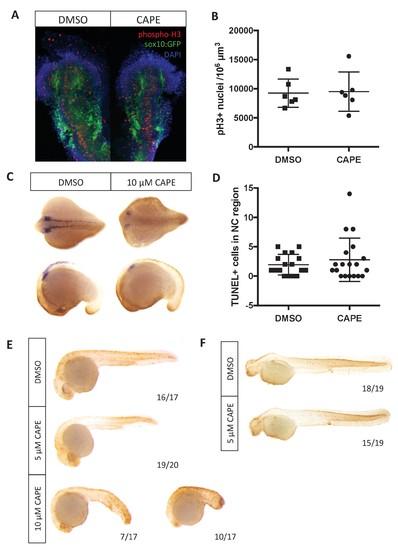
Changes in cell number do not explain reduced crestin expression in CAPE-treated embryos. Embryos were treated continuously starting at 2 ss. (A) CAPE does not affect proliferation of neural crest cells as determined by phospho-histone H3 in the sox10:GFP+ region of embryos. Flat mounts of representative embryos are shown. Results are representative of two independent experiments. (B) Quantification of images in (A). Images were quantified using Imaris. Bars indicate the average and SEM of 6 embryos per condition from the same clutch. (C) CAPE does not increase cell death in the neural crest region of embryos after 5–6 hr of treatment. Representative embryos show whole mount TUNEL (brown) and crestin ISH (purple). (D) Quantification of embryos in (C). Quantification was conducted manually. Average and standard deviation of two independent experiments are shown. (E) 10 μM but not 5 μM CAPE broadly increases cell death after 19 hr of treatment. (F) 5 μM CAPE does not substantially alter cell death at 48 hpf. |
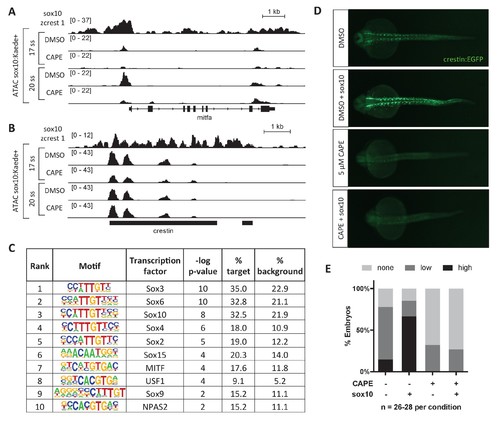
CAPE reduces Sox10 activity. (A) ATAC-seq was conducted on sox10:Kaede+ cells from DMSO- or CAPE-treated embryos at two stages. CAPE reduces chromatin accessibility at the mitfa promoter in sox10:Kaede+ cells, and Sox10 binds the mitfa promoter in a zebrafish tumor cell line. (B) Crestin binds Sox10 but does not show a change in chromatin accessibility with CAPE treatment. Bar indicates region of crestin sequence similarity (chr4:41,270,000). (C) HOMER analysis of 20 ss ATAC-seq peaks revealed an enrichment for Sox and MITF motifs when comparing unique peaks in DMSO-treated embryos (% target) to all peaks in CAPE-treated embryos (% background). (D) CAPE (5 μM) prevents sox10 RNA (30 pg) from increasing crestin:EGFP expression. (E) Quantification of experiment shown in (D). Sum of three clutches from two independent experiments is shown. Figure 3—figure supplement 1 shows that tfap2c RNA increases crestin:EGFP expression in both DMSO- and CAPE-treated embryos, and that the number of sox10:Kaede+ cells does not change with CAPE treatment. EXPRESSION / LABELING:
|
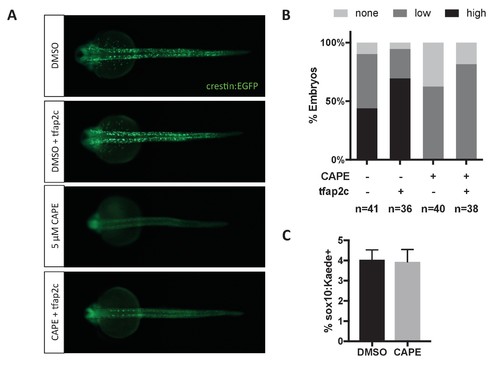
Tfap2c RNA injection (120 pg) increases crestin:EGFP expression in both control and CAPE-treated embryos. (A) Crestin:EGFP expression in representative embryos. (B) Embryos were scored as in Figure 3E. Sum of three clutches from two independent experiments is shown. (C) Based on flow cytometric analysis at 17 ss, the percentage of sox10:Kaede+ live cells does not change with CAPE treatment. Mean and standard deviation of three independent experiments is shown. |
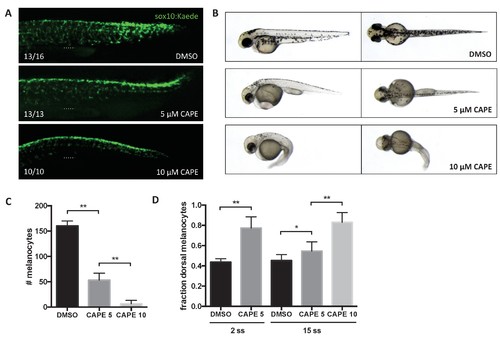
CAPE inhibits neural crest migration and pigment cell differentiation. Embryos were treated at 2 ss unless otherwise indicated. (A) Sox10:Kaede+ cells in the trunk of zebrafish embryos are more dorsally located at 24 hpf. Dotted line indicates top of yolk sac extension. CAPE-treated embryos were allowed to develop for 4 hr longer than control embryos for stage matching. Numbers indicate fraction of embryos for which images are representative. Some DMSO control embryos showed a pattern similar to 5 μM CAPE. Similar results were observed in three independent experiments. (B) Morphology and pigmentation of CAPE-treated embryos at 2 dpf. Treated embryos showed reduced pigmentation and defects such as pericardial edema and a curved tail. (C) Melanocyte counts corresponding to (B). Trunk melanocytes were counted from the yolk sac extension to the end of the tail. Error bars represent standard deviation of 10 embryos from two independent experiments. (D) CAPE increases the fraction of dorsal melanocytes at 2 dpf. Melanocytes were counted as in (C). Embryonic stage at drug treatment is indicated. *p<0.05, **p<0.0005, unpaired t-test. Figure 4—figure supplement 1 shows the effect of CAPE on xanthophores and iridophores at 3 dpf. Figure 4—figure supplement 2 shows the effect of CAPE on otic vesicle development. |
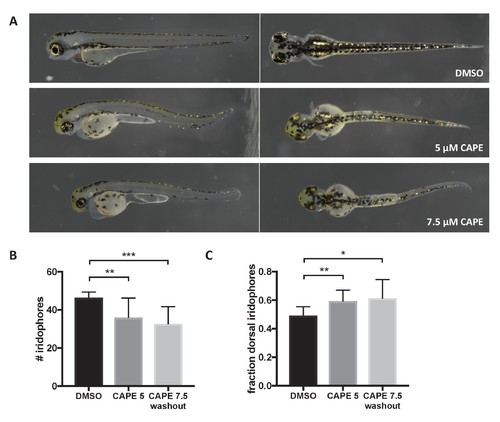
CAPE disrupts iridophore development less dramatically than melanocyte development. Embryos were treated with the indicated concentration of CAPE at 2 ss either continuously (5 μM) or until 48 hpf (7.5 μM washout) to reduce toxicity. (A) Pigment cell phenotypes at 3 dpf. (B) Iridophore counts at 3 dpf. Iridophores were counted from the yolk sac extension to the end of the tail. Iridophore number is slightly reduced by CAPE. Error bars represent standard deviation of 10 embryos from a single clutch. (C) Fraction of dorsal iridophores is slightly increased by CAPE. *p<0.05, **p<0.005, ***p<0.0005, unpaired t-test. |
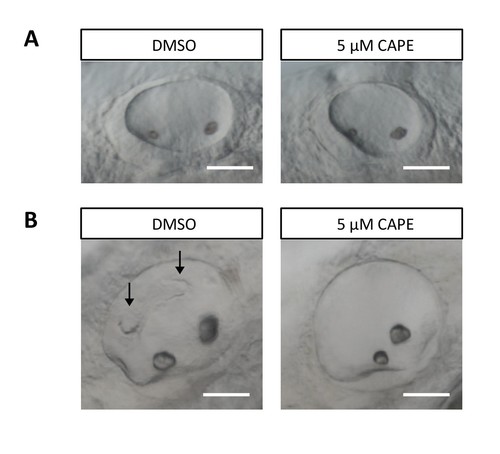
CAPE disrupts ear development. Embryos were treated continuously from 2 ss. (A) Otic vesicles of control and CAPE-treated embryos at 24 hpf. (B) Otic vesicles of control and CAPE-treated embryos at 48 hpf. Note lack of semicircular canal projections (arrows). Scale bar: 50 μm. |
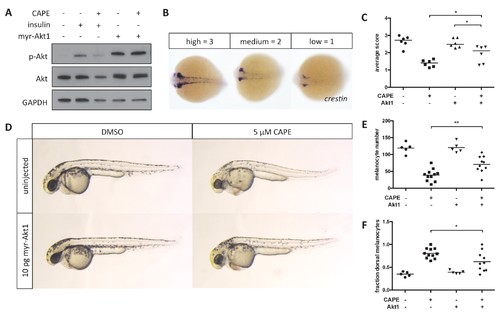
Myr-Akt1 rescues neural crest defects caused by CAPE. (A) Injection of myr-Akt1 RNA results in high phospho-Akt in heterogeneous neural crest cultures regardless of CAPE treatment. The same result was observed in four independent experiments. (B) Scoring system for crestin in situ hybridization. (C) Myr-Akt1 injection increases crestin expression in CAPE-treated embryos. Each point represents the average score of embryos from a single clutch (23–66 embryos per clutch). Three independent experiments are shown. (D) Morphology and pigmentation of CAPE-treated and injected embryos at 2 dpf. Images are representative of three independent experiments. (E) Myr-Akt1 increases melanocyte number in CAPE-treated embryos. Trunk melanocytes were counted as in Figure 4. Each point represents one embryo from the same clutch; bars indicate mean. (F) Myr-Akt1 reduces the fraction of dorsal melanocytes in CAPE-treated embryos. *p<0.05, **p<0.005, (C) paired t-test, (E–F) unpaired t-test. Figure 5—figure supplement 1 shows the effect of PI3K inhibitors on crestin:EGFP expression in vitro and the effect of myr-Akt1 on CAPE-induced embryonic defects. |
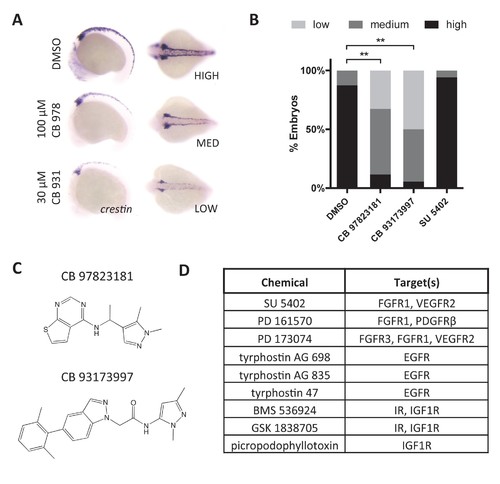
RTK signaling regulates crestin expression. (A) Treatment of embryos with Chembridge novel kinase inhibitors at 2 ss decreases crestin expression at 15 ss. (B) Quantification of crestin expression in drug-treated embryos based on the scoring system in (A). The combined results of two independent experiments are shown. **p<0.0005, chi-square test (C) Structures of Chembridge kinase inhibitors. (D) Receptor tyrosine kinase inhibitors that had no effect on crestin expression. Chemicals were tested up to 100 μM. |
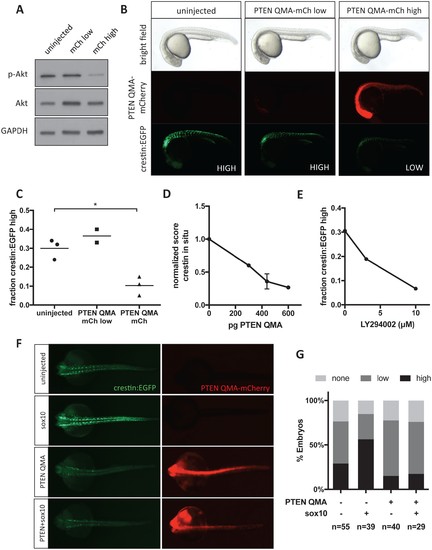
Akt signaling regulates neural crest gene expression in vivo. (A) PTEN QMA-mCherry (300 pg) reduces phospho-Akt level in whole embryos. (B) Morphology, PTEN QMA-mCherry expression, and crestin:EGFP expression of PTEN QMA-mCherry injected embryos. Scoring system for crestin:EGFP levels is indicated. (C) Quantification based on scoring in (B). Each point represents a single clutch (5–53 embryos per condition), and mean is indicated. One clutch generated less than 5 PTEN QMA-mCherry low embryos and is not shown. *p<0.01, Student’s t-test (D) PTEN QMA-mCherry decreases crestin expression by ISH. Embryos were scored as in Figure 5B. Average score normalized to uninjected control is indicated. Error bars represent SEM of four clutches (7–28 embryos per condition) from three independent experiments. One clutch was excluded because of abnormally low staining in both control and injected embryos. (E) The PI3K inhibitor LY294002 decreases crestin:EGFP expression. Points indicate the average of two independent experiments. (F) PTEN QMA-mCherry prevents Sox10 from stimulating crestin:EGFP expression. Representative embryos from the same clutch are shown. (G) Three clutches (8–19 embryos per condition) from two independent experiments were scored as in (B). |