
- Title
-
Ikk2 regulates cytokinesis during vertebrate development
- Authors
- Shen, H., Shin, E.M., Lee, S., Mathavan, S., Koh, H., Osato, M., Choi, H., Tergaonkar, V., Korzh, V.
- Source
- Full text @ Sci. Rep.
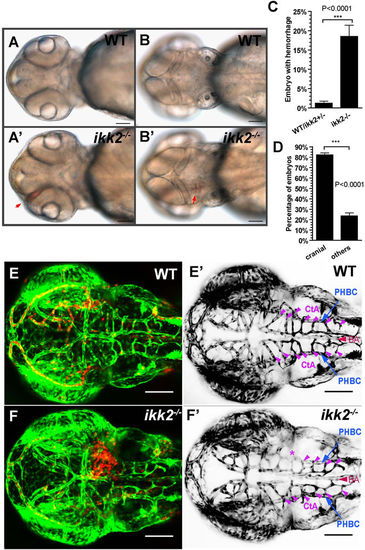
Loss of Ikk2 caused hemorrhage. (A,B) Bright-field images of wild-type and ikk2 −/− (zygotic) embryos obtained from heterozygotic parents at 48 hpf. Red arrows - the hemorrhage site. (A,A′) Ventral view. (B,B′) dorsal view. (C) Quantification of hemorrhaging embryos. (D) Quantification of embryos with cranial hemorrhage vs that in other parts of the body. (C,D) Unpaired Student’s t test. (E,F) Confocal Z-projection shows wild type (E) and ikk2 −/− (F) embryos of the Tg(fli:EGFP)/Tg(gata:DsRed) background at 48 hpf. (E′,F′) Confocal Z-projection shows Tg(fli:EGFP) embryos without the dorsal most MtA, MsA and DLV. EGFP was pseudo-colored as black. PHBC (blue), BA (red), and CtAs (purple) were marked. * - the affected CtAs with cranial hemorrhage in (F). All data expressed as mean ± SEM; scale bar in all panels: 100 μm. Abbreviations – PHBC: primordial hindbrain channels; BA: basilar artery; CtAs: central arteries (51). |
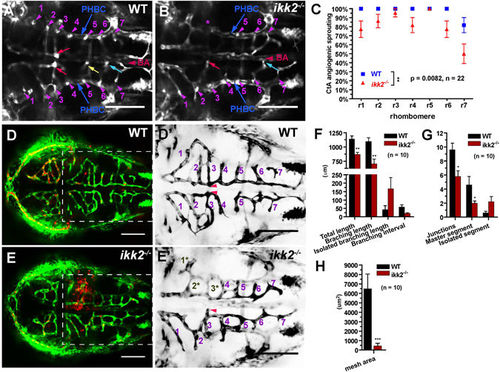
Loss of Ikk2 affects angiogenesis. (A,B) Confocal horizontal section of ventral hindbrain in wild-type and ikk2 −/− (zygotic) embryos obtained from heterozygotic parents of Tg(fli:EGFP) background at 48 hpf. CtA (purple arrowhead) stem sprouting from PHBC in each rhombomere (r) was marked accordingly. At this stage, the bilateral CtAs in the r3 formed two connections with lumen to BA (yellow arrow) in wild-type and only one in ikk2 −/− embryo. Connections of CtAs in r5 (yellow) and r6 (blue) marked. (C) Quantification of CtA sprouting from PHBC in each rhombomere. P value calculated by paired Student’s t test. (D,E) Confocal projection of CtA angiogenic vessels in Tg(fli:EGFP)/Tg(gata:DsRed) 48 hpf embryos. (J′,K′) Blowup shows the hindbrain of Tg(fli:EGFP)- labelled CtA vessels. Numbers correspond to the rhombomeres containing CtA sprouts. Note that 1*, 2*, 3* marked the CtA vessels that were reduced both in size and connectivity in ikk2 −/− embryos. This is the area of hemorrhage (E). (F–H) Quantification of angiogenic index of hindbrain CtAs. P value calculated by Student’s t test. All data are expressed as mean ± SEM; scale bar in all panels: 100 μm. Abbreviations – PHBC: primordial hindbrain channels; BA: basilar artery; CtAs: central arteries (51). |
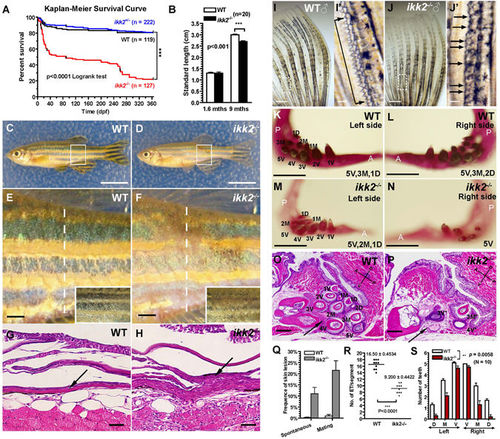
Ikk2 regulates development of skin and its appendages. (A) Kaplan-Meier analysis of survival of ikk2 −/− fish during one-year period. P < 0.001, by Logrank test. (B) Nine months-old adult ikk2 −/− (zygotic) mutants obtained from heterozygotic parents are small. P < 0.001, unpaired t test. (C–F) Adult ikk2 −/− fish are hypopigmented (boxed area and inset, E,F). They succumb to skin injuries without or with mating, with an average frequency of 11% and 21.5%, respectively. Scale bar in (C,D): 1 cm; in (E,F): 1000 µm. (Q). (E,F) blowup of white rectangle area in (C,D). In severe cases, the injuries cause skin lesion. (G,H) H&E stained cross-section at the level of skin lesion area (dashed line in C,D). Scale bar: 500 µm. (I,J) Epidermal tubercles (ET) were reduced in ikk2 −/−. (I′,J′) Blowup of white rectangle area in (I,J). Quantifications by unpaired t test were shown in (R) Scale bar in I,J: 500 µm; in (I′,J′): 100 µm. (K–N) Alizarin red staining of teeth. Scale bar: 500 µm. (O,P) H&E stained sagittal section at the Vth branchial arch. Teeth numbers were marked by *. Note that in ikk2 −/− fish, 4 V* was absent, 3 V* was defective, and blood supply to the dentation area (arrow) compromised. Scale bar: 100 µm. (S) Teeth number was significantly reduced in adult mutants. P = 0.0058, paired t test. PHENOTYPE:
|
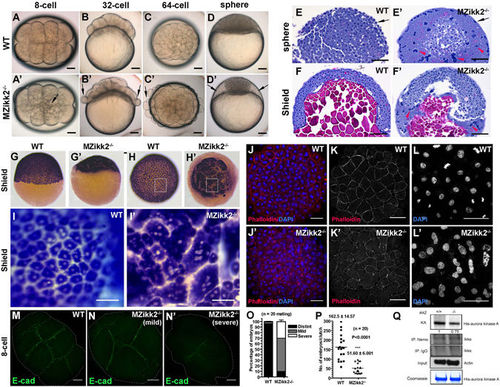
Cell adhesion and cytokinesis are affected in MZikk2 −/− embryos. (A–D) Early cell adhesion and cytokinesis defects in MZikk2 −/− embryos (obtained from homozygotic parents, arrow) were followed by the ‘cellular island’ phenotype (arrow) at sphere stage. (E,F) (H,E) stained sections showing abnormal nuclear clumps in the EVL (arrow) and enlarged YSL (arrowhead) of MZikk2 −/− embryos. (G-I) krt8 WISH reveals multinuclear cells in MZikk2 −/− embryos. (I,I′) Blowup of boxed areas in (H,H′), respectively. (J–L) Whole-mount immunostaining using Phalloidin and DAPI shows cell boundaries (K,K′) and nuclei (L,L′) in MZikk2 −/− embryos (animal pole view, sphere stage). (M,N) Cell division furrows stained by E-cadherin, 8-cell stage. (O) Quantification of embryos with mild and severe division furrow defects based on E-cadherin staining. (P) A number of embryos in ikk2 −/− crosses as compared to wild-type; p < 0.001, Student’s t test. (Q) Ikk2-dependent phosphorylation of Aurora-A in extracts of ikk2 −/− and controls. Actin and Coomassie blue, loading control. All data are expressed as mean ± SEM; Scale bar in all panels: 100 μm. |

ZFIN is incorporating published figure images and captions as part of an ongoing project. Figures from some publications have not yet been curated, or are not available for display because of copyright restrictions. |
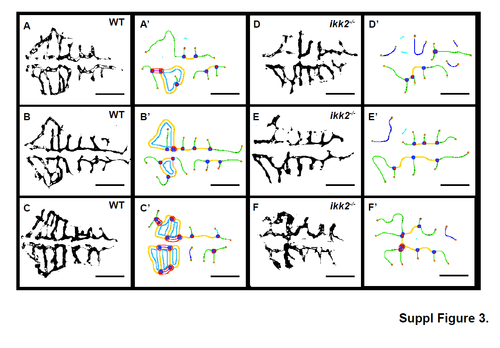
The hindbrain angiogenic vasculature of wild-type and zygotic ikk2-/- embryos (obtained from heterozygotic parents) at 48 hpf. (A-F), ImageJ processed binary image of the confocal projection view of the hindbrain CtA vessels. I'-G', corresponding output image from ImageJ Angiogenic Analyser Macro with corresponding vessel junctions, branches, master segments, isolated segments marked in different colours. Their length and numbers were analysed to calculate the angiogenic index using ImageJ Angiogenic Analyser Macro as shown in Figure 3, F-H. |
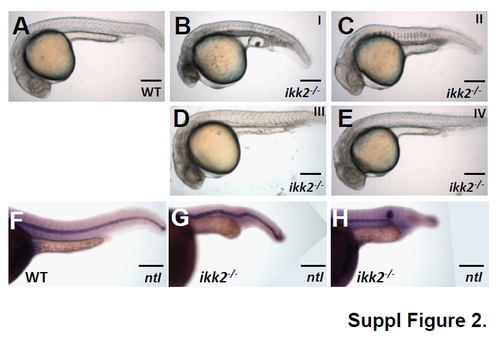
Analysis of zygotic mutants at 24 hpf. (A-E) Bright-field lateral view of wildtype and ikk2-/- (zygotic) embryos obtained from heterozygotic parents with notochord defects at 24 hpf. A, wild-type embryos. B-E, ikk2-/- embryos classified into four categories based on severity of the notochord defects. Class I and II show notochord defects and Ushaped somites. Class III and IV show mild notochord defects and increased turbidity of the brain suggestive of apoptosis. (F-H) Lateral view of embryos stained by in situ hybridization using ntl probe. ikk2-/- embryos have either crooked notochord or its truncation. Scale bar: 250 μm. |
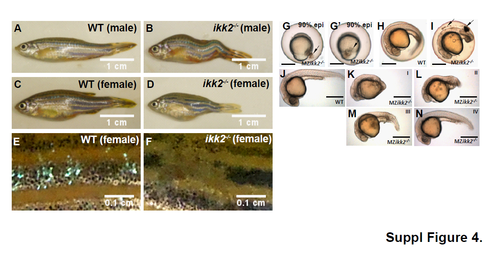
Morphological analysis of adult heterozygotic and embryonic homozygotic Ikk2 mutants obtained from heterozygotic parents. (A-D) Adult ikk2-/- fish with skeletal defects. Adult ikk2-/- fish are short with curved skeleton (B, D) as compared to wild types (A, C). (E, F) Adult ikk2-/- fish are prone to skin lesion accompanied by loss of scales and hypopigmentation. Scale bar in A-D: 1cm; scale bar in E,F: 0.1 cm. (G-N) In MZikk2-/- escapers cells detach in embryonic shield (arrow) at late gastrula. (G, G’), later stage embryos contain increased cell debris under the chorion (I, arrowed) and show defects in posterior body (K-N). G, lateral view. G’, dorsal view. J-N, lateral view, 24 hpf. K-N, ikk2-/- embryos with defects in posterior body are classified into four categories (I to IV) based on severity of the notochord defects. This phenotype mimics that of zygotic ikk2-/- mutants (Figure S2, A-E). Scale bar in G-N: 500 μm. |
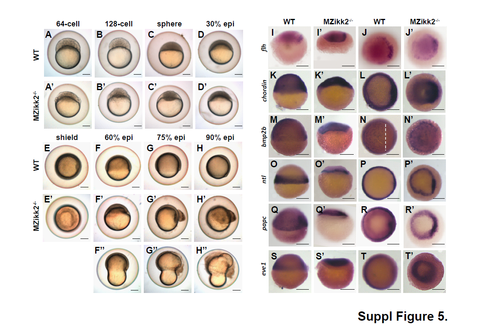
Morphological and WISH analysis of MZikk2-/- embryos. (A-H) Bright field image of wild-type and MZikk2-/- embryos obtained from homozygotic parents at blastula and gastrula stages. MZikk2-/- embryos show disorganized blastoderms (A'-C') unlike compact blastoderm of wild-type embryos (A-C). Epiboly is incomplete (D'-H') and cells detach from yolk. F''-H'', due to delayed epiboly constriction starts before epiboly completion resulting in peanut-shaped embryos. All embryos shown in lateral view. (I-T) Wild-type and MZikk2-/- embryos stained by WISH at shield stage. Embryos stained with dorsal markers (flh, chordin in I-L), ventral markers (bmp2b in M-N) , and mesendoderm markers ( |