
- Title
-
Loss of the chromatin modifier Kdm2aa causes BrafV600E-independent spontaneous melanoma in zebrafish
- Authors
- Scahill, C.M., Digby, Z., Sealy, I.M., Wojciechowska, S., White, R.J., Collins, J.E., Stemple, D.L., Bartke, T., Mathers, M.E., Patton, E.E., Busch-Nentwich, E.M.
- Source
- Full text @ PLoS Genet.
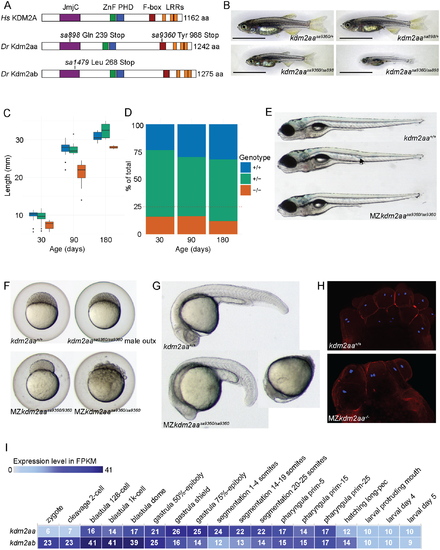
Loss of Kdm2aa function leads to growth and oogenesis defects. (A) The zebrafish paralogues Kdm2aa and Kdm2ab share the protein domain structure with their human orthologue KDM2A. The mutations kdm2aasa898 and kdm2aasa9360 produce premature stop codons in the JmjC and F-box domain, respectively. The allele kdm2absa1479 produces a premature stop codon in the JmjC domain. (B) Juvenile fish compound heterozygous for kdm2aasa898 and kdm2aasa9360 are shorter and thinner at 30 d.p.f. than their heterozygous siblings. Scale bar: 5 mm. (C) Box plots showing length in mm of each of the three sibling groups for a representative family at 30, 90 and 180 d.p.f. Fish homozygous for kdm2aasa898 are smaller than their siblings. (D) Fish homozygous for premature stop codons in kdm2aa represent less than the expected 25% of the group. (E) A small proportion of maternal zygotic kdm2aasa9360 embryos survive to 5 d.p.f. with mild (arrow in second panel) or no malformations (bottom panel). (F) Embryos derived from kdm2aasa9360/sa9360 intercrosses show severe defects and lethality during the first 24 h.p.f. whereas kdm2aasa9360/sa9360 male outcrosses are normal. (G) Two examples of embryos derived from kdm2aasa9360/sa9360 female outcrosses displaying severe defects at 24 h.p.f. (H) TRITC-Phalloidin and DAPI staining on MZkdm2aa-/- embryos derived from intercrosses of kdm2aasa898/sa9360 fish at the 8–16 cell stage showed that despite cell asymmetry and asynchronous division, nuclei seemed overall normal. (I) Expression data from Expression Atlas http://www.ebi.ac.uk/gxa/experiments/E-ERAD-475 showing normalised counts (FPKMs) from RNA-seq data for kdm2aa and kdm2ab. There is maternal contribution of both genes, but kdm2ab polyA transcript abundance peaks at early blastula stages, whereas kdm2aa polyA transcript abundance peaks later at the gastrula shield stage. |
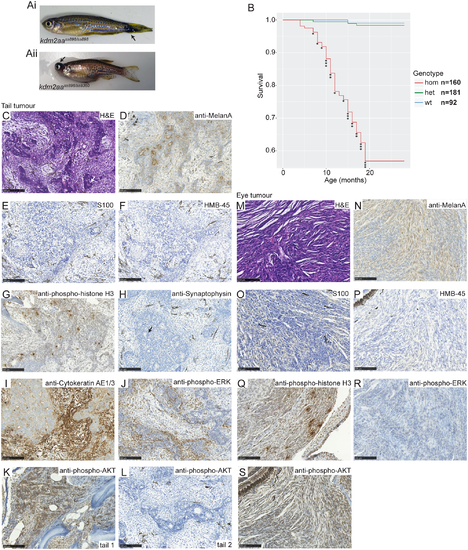
Kdm2aa-deficient fish develop melanoma. Aberrant melanocytic pigmentation on the tail (Ai, arrow) and eye tumours (Aii, arrow) are observed in Kdm2aa-deficient fish. (B) Survival graph for kdm2aasa898 showing incidence of suspected cancer. Each (*) indicates a single culled fish due to suspected cancer. No wild-type or heterozygous siblings developed any suspected cancers. (C) H and E stained section of a tail tumour showing a biphasic appearance with pseudoglandular features (arrow shows an example) alternating with areas of spindle cell growth. (D) Section of tail tumour staining positive for the melanoma marker Melan-A (brown). (E) Section of tail tumour negative for the melanoma marker S100. (F) Section of tail tumour staining negative for the melanoma marker HMB-45. (G) Section of tail tumour staining positive for mitotic marker phospho-histone H3 (brown). (H) Section of tail tumour showing negative staining for the neuroendocrine marker Synaptophysin. Arrow points to example of pseudoglandular structures. (I) Section of tail tumour showing positive staining for the epithelial marker Cytokeratin (brown) in both the pseudoglandular and spindle cell elements. (J) Section of tail tumour with positive phospho-ERK staining (brown). (K) Section of tail tumour with positive phospho-AKT staining (brown) (L) Section of a second tail tumour which did not stain positive for phospho-AKT. (M) H and E stained section from an eye tumour revealing spindle cell morphology. (N) Section of eye tumour staining positive for Melan-A (brown). (O) Eye tumour section showing negative staining for the S100. (P) Section of eye tumour negative for HMB-45. (Q) Section of eye tumour staining positive for phospho-histone H3 (brown). (R) Phospho-ERK staining of eye tumour sections was negative. (S) Section of eye tumour showing positive staining for phospho-AKT (brown). Scale bar in C-S is 100 μm. PHENOTYPE:
|

ZFIN is incorporating published figure images and captions as part of an ongoing project. Figures from some publications have not yet been curated, or are not available for display because of copyright restrictions. |
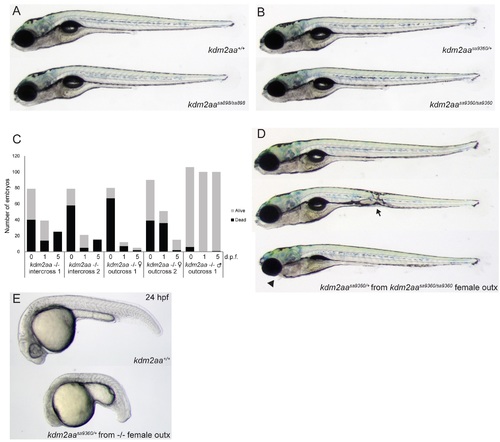
Zygotic and maternal-zygotic kdm2aa mutants at 5 d.p.f. (related to Fig 1). (A, B) Homozygous mutants for either kdm2aasa898 or kdm2aasa9360 are morphologically normal at 5 d.p.f. (C) Survival rates up to 5 d.p.f. of embryos resulting from intercrosses and outcrosses of homozygous kdm2aasa9360 mutants. (D) A small number of embryos from initial kdm2aasa9360/sa9360 female outcrosses survive to 5 d.p.f. albeit with malformations (arrow) or missing tissue (arrowhead). (E) Embryos from kdm2aasa9360/sa9360 female outcrosses display the same phenotypes as MZkdm2aa-/- mutants. |
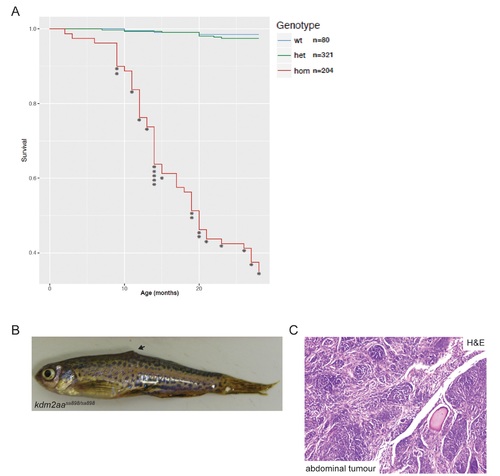
Kdm2aa-deficient fish develop melanoma. (related to Fig 2). (A) Survival graph for kdm2aasa9360 showing incidence of suspected cancer. Each (*) indicates a single culled fish due to suspected cancer. No wild-type or heterozygous siblings developed any suspected cancers. (B) kdm2aasa898 homozygous fish with a mass on its body (arrow). (C) H and E stained section through the abdominal mass of a kdm2aas8980/sa898 fish showing epithelioid and spindle cells with a nested pattern involving skeletal muscle. |
|
Unillustrated author statements |