
- Title
-
TGF-β Signaling Is Necessary and Sufficient for Pharyngeal Arch Artery Angioblast Formation
- Authors
- Abrial, M., Paffett-Lugassy, N., Jeffrey, S., Jordan, D., O'Loughlin, E., Frederick, C.J., Burns, C.G., Burns, C.E.
- Source
- Full text @ Cell Rep.
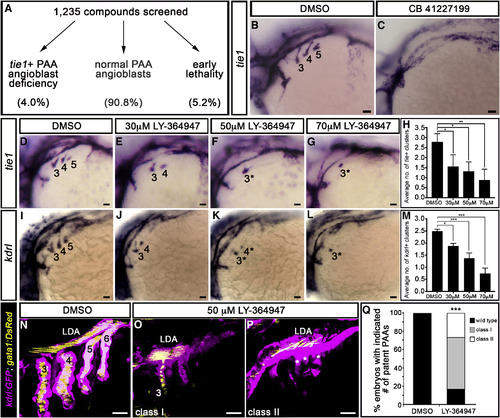
A Small-Molecule Screen in Zebrafish Implicates TGF-β Signaling in PAA Morphogenesis (A) 1,235 small molecules were screened for activities that suppress the formation of tie1+ PAA angioblasts in zebrafish. Shown are the percentages of compounds that fell into each of three categories. (B and C) Left lateral views of tie1+ PAA angioblast clusters in 36-hr post-fertilization (hpf) embryos treated from bud stage with DMSO (B) or 10 μM CB 41227199 (C), a predicted inhibitor of TGF-β signaling. The angioblast clusters are numbered as shown (B) according to the pharyngeal arches within which they form. Seven of 14 chemically treated embryos were devoid of tie1+ clusters. (D–L) Left lateral views of (D–G) tie1+ or (I–L) kdrl+ PAA angioblasts in 36-hpf embryos treated from 20 hpf with DMSO or the indicated, increasing concentrations of LY-364947. The angioblast clusters that did form in LY-364947-treated embryos were smaller and/or failed to sprout (asterisks in F, G, K, and L). Scale bars, 200 μm. (H and M) Bar graphs showing the average number of tie1+ or kdrl+ angioblast clusters ±SD that formed in each experimental group (∗p < 0.05; ∗∗p < 0.01; ∗∗∗p < 0.001). n = 40–50 embryos per group with a total of three biological replicates. (N–Q) Left lateral views of 60-hpf Tg(kdrl:GFP),Tg(gata1:DsRed) embryos treated from 20 hpf with DMSO (N) or LY-364947 (O and P) imaged in the green and red channels to visualize endothelium (pseudocolored magenta) and red blood cells (RBC) (pseudocolored yellow), respectively. In DMSO-treated embryos, four patent PAAs supported robust blood flow as evidenced by strong luminal RBC fluorescence (N). LY-364947-treated embryos displayed a reduced number (O; class I) or complete absence (P; class II) of patent PAAs. Asterisks in (P) highlight compensatory sprouting of endothelial cells from the LDA. (Q) Bar graph showing the percentages of DMSO (n = 30) and LY-36497-treated (n = 40) embryos with four patent PAAs (wild-type), one to two patent PAAs (class I), or zero PAAs (class II). ∗∗∗p < 0.001. No animals contained three patent PAAs. Scale bars, 25 μm. EXPRESSION / LABELING:
PHENOTYPE:
|
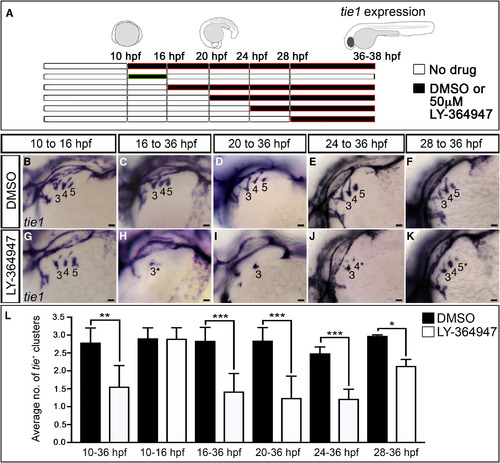
TGF-β Signaling Is Required during PAA Progenitor Differentiation (A–L) Stage-specific LY-364947 exposure reveals a requirement for TGF-β signaling after PAA progenitor specification. (A) Schematic diagram showing drug treatment regimens designed to inhibit TGF-β signaling during (10–16 hr post-fertilization; hpf) and/or after (+16 hpf) progenitor specification. (B–K) Left lateral views of tie1+ PAA angioblast clusters in 36-hpf embryos treated during the indicated developmental windows with DMSO or 50 μM LY-364947. The angioblast clusters that did form in LY-364947-treated embryos appeared smaller and/or failed to sprout (asterisks in H, J, and K). Scale bars, 200 μm. (L) Bar graph showing the average number of tie1+ angioblast clusters ±SD within each experimental group (∗p < 0.05; ∗∗p < 0.01; ∗∗∗p < 0.001). n = 20–50 embryos per treatment group with a total of three biological replicates. |
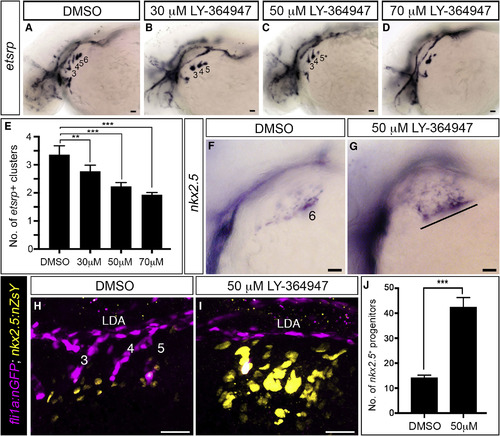
TGF-β Signaling Is Required for the PAA Progenitor to Angioblast Transition (A–D) Left lateral views of etsrp+ PAA angioblasts in 36-hpf embryos treated from 20-hpf stage with DMSO or the indicated, increasing concentrations of LY-364947. The angioblast clusters that did form in LY-364947-treated embryos were smaller and/or failed to sprout (asterisks in C and D). Scale bars, 200 μm. (E) Bar graph showing the average number of etsrp+ angioblast clusters ±SD within each experimental group (∗∗p < 0.01; ∗∗∗p < 0.001). n = 40–50 embryos per treatment group with a total of four biological replicates. (F and G) Left lateral views of nkx2.5+ PAA progenitors in 36-hpf embryos treated from 20 hpf with DMSO (F, n = 43) or LY-364947 (G, n = 38/54 with the phenotype shown, 14/54 showed a milder phenotype, 2/54 appeared normal). The line in (G) highlights persistent expression of nkx2.5 transcripts in PAA progenitors of arches 3–6 in LY-364947-treated embryos. (H and I) Left lateral views of 38-hpf Tg(fli1a:nGFP),Tg(nkx2.5:ZsYellow) embryos treated from 20 hpf with DMSO or LY-364947, immunostained for GFP and ZsYellow, and imaged in the green and red channels to visualize PAA endothelial (pseudocolored magenta) and progenitor (pseudocolored yellow) cell nuclei, respectively. (J) The bar graph shows the average numbers ±SD of nkx2.5:ZsYellow+ PAA progenitors in DMSO and LY-364947-treated embryos. n = 4 for both experimental groups. ∗∗∗p < 0.0001. Scale bars, 25 μm. EXPRESSION / LABELING:
PHENOTYPE:
|
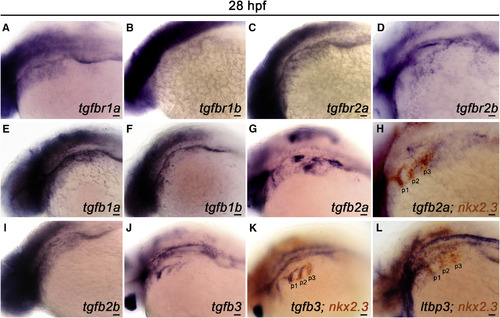
TGF-β Pathway Components Are Expressed in the Pharynx during PAA Angioblast Differentiation (A–L) Left lateral views of indicated TGF-β pathway component expression in 28 hr post-fertilization (hpf) embryos. (A-D) Transcripts encoding the canonical TGF-β receptor paralogs RIa/b and RIIa/b are broadly distributed in the pharyngeal region. (E–G, I, and J) Expression of the indicated TGF-β ligands in the pharynx. (H, K, and L) Double in situ hybridization highlighting overlap of indicated TGF-β pathway component transcripts with transcripts encoding the pharyngeal endodermal pouch marker, nkx2.3. (n = 30–40 embryos per in situ hybridization probe). Scale bars, 200 μm. EXPRESSION / LABELING:
|
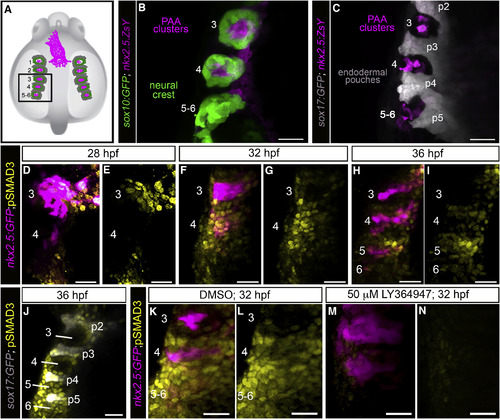
A Burst of TGF-β Signaling Precedes tie1+ PAA Angioblast Differentiation (A) Cartoon of zebrafish embryo highlighting the left-side pharyngeal arches 3–6 (boxed) analyzed at higher magnifications in (B)–(N). The spatial relationships between PAA progenitors (magenta), neural-crest-derived cells (green), and endodermal pouches (gray) are shown. (B and C) Left-side dorsal views of 32 hr post-fertilization (hpf) Tg(sox10:GFP), Tg(nkx2.5:ZsYellow), or Tg(sox17:GFP),Tg(nkx2.5:ZsYellow) embryos immunostained for GFP and ZsYellow and imaged in the green and far red channels to visualize neural crest cells (pseudocolored green), endodermal pouches (pseudocolored gray), and PAA progenitor clusters (pseudocolored magenta). n = 5 for both groups. (D–I) Spatiotemporal dynamics of TGF-β signaling during PAA angioblast differentiation. Dorsal views of Tg(nkx2.5:GFP) embryos at the indicated developmental stages immunostained for GFP and pSMAD3 imaged in the green and far red channels to visualize PAA progenitors (pseudocolored magenta) and cells experiencing active TGF-β signaling (pseudocolored yellow). 28 hpf, n = 3; 32 hpf, n = 4; 36 hpf, n = 6. (J) Left-side dorsal views of Tg(sox17:GFP) embryos at 36 hpf immunostained for GFP and pSMAD3 imaged in the green and far red channels to visualize endodermal pouches (pseudocolored gray) and cells active for TGF-β signaling (pseudocolored yellow), n = 2. (K–N) Left-side dorsal views of Tg(nkx2.5:GFP) embryos at 32 hpf immunostained for GFP (pseudocolored magenta) and pSMAD3 (pseudocolored yellow) following treatment from 20 hpf with DMSO (K and L; n = 3) or 50 μM LY-364947 (M and N; n = 8). Scale bars, 25 μm. EXPRESSION / LABELING:
PHENOTYPE:
|
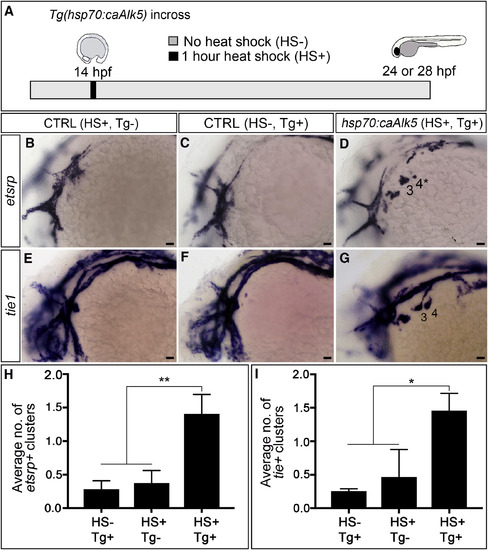
Premature TGF-β Signaling Induces Precocious Differentiation of tie1+ PAA Angioblasts (A) Experimental design for heat-shock-mediated (HS+) induction of TGF-β signaling in Tg(hsp70:caAlk5) embryos at 14 hpf (10 somites stage) followed by analysis of etsrp+ and tie1+ PAA angioblasts at 24 or 28 hr post-fertilization (hpf), respectively. Transgenic embryos not exposed to heat shock (HS–, Tg+) and heat shocked wild-type embryos (HS+, Tg–) were used as controls. (B–G) Left lateral images of 24-hpf (B–D) or 28-hpf (E–G) control (B, C, E, and F) and experimental (D and G) embryos. Two large etsrp+ or tie1+ PAA angioblast clusters are visible in (D) and (G), respectively, whereas the majority of control embryos (B, C, E, and F) lacked PAA angioblasts at this stage. Scale bars, 200 μm. (H and I) Bar graphs showing the average number of etsrp+ or tie1+ angioblast clusters ±SD within each experimental group (∗p < 0.05; ∗∗p < 0.01). n = 40–50 embryos per group with a total of three biological replicates. |
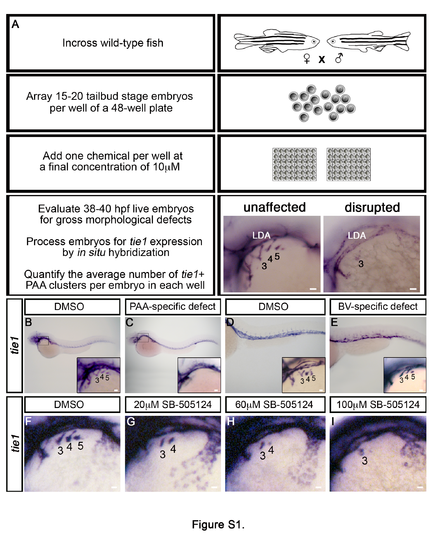
Chemical screening in zebrafish identifies the TGFβ pathway as required for PAA development, Related to Figure 1. (A) Flow diagram depicting the strategy for a small molecule screen designed to uncover novel pathways that regulate tie1+ PAA angioblast development. Left lateral views of PAA angioblast clusters visualized by whole mount in situ hybridization for tie1 in 36-38 hours post fertilization (hpf) embryos treated from bud stage with vehicle control (DMSO) or 10μM small molecule. The angioblast clusters are numbered as shown according to the pharyngeal arches within which they form. (B,C) Left lateral views of whole embryos and higher magnification views of PAA angioblast clusters (inset) following chemical treatment and in situ hybridization for tie1. Embryos with PAA-specific defects were observed (C) as compared to controls (B). (D,E) Left lateral views of trunk and tail regions of embryos and higher magnification views of PAA angioblast clusters (inset) following chemical treatment and in situ hybridization for tie1. Embryos with body vasculature (BV) defects but normal PAA angioblast clusters were observed (E) in comparison to controls (D). (F-I) Left lateral views of tie1+ PAA angioblasts in 38 hpf embryos treated from 20 hpf with DMSO (F, n=19) or the indicated, increasing concentrations of SB- 505124 (G, 20μM, n=20; F, 60μM, n=28; G, 100μM, n=21). |
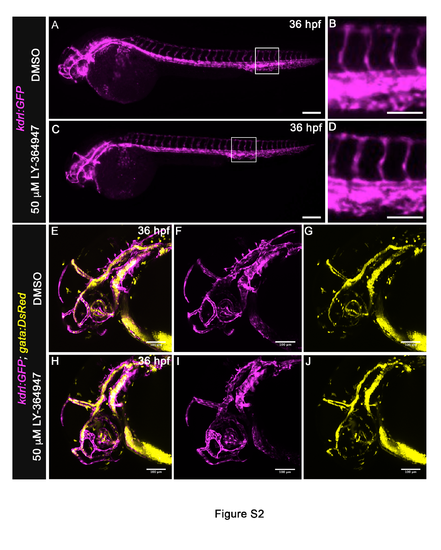
Inhibition of TGFβ signaling does not grossly disrupt the body or cranial vasculature, Related to Figure 1. (A-D) Lateral views of 36 hpf Tg(kdrl:GFP) embryos treated from 20 hpf with DMSO (A,B) or 50μM LY-364947 (C,D) imaged in the green channel on a compound microscope to visualize endothelium (pseudocolored magenta). The body vasculature appeared similar between LY-364947-treated and DMSOtreated embryos. Magnified views (B,D) of boxed regions (A,C) highlight intersomitic vessels. (E-J) Left lateral views of 36 hpf Tg(kdrl:GFP), Tg(gata1:DsRed) embryos treated from 20 hpf with DMSO (E-G) or 50μM LY-364947 (H-J) imaged on a confocal microscrope in the green and red channels to visualize endothelium (pseudocolored magenta) and red blood cells (RBC) (pseudocolored yellow), respectively. Merged (E,H) and single channel (F,G,I,J) images are shown. In both cohorts, cranial vascular development and integrity appeared grossly normal and supported RBC circulation. (A,C) Scale bars = 200μm, (B,D-J) Scale bars = 100μm. (n=4 to 5 embryos per group) EXPRESSION / LABELING:
|

Inhibition of TGFβ signaling does not perturb pharyngeal organization or segmentation, Related to Figure 1. (A,B) Dorsal views of nkx2.3+ pharyngeal pouches in 36 hpf embryos treated from 20 hpf with DMSO or LY-364947, n> 20 embryos per treatment. (C,D) Left lateral views of neural crest-derived cells in 36 hpf Tg(sox10:GFP) embryos treated from 20 hpf with DMSO or LY-364947, n> 20 embryos per treatment. Scale bars = 200μm EXPRESSION / LABELING:
|
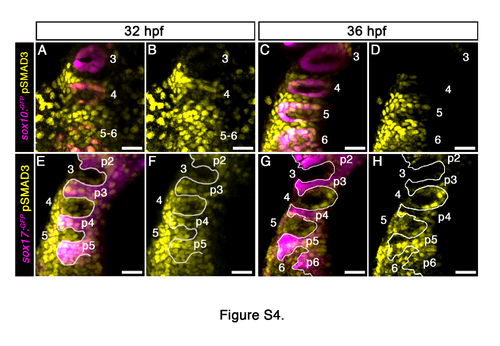
A wave of TGFβ signaling is observed throughout the pharynx, Related to Figure 5. (A-H) Spatiotemporal dynamics of TGFb signaling during PAA angioblast differentiation. Dorsal views of Tg(sox10):GFP) or Tg(sox17:GFP) embryos at the indicated developmental stages immunostained for GFP and pSMAD3 imaged in the green and far red channels to visualize neural crest (sox10) or endodermal pouches (sox17) (pseudocolored magenta) and cells experiencing active TGFβ signaling (pseudocolored yellow). 32 hpf, n=3 embryos; 36 hpf, n=6 embryos. Scale bars = 25μm. |