
- Title
-
Trim33 / Tif1-γ is essential for macrophage and neutrophil mobilisation to developmental or inflammatory cues
- Authors
- Demy, D.L., Tauzin, M., Lancino, M., le Cabec, V., Redd, M., Murayama, E., Maridonneau-Parini, I., Trede, N., Herbomel, P.
- Source
- Full text @ J. Cell Sci.
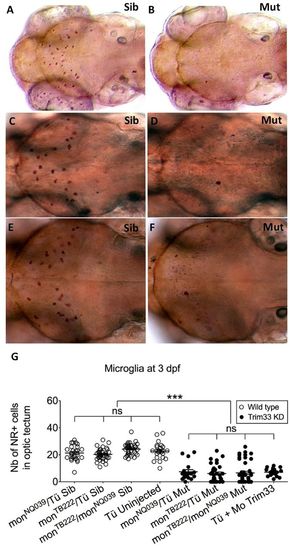
Moonshine mutants and Trim33 morphants are devoid of microglia. (A–F) In vivo dorsal view of Neutral Red-stained primitive microglia in the midbrain optic tectum of 3-day-old moonshineNQ039/Tü siblings (Sib) (A) and mutants (Mut) (B), moonshineTB222/Tü siblings (C) and mutants (D), and of the siblings (E) and mutants (F) resulting from their complementation cross. (G) Corresponding counts (Nb, number) of Neutral Red-positive (NR+) microglial cells in the midbrain optic tectum of moonshine mutants and siblings, and of Trim33 morphants versus control uninjected embryos. Each dot is one embryo. Error bars show mean±s.e.m. KD, knockdown; Mo, morphant; mon, moonshine; Tü, wild-type Tübingen strain. ***P<0.001; ns, not significant. PHENOTYPE:
|
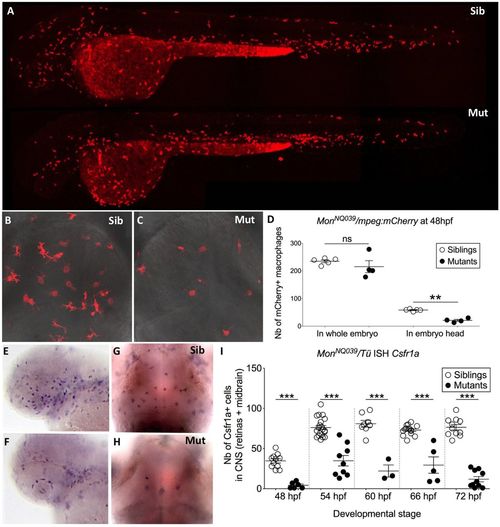
Macrophages are produced normally but do not colonize the CNS in moonshine mutants. (A–C) In vivo images of whole monNQ039Tg(mpeg1:mCherryF) siblings (Sib) (A, upper) and mutants (Mut) (A, lower) at 48 hpf, and dorsal view (rostral up) of the midbrain of siblings (B) and mutants (C) at 72 hpf. (D) Counts (Nb, number) at 48 hpf show that monNQ039Tg(mpeg1:mCherryF) mutant embryos have significantly less mCherry-positive macrophages in the head despite having a similar total number of macrophages to that in the siblings. ISH, whole-mount in situ hybridization. (E–I) Whole mount in situ hybridization for Csfr1a mRNA reveals numerous macrophages in the retina at 48 hpf (E) and midbrain at 72 hpf (G) in the siblings, whereas very few such cells can be detected in these organs in the mutants (F,H). (I) Counting of these cells over time reveals a lower number in the mutant CNS at all stages. Error bars show mean±s.e.m. **P<0.01; ***P<0.001; ns, not significant. EXPRESSION / LABELING:
PHENOTYPE:
|
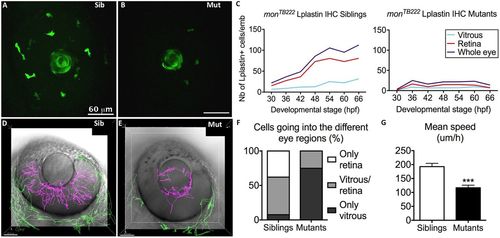
Moonshine macrophages display a defective recruitment towards the eye and into the retina. (A,B) In vivo observation of monNQ039Tg(Pu1:gfp) siblings (Sib) (A) and mutants (Mut) (B) at 30 hpf reveals that several GFP-positive myeloid cells have already arrived at the eye in the siblings, whereas there are few in the mutants; the lens shows apparent green fluorescence only due to its optical properties. (C) Counts (Nb, number) of L-plastin-positive leukocytes in the retina (red curve) and in the vitreous space (from where wt macrophages enter the retina; light blue curve) of monTB222/Tü siblings (left graph, 10–18 embryos/timepoint) and mutants (right graph, 10–16 embryos/timepoint) show an increasing number of macrophages in the eye (blue curve) and resulting colonization of the retina (red curve) in the sibling, whereas very few macrophages arrive at the eye in the mutants and their number does not increase with time. IHC, immunohistochemistry. (D–G) 4D tracking for 12 h of GFP-positive myeloid cells inside (pink tracks) and outside (green tracks) the eye in monNQ039Tg(Pu1:gfp) siblings (D) and mutants (E) from 48 hpf showing that the few mutant cells inside the eye mostly do not invade the retina (n=20 cells from two embryos), whereas it is the opposite in the siblings (n=66 cells from two embryos), as quantified in F. (G) Myeloid cells in the mesenchyme peripheral to the eye (green tracks) migrate more slowly in the mutants (n=42 cells from two embryos, mean speed 116.7 µm/h) than in the siblings (n=109 cells from two embryos, mean speed 192.9 µm/h). Error bars show the s.e.m. ***P<0.001. |
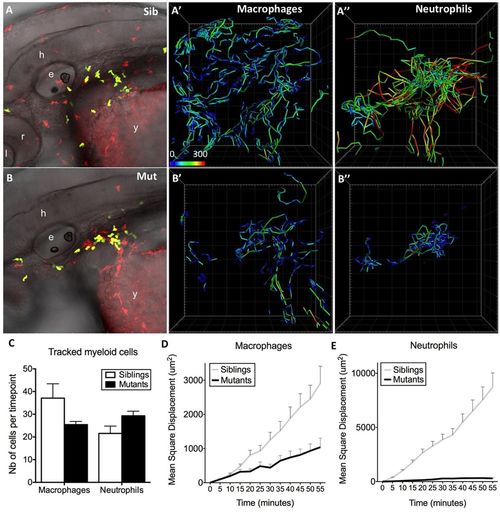
The basal migration in interstitial tissues of both macrophages and neutrophils is affected in moonshine mutants. In vivo 4D tracking of mCherry-positive macrophages and GFP-positive neutrophils in the head and anterior yolk sac area of monNQ039Tg(mpeg1:mCherryF; mpx:gfp) sibling (Sib) (A–A″) and mutant (Mut) (B–B″) embryos at 48 hpf. e, ear; l, lens; y, yolk sac; h, hindbrain; r, retina. Cell trajectories are shown in panels (A′,A″,B′,B″), with colour coding of speed (from 0 to 300 µm/h), and the number (Nb) of cells tracked per time point in each case is shown in C (as mean±s.d. for 80 time points). (D,E) Quantification of the mean±s.d. square displacement over time illustrates the migration defect of the mutant leukocytes. |
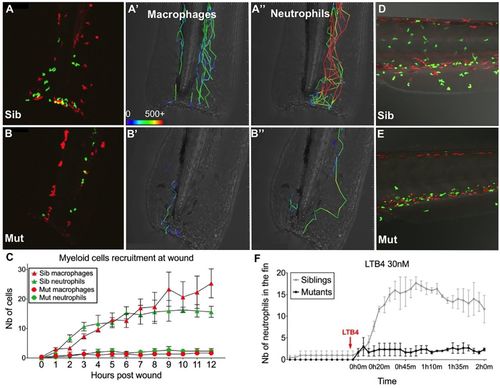
Moonshine mutant myeloid cells do not respond to attractive signals. (A–E) In vivo confocal time-lapse imaging of the caudal fin (A–B″) or CHT region (D,E) of 3-day-old monNQ039Tg(mpeg1:mCherry;mpx:gfp) siblings (Sib) (A–A″,D) and mutants (Mut) (B–B″,E); macrophages are red, neutrophils are green. (A–B″) Fluorescence images at 9 h post tail fin tip transection (9 hpw) (A,B) and trajectories of the first recruited cells, from 0 to 3 hpw (A′–B″); cell speeds (in µm/h) are colour coded as indicated by the bar in A′; cell speeds ≥500 µm/h are all coded in red. (C) Macrophage and neutrophils counts (Nb, number) at the wound over time (mean±s.e.m.; n=3 sibling and 3 mutant larvae). (D–F) LTB4 addition experiment. (D,E) Images at 1.5 h post LTB4 addition, showing the recruitment of neutrophils from the CHT to the ventral fin and skin in the sibling (D), but not in the mutant (E). (F) Neutrophil counts in the ventral fin during the time-lapse sequence (n=3 experiments). EXPRESSION / LABELING:
PHENOTYPE:
|
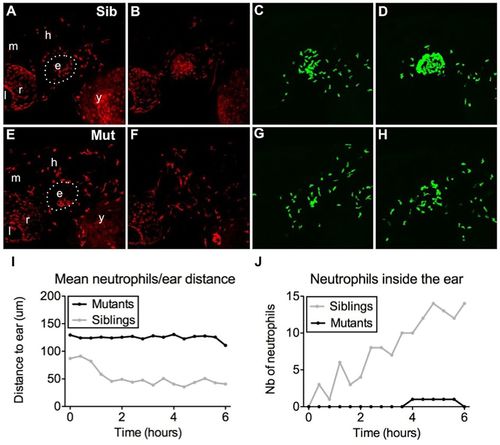
Bacterial infection is insufficient to recruit mutant myeloid cells. (A–H) In vivo time-lapse imaging of macrophages (A,B,E,F) and neutrophils (C,D,G,H) of monNQ039Tg(mpeg1:mCherry/mpx:gfp) sibling (Sib) (A–D) and mutants (Mut) (E–H) by 60 hpf, 20 min after E. coli injection in the inner ear (A,C,E,G) or 7 h later (B,D,F,H). Bacteria injection in the ear induces a strong recruitment of both macrophages and neutrophils in the siblings (B,D), but almost none in the moonshine mutant (F,H). e, ear; l, lens; r, retina; m, midbrain; h, hindbrain; y, yolk sac. See also Movie 7. (I,J) Quantification of neutrophil mean distance to the ear following injection of GFP-positive B. subtilis in the inner ear by 72 hpf (I) shows a drop during the first 2 hours post injection in the siblings (light curve) and not in the mutant (black curve); accordingly, the number of neutrophils inside the ear of infected larvae constantly increases over time in the siblings (light curve) but not in the mutant (black curve). See also Movie 8. PHENOTYPE:
|
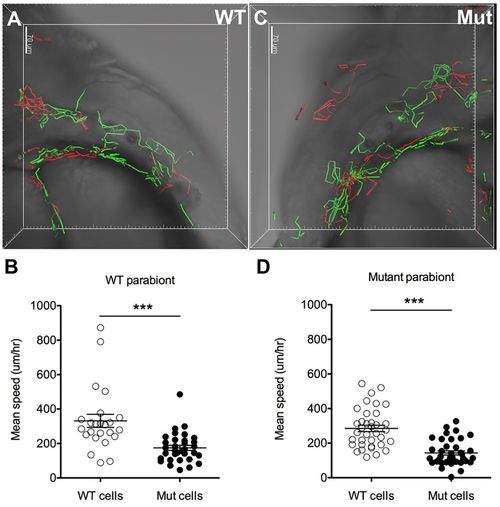
The defect in neutrophil basal migration in moonshine mutants is cell-autonomous. 4D tracking of wild-type (WT) GFP-positive (green tracks) and mutant DsRed-positive (red tracks) neutrophil mobility within interstitial tissues during 3 h of parallel confocal imaging of one wild-type (A) and one mutant (Mut) (C) parabiotic embryos (fused at the level of the trunk) at 48 hpf shows a significantly diminished mobility (average speed; error bars show mean±s.e.m.) of the mutant cells both in the wild-type (B) and in the mutant (D) parabionts, whereas the migration of wild-type neutrophils is not affected in the mutant parabiont (D), together indicating that the mutant neutrophil phenotype is cell autonomous. ***P<0.001. See also Movie 9. |
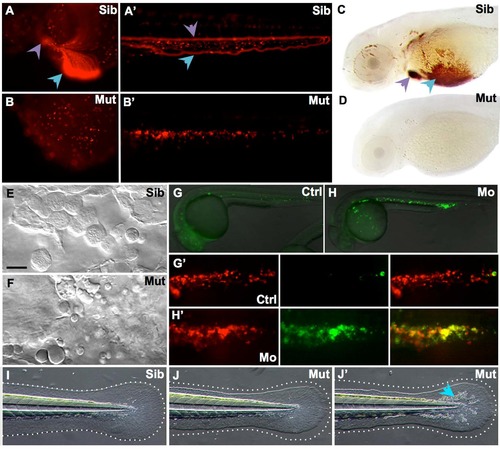
MonNQ039 mutants and Trim33 morphants share phenotypic traits with monTB222 mutants. (A-B') In vivo images of DsRed+ erythroid cells in monNQ039Tg(gata1:DsRed) embryos at 48 hpf in the yolk sac (A,B) or tail (A',B') of sibling (A, A') and mutant (B,B') embryos. Circulating erythrocytes can be seen in the siblings heart (a, purple arrowhead) and duct of Cuvier (A, blue arrowhead), as well as in their caudal artery (A', purple arrowhead) and caudal vein (A', blue arrowhead), but not in the moonshine mutant (B-B'). (C,D) Whole mount O-dianisidine staining of hemoglobin-loaded erythrocytes at 72 hpf in the anterior region of sibling (C) and mutant (D) monNQ039/Tü larvae. Erythrocytes can be seen in the duct of Cuvier (blue arrowhead) and heart (purple arrowhead) of sibling but not mutant larvae. (E-F) In vivo video-enhanced Nomarski microscopy at 18 hpf reveals that the Posterior Blood Island of a monNQ039 mutant (F) is full of apoptotic bodies instead of erythroid progenitors as seen in the sibling (E). (G-H') In vivo images of whole (G,H) or PBI (G',H') of Tg(TBP:Gal4;UAS:AnV-YFP) (G,H) or Tg(TBP:Gal4/UAS:AnV-YFP; gata1a:DsRed) (G',H') embryos at 26 hpf. Embryos injected with the Trim33 morpholino (H,H’) have a lot of apoptotic cells (green channel) corresponding to erythroid progenitors (red channel), unlike in the control embryos (G,G'). (I-J') MonNQ039 mutants (J-J') display a smaller and more irregularly shaped caudal fin than their siblings (I), as shown by the dotted line. Some mutants also have more iridophores (J', blue arrowhead). Ctrl, control; Mo, morphant; Mut, mutant; Sib, sibling. PHENOTYPE:
|
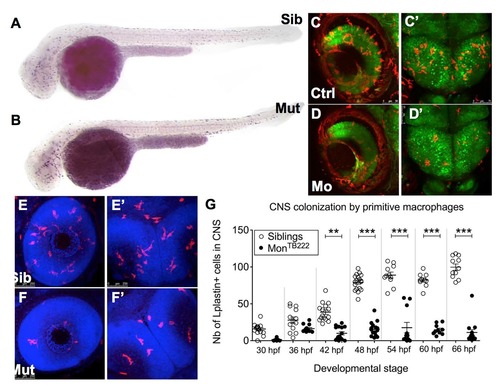
Macrophages do not colonize the CNS in monTB222 mutants and Trim33 morphants. (A-B) Csfr1a ISH at 36 hpf shows that the initial primitive macrophage production and spreading in the monTB22 mutant (B) are similar to the sibling (A). (C-D') In vivo images of retinas (C,D) or midbrain (C'-D') of 3 days old Tg(HuC:GFP; mpeg1:Gal4; UAS:NfsB-mCherry) embryos injected (D-D') or not (C,C') with the Trim33 morpholino. Trim33 KO (D,D') causes macrophage depletion in both CNS compartments. (E-G) Lplastin whole-mount immunodetection (combined with DAPI detection of cell nuclei) in monTB222/Tü siblings (E,E') and mutants (F,F') reveals numerous leukocytes (macrophages) in the retinas (E) and midbrain (E') of 3 days old siblings, whereas there are only a few in the mutants. Counting of these cells every 6 hrs from 30 to 66 hpf reveals that monTB222 mutants have less leukocytes in the CNS at all stages. Ctrl, control; Mo, morphant; Mut, mutant; nb, number; Sib, sibling. **, P value <0.01; ***, P value < 0.001. EXPRESSION / LABELING:
|
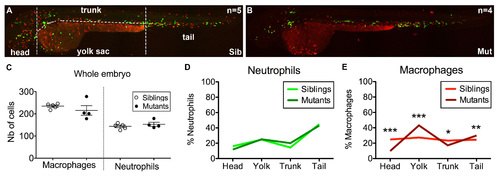
Distribution of macrophages and neutrophils in moonshine vs. sibling zebrafish embryos. (A,B) In vivo images of monNQ039Tg(mpeg1:mCherryF; mpx:GFP) sibling (A) and mutant (B) embryos at 2 dpf. (C) Total counts of macrophages and neutrophils in siblings (n=5) and mutant (n=4) embryos. (D,E) Distribution (in %) of neutrophils (D) and macrophages (C) among the four regions in which each embryo was subdivided as indicated in (A). PHENOTYPE:
|
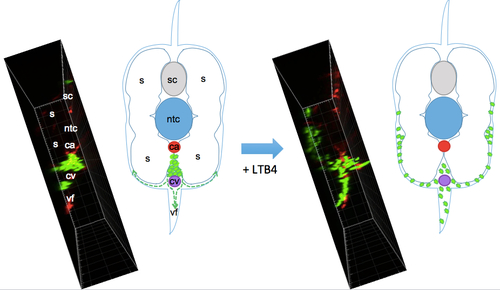
Scheme of the migration path of neutrophils from the CHT induced by bath addition of LTB4. While embryos were imaged in lateral view as in Fig. 5D,E and Movie 6, this scheme depicts the same caudal region but in cross section, so as to show the migration path of neutrophils (green) initially in the CHT, between caudal artery (ca) and vein (cv), upon bath addition of LTB4; they migrate beneath the skin that overlies the ventral fin (vf) and somitic muscles (s). To the left of each drawing is a similarly oriented view of neutrophil distribution in a live wt embryo before and after LTB4, obtained by orthogonal projection of the confocal image stacks acquired in lateral view from the left side, as shown in maximal projection in Fig. 5D and Movie 6 (left panel). Ntc, notochord; sc, spinal cord. |