
- Title
-
The zebrafish kidney mutant zeppelin reveals that brca2/fancd1 is essential for pronephros development
- Authors
- Kroeger, P.T., Drummond, B.E., Miceli, R., McKernan, M., Gerlach, G.F., Marra, A.N., Fox, A., McCampbell, K.K., Leshchiner, I., Rodriguez-Mari, A., BreMiller, R., Thummel, R., Davidson, A.J., Postlethwait, J., Goessling, W., Wingert, R.A.
- Source
- Full text @ Dev. Biol.
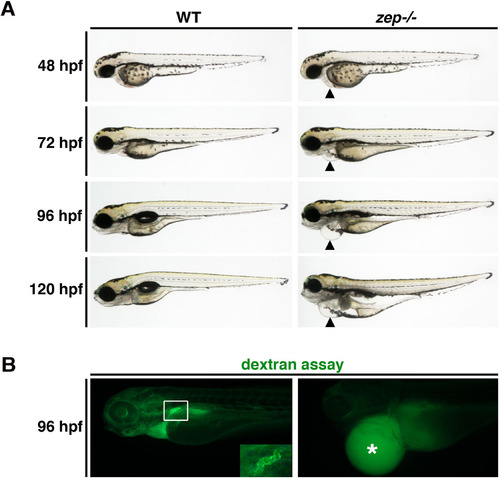
zepmutants acquire edema and display altered fluid clearance. (A) Compared to live WT siblings, zep mutant embryos have acquired an edematic phenotype that progresses in severity throughout the lifespan of the animal. In zep, the location of the pericardial cavity (black arrowhead) showed no edema at 48 hpf, while subtle edema was detected at 72 hpf which progressed in severity at 96 and 120 hpf. (B) Following microinjection of 40 kDa dextran-FITC into the vasculature at 72 hpf, WT siblings exhibited endocytosis by the proximal tubule (white box and inset) at 96 hpf, while zep embryos showed accumulation of fluorescence in edemic areas and the yolk (asterisk) and failed to exhibit proximal tubule uptake. Embryos are shown in lateral views. |
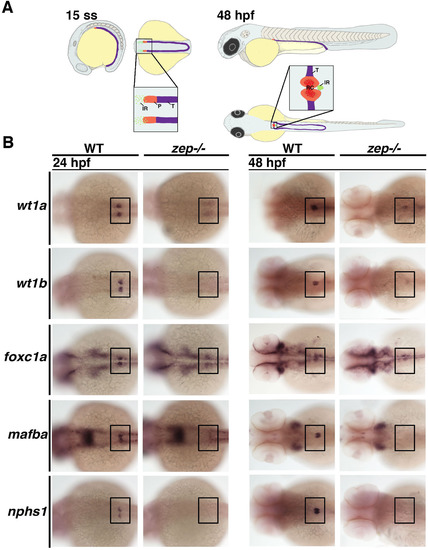
zepmutants fail to normally develop the podocyte lineage during nephrogenesis. (A) Location of podocyte and interrenal precursors and the result of their morphogenesis during early zebrafish embryonic development. (Left) The podocyte lineage (P, red) emerges rostral to the tubule lineages (T, purple) of the intermediate mesoderm at the 15 ss, while precursors of the interrenal gland (IR, green) are interspersed in the local vicinity of the podocyte precursors. (Right) By 48 hpf, morphogenesis events result in a single IR that is situated posterior to the fused glomeruli of the renal corpuscle (RC). Embryo drawings show lateral and dorsal views, with enlarged regions showing dorsal views. (B) Compared to WT siblings, zep mutant embryos have extremely reduced or absent expression of a suite of podocyte markers at the 24 and 48 hpf stages. Embryos are shown in dorsal views with each indicated gene expression stained in purple, where black boxes demarcate the cervical region where the podocytes develop. |
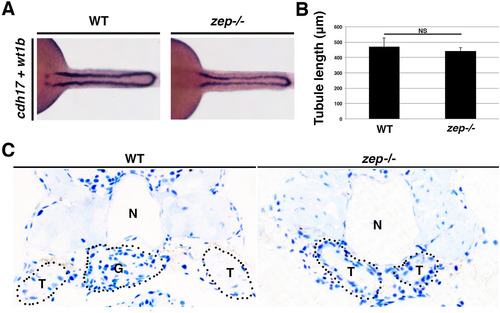
zepmutants show normal tubule development and fail to form a normal glomerulus. (A) WT and zep mutant embryos exhibit similar pairs of nephron tubules, which (B) are not statistically different in length. Embryos are shown in dorsal views. (C) Histological analysis of cross-sections (top, dorsal and bottom, ventral) from the cervical region of WT and zep embryos at 5 dpf. zep lack a midline glomerulus (G) ventral to the notochord (N), and the flanking tubules (T) are distended compared to WTs, consistent with the morphological appearance of edema. Black dotted lines outline the approximate perimeters of the indicated structures. |
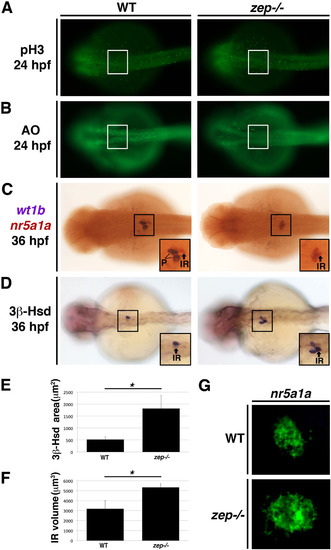
Reduction of podocytes inzepmutants occurs concomitantly with an expansion of the interrenal lineage. WT siblings and zep mutants have no difference in (A) cell proliferation based on pH3 staining and showed no differences in the amount of cell death (B) based on AO staining in the area where podocytes and interrenal cells arise. In contrast, (C) WT siblings have bilateral clusters of podocytes (P), identified by wt1b transcript localization (purple), and a centralized interrenal (IR) gland at the midline, identified by localization of nr5a1a transcripts (red) at 36 hpf. zep mutants show abrogated wt1b expression and a distinctly increased region of cells that express nr5a1a transcripts. (D) The region of cells exhibiting 3β-HSD staining is increased in zep mutants compared to WT siblings, with the area quantified (E). (F,G) There is significant increase of nearly two-fold in the volume occupied by the hormone secreting interrenal gland cells in zep mutants compared to WT, as visualized by FISH and confocal microscopy. Asterisks (*) indicate p < 0.001 using student T-test. Embryos are shown in dorsal views, where the white or black boxes demarcate the cervical region where podocytes and the interrenal gland develop. Insets show digital zoom view of 150%. |
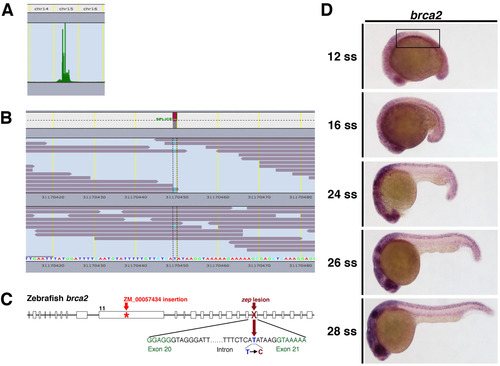
WGS identifies that thezepmutation is located in thebrca2gene. (A) SNP analysis localized the zep lesion to chromosome 15. Upon further analysis of the region of interest, (B) zep mutants were found to have a T to C mutation at the splice acceptor site between exons 20 and 21 of the brca2 gene. (C) Schematic of the brca2 gene with the zep and brca2ZM_00057434 mutant alleles indicated. (D) brca2 expression is ubiquitous between the 12 ss and the 28 ss, though slightly elevated transcript levels are observed in the region of IM at 12 ss where the proximal pronephros and interrenal gland emerge (boxed area). Embryos shown in lateral views. EXPRESSION / LABELING:
|
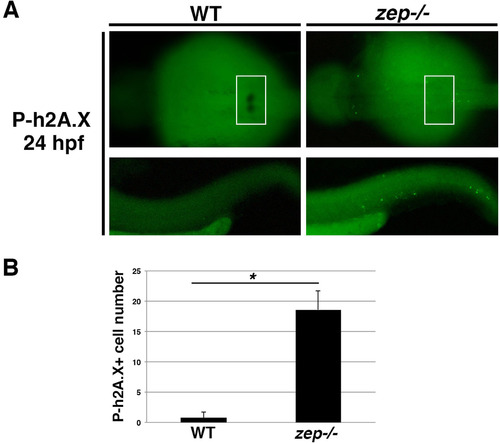
zepmutants exhibit elevated DNA damage. (A) WT and zep embryos were double labeled to detect podocytes by WISH for wt1b transcripts followed by whole mount immunohistochemistry to detect phosphorylated h2A.X (P-h2A.X), a marker of double strand breaks. Top panels show a dorsal view of the cervical region where podocytes develop, indicated by the white boxed region. Bottom panels show a lateral view of the tail, which was the area utilized for quantification. (B) Quantification of P-h2A.X+ cells in the tail region revealed a statistically significant increase in zep compared to WT. Asterisk (*) indicates p < 0.0001 using student T-test. |
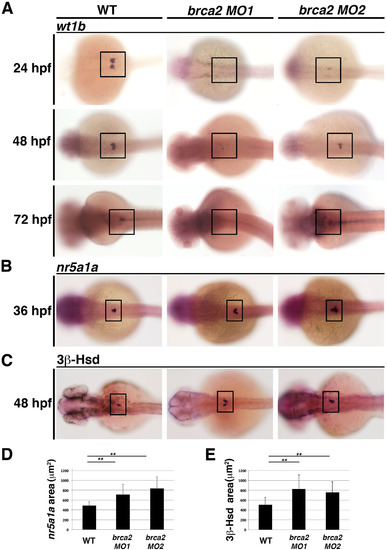
Knockdown ofbrca2causes a reduction in expression of the podocyte markerwt1band an increase in the interrenal gland lineage. (A-C) At 24, 48 and 72 hpf, WT embryos display normal wt1b expression in podocytes, while microinjection of an MO targeting the brca2 start (MO1) or the splice acceptor of exon 21 (MO2) recapitulated the zep mutant phenotype, as observed by a reduction or complete abrogation of wt1b transcripts as assessed by WISH. Further, brca2 morphants had elevated (B) nr5a1a transcripts as assessed by WISH and (C) increased 3β-HSD chromogenic staining, which are quantified in (D,E), respectively. Asterisks (**) indicate p < 0.001 using student T-test. Embryos are shown in dorsal views, where black boxes demarcate the cervical region where podocytes and the interrenal gland develop. EXPRESSION / LABELING:
PHENOTYPE:
|
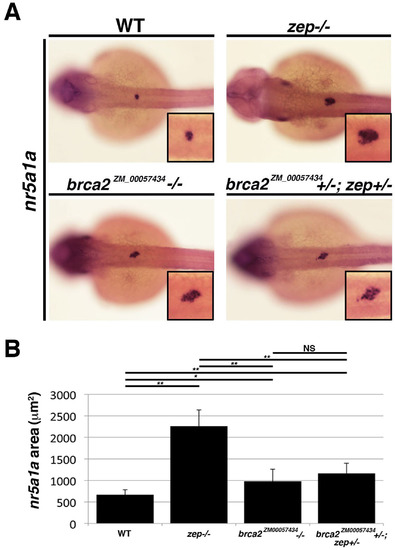
zepandbrca2ZM_00057434fail to complement one another. (A) Gene expression analysis of the interrenal marker nr5a1a in WT, zep -/-, brca2ZM_00057434 -/- and compound heterozygous brca2ZM_00057434+/-; zep +/- mutants revealed that brca2ZM_00057434 -/- have a modest but (B) statistically significant elevation in the area of nr5a1a expression that was similar to compound heterozygous embryos. Embryos are shown in dorsal views with insets showing digital zoom of 150%, where black boxes demarcate the cervical region where the interrenal gland develops. Asterisks (*) indicate p < 0.05, (**) p < 0.01 using student T-test. |
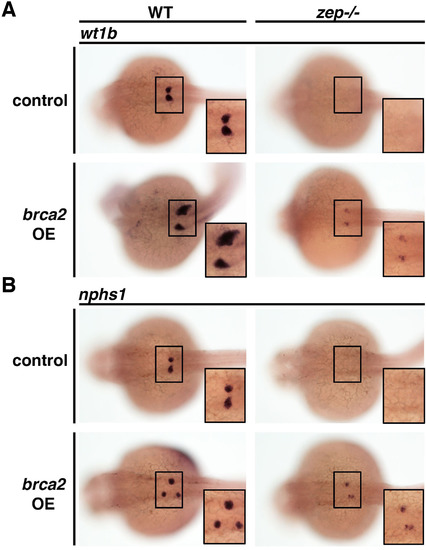
brca2overexpression is sufficient to partially rescuezepand also induces ectopic podocytes in wild-type embryos. Overexpression of full-length brca2 cRNA partially restored expression of (A) wt1b and (B) nphs1 in zep -/- and was associated with the induction of ectopic podocytes in a small percentage of WT siblings (see text for incidence). Embryos are shown in dorsal views with insets showing digital zoom of 150%, where black boxes demarcate the cervical region where the podocytes develop. |
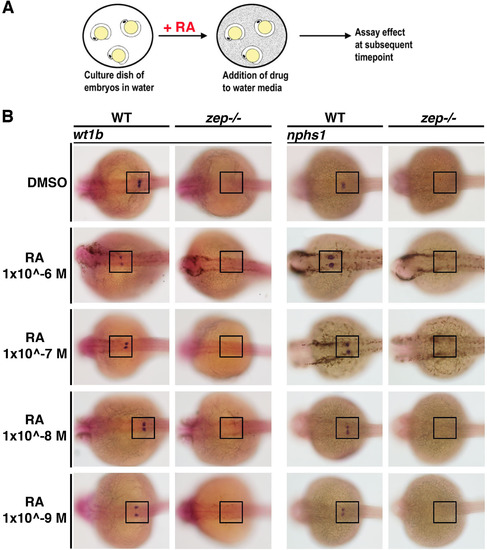
Addition of exogenous RA during nephrogenesis fails to rescue establishment of the podocyte lineage inzepmutant embryos. (A) Schematic of exogenous RA treatment methodology in zebrafish embryos. (B) While WT siblings exhibit normal podocyte development after RA treatment, zep mutants fail to develop podocytes as assayed by expression of wt1b or nphs1. Embryos are shown in dorsal views, where black boxes demarcate the cervical region where the podocytes develop. |
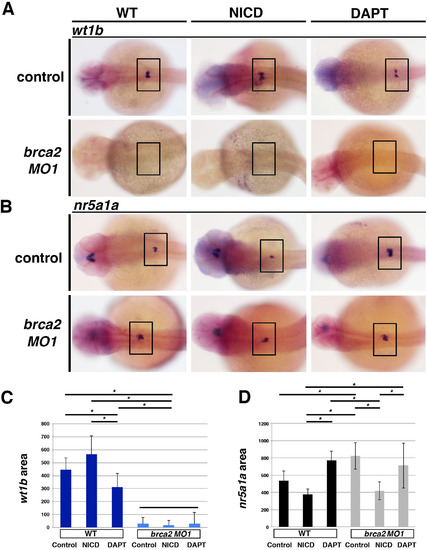
Alterations in Notch signaling mediate podocyte and interrenal genesis. (A,B) Gain and loss of function Notch experiments with Tg(hsp70::GAL4, UAS::NICD) and DAPT chemical treatments were performed in WT and brca2 morphants to assess podocyte development by WISH for wt1b and interrenal development by WISH for nr5a1a. Embryos are shown in dorsal views, where black boxes demarcate the cervical region where the podocytes and interrenal gland develop. (C,D) The standard deviation of triplicate groups, consisting of at least 5 embryos per group, was statistically analyzed by ANOVA with Tukey test. WT embryos had statistically significant reduced podocytes with DAPT. brca2 morphants failed to develop podocytes after NICD or DAPT. brca2 morphants had a reduced interrenal field following NICD that was statistically significant compared to non-heat shocked controls. Asterisks (*) over black bars indicate p < 0.05 between the respective groups, and the black bar in (C) indicates that the brca2 MO1 groups are not significantly different from each other while all are significantly different from the WT Control, NICD and DAPT groups. |
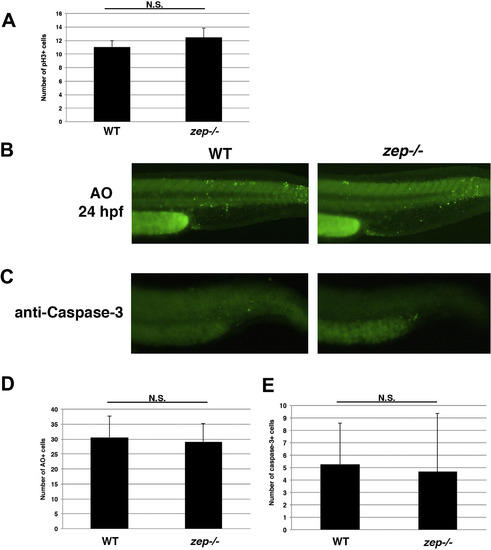
Further assessment of cell proliferation and death inzepmutants. (A) The number of pH3+ cells was quantified in the cervical region of WT and zep embryos at the 24 hpf stage. The quantity of pH3+ cells was not statistically different as assessed by student T-test. (B) Whole mount AO staining and (C) anti-Caspase-3 immunostaining of the tail region in WT and zep embryos revealed similar levels of cell death, which was assessed by student T-tests (D, E) respectively. |
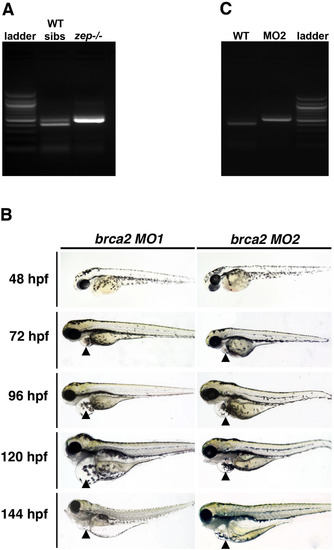
brca2transcript analysis inzepmutants andbrca2morphants, and live morphology ofbrca2morphants. (A) RT-PCR analysis of brca2 transcripts in pools of zep embryos compared to WT control siblings (which included WT and heterozygous embryos), where embryos were scored into these groups based on edema at embryonic day 6. WT/heterozygous pools had normally spliced transcripts as well as variants that corresponded to inclusion of the 92 basepair intron 20–21 (see band doublet). zep mutant pools contained only the longer variant with the intron (top band). (B) RT-PCR of brca2 transcripts in brca2 MO2 injected embryos compared to WT control siblings revealed inclusion of the 92 basepair intron 20–21 only in the morphant pool, and WT transcripts were not detected. (C) WT embryos were microinjected with a brca2 start morpholino (MO1) or a morpholino designed to the splice acceptor site (MO2) of exon 21, and live morphology was observed over the subsequent 6 days of development. Morphants recapitulated the zep mutant embryo phenotype such that they developed pericardial edema (black arrowhead), starting by 72 hpf, which progressed in severity through the 144 hpf stage. Embryos are shown in lateral views. |
Reprinted from Developmental Biology, 428(1), Kroeger, P.T., Drummond, B.E., Miceli, R., McKernan, M., Gerlach, G.F., Marra, A.N., Fox, A., McCampbell, K.K., Leshchiner, I., Rodriguez-Mari, A., BreMiller, R., Thummel, R., Davidson, A.J., Postlethwait, J., Goessling, W., Wingert, R.A., The zebrafish kidney mutant zeppelin reveals that brca2/fancd1 is essential for pronephros development, 148-163, Copyright (2017) with permission from Elsevier. Full text @ Dev. Biol.