
- Title
-
Pioneer neurog1 expressing cells ingress into the otic epithelium and instruct neuronal specification.
- Authors
- Hoijman, E., Fargas, L., Blader, P., Alsina, B.
- Source
- Full text @ Elife
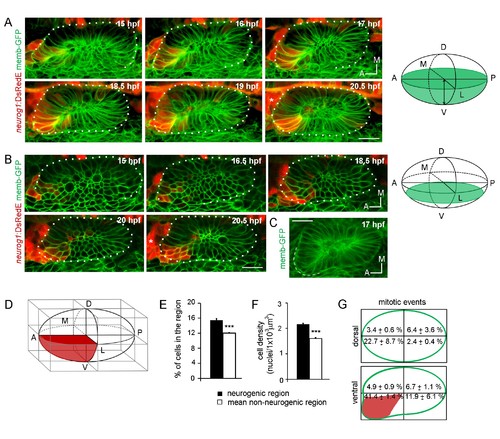
Specification dynamics and morphogenesis of the otic neurogenic domain. (A,B) Selected frames of a video of an otic placode from a TgBAC(neurog1:DsRedE)n16 embryo shown in (A) 3D reconstructions (dorsal view) and (B) coronal ventral planes. Green in the right schemes shows the region imaged. Membranes are stained with memb-GFP. D:dorsal, V:ventral, A:anterior, P:posterior, M:medial and L:lateral. The asterisk indicates the region where the SAG is forming. Medial to the otic vesicle, DsRedE is also expressed in the neural tube. (C) Averagez-projection (dorsal view) of the inner ear at 17 hpf. Dashed line indicates the protuberance. (D) Scheme of the rectangular cuboid used for quantifications. Neurogenic region is shown in red. (E,F,G) Quantification of the number of cells (E), the cellular density (F) and mitotic events (G) in the indicated regions at 19 hpf (n = 11) (E,F) or between 14 and 18.5 hpf (n = 2) (G). Data are mean ± s.e.m. ***p<0.0001 one sample t-test in (E) and unpaired t-test (F). Scale bars, 20 µm. Dotted lines outline the limits of the otic vesicle. |
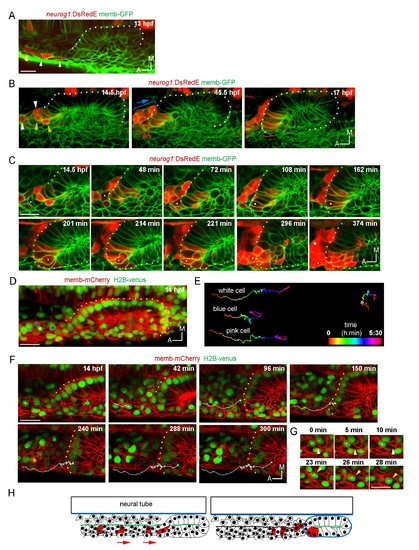
Ingression of neurog1+ cells. (A) The otic epithelium and its anterior region at 13 hpf. Arrowheads highlight neurog1+ cells outside the otic epithelium. (B) Selected frames of a 3D reconstruction (dorsal view) of the otic placode following the movement of the anterior neurog1+ cells. Arrowheads at 14.5 hpf indicate neurog1+ cells before epithelialisation (white: cells outside the placode, orange: ingressing cells). At 15.5 hpf red bracket identifies cells that will ingress (shown at 17 hpf) and blue bracket cells that will not ingress. In (A) and (B) the contrast of the red signal was increased to improve visualisation. (C) Selected planes of a 3D tracking of a single cell specifying during ingression (white dot). At 108 min the cell is already epithelialised. Asterisk indicates the SAG. (D–F) 3D tracking of single cells during ingression. (D) 3D reconstruction (dorsal view) showing the initial position of the tracked cells (white, pink and blue dots) at 14 hpf. The violet dot indicates the posterior vertex of the placode. (E) 2D visualisation of the 3D tracks shown in (D) are displayed in a temporal color code. Each track was displaced in the y axis for better visualisation. The track of the posterior vertex of the placode is shown on the right (see also Figure 2D). (F) Selected frames for the cell of the white track. At 150 min the cell is ingressing and completed at 240 min. At 300 min cytokinesis occurs. Membranes are stained with memb-mCherry. Embryos are Tg(actb:H2B-venusFP). (G) Selected planes showing cell-membrane displacements during migration of the cell tracked in (F). White arrowheads indicate protrusion of the cell front and orange arrowheads the position of the nucleus. (H) Schematic representation of the migration and ingression during epithelialisation (see Figure 2—figure supplement 1 for further details). Blue line: laminin, green line: actin layer, red cells: neurog1+ cells, red arrows: migration of neurog1+ cells towards the otic placode. Scale bars, 20 µm. Dotted lines outline the limits of the otic vesicle. |
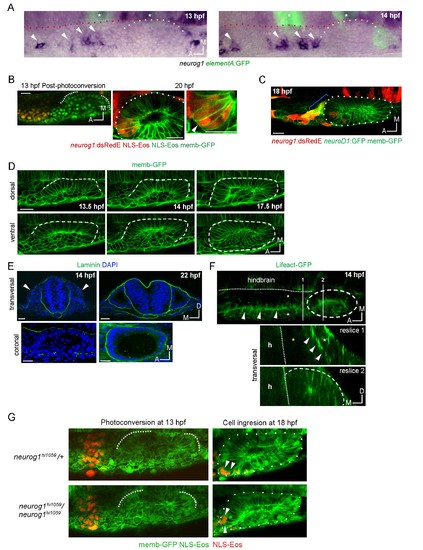
Morphogenetic features related to ingression. (A) Whole mount ISH for neurog1 from 13 and 14 hpf Tg(elA:GFP) embryos. This transgenic line expresses GFP in rhombomeres 3 and 5 (asterisks, at early stages rhombomere three express higher levels than rhombomere 5), facilitating the spatial localization of the otic placode. An immunostaining for GFP was performed after the in situ hybridisation. Dotted lines highlight the limits of the hindbrain (red) and the forming otic placode (white). White arrowheads indicate neurog1 expression. (B) Photoconversion of NLS-Eos stained nuclei at 13 hpf in a region anterior to the epithelium in TgBAC(neurog1:DsRedE)n16 embryos expressing memb-GFP. At 20 hpf photoconverted nuclei were observed in neurog1+ cells inside the vesicle (arrowhead). (C) GFP reporting neurod1 expression in the non-ingressing pool of cells at 18 hpf (in the SAG region) from Tg(neurod:GFP) embryos (blue bracket). Embryos are also TgBAC(neurog1:DsRedE)n16 and express memb-GFP. (D) Early stages of otic epithelialisation. Dashed line indicates the epithelialised part of the otic vesicle. Membranes are stained with memb-GFP. (E) Laminin staining at 14 and 22 hpf in transversal and coronal sections. Nuclei are counterstained with DAPI. White arrowheads indicate the forming otic placode. (F) 3D reconstruction (dorsal view) of an otic vesicle and its anterior region at 14 hpf from a Tg(actb1:Lifect-GFP) embryo. The white arrowheads indicate the actin layer that divides latero-medially the tissues lateral to the hindbrain in two regions (white and yellow asterisks, see also reslice 1). Reslices, built from the white bars 1 and 2 shown in the 3D reconstruction, show transversal sections anterior (reslice 1) or at the position (reslice 2) of the otic placode (dashed line). h: hindbrain (dotted line). (G) Cell ingression evaluated using NLS-Eos photoconversion at 13 hpf in neurog1hi1059 mutant embryos injected at 1 cell stage with memb-GFP and NLS-Eos mRNAs. White arrowheads indicate ingressed cells at 18 hpf. See also Figure 2H for a scheme of the morphological features described in this figure. Scale bars, 20 µm. Dotted lines in (A–C) outline the limits of the otic epithelium/vesicle. |
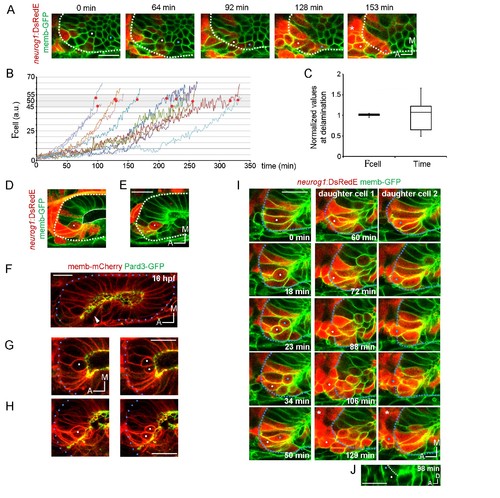
Local specification and divisions of neurog1 expressing cells. (A) Selected planes showing DsRedE expression dynamics in locally specified cells (white and blue dots) from TgBAC(neurog1:DsRedE)n16 embryos expressing memb-GFP. Asterisk indicates the SAG. The embryo is 16.5 hpf at the beginning of the time-lapse. (B) Quantification of DsRedE fluorescence over time for 11 cells locally inducing neurog1. Red dots indicate beginning of delamination. The gray region highlights the interval of fluorescence levels at which all cells delaminate. (C) Box plot made from the quantifications shown in (B), illustrating that at the moment of delamination, the time elapsed from the initiation of neurog1 expression is highly variable, while the expression levels are not. The value for each cell was normalized by the mean of the cell group. (D,E) neurog1+ mitotic cells (white dots) contacting (D) or not (E) the central lumen (dashed line). 19 (D) and 17 (E) hpf embryos are shown. (F) Pard3-GFP localisation in the central lumen and the anterolateral region (white arrowhead). Membranes are stained with memb-mCherry. (G,H) Divisions (white dots) located in the lumen (G) or the apical scaffold (H, z-projection). 20 (G) and 18 hpf (H) embryos are shown. (I) Selected planes from a 3D time-lapse of a neurog1+ mitosis. White and blue dots track the daughter cells. Dashed lines indicate the approximated limit of the vesicle. Selected planes for each daughter cell are shown from 60 min onwards. At 129 min cells are delaminated. Asterisk indicates the SAG. The embryo is 18 hpf at the beginning of the time-lapse. (J) Reslice of a frame at 98 min from the video shown in (H) showing the z proximity between the tracked daughter cells during delamination (the red signal was removed for better visualisation). Scale bars, 20 µm. Dotted lines outline the limits of the otic vesicle. |
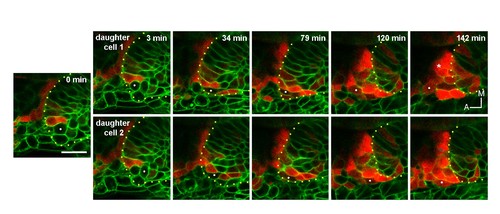
Cell division can precede neurog1 expression. 3D tracking of a neurog1− cell (white dot) that divides and subsequently their daughters express DsRedE and delaminate. Dotted lines outline the limits of the otic vesicle. Asterisk indicates the SAG. |
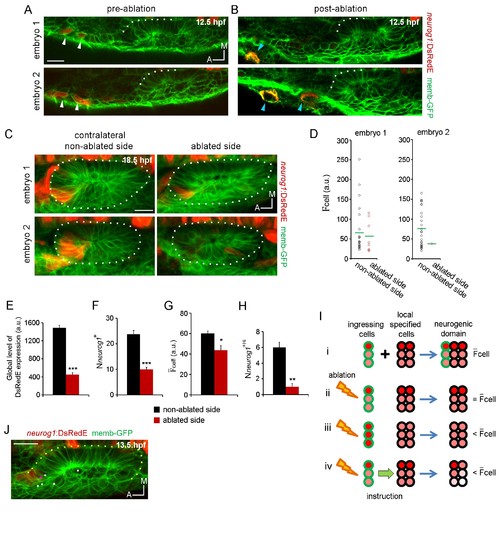
Ingressing cells instruct local neuronal specification. (A,B) Laser ablation of neurog1+ cells before ingression. Two different embryos are shown. Images of the otic epithelium and its anterior region at 12.5 hpf just before (A) and after (B) laser-ablation. White arrowheads indicate neurog1+ cells. Blue arrowheads localise the ablated region. Embryo 1 only received one laser pulse and embryo 2 three laser pulses (only two are visible in this plane). The contrast of the red signal was increased to improve visualisation. (C–H) neurog1 expression pattern inside the vesicle after ablation. (C) Average z-projections of embryos shown in (A,B) 5 hr after ablation (18.5 hpf). The ablated side and their contralateral non-ablated side of the same embryo are shown. (D) Quantification of cell in each neurog1+ cell of the vesicles shown in (C). Each dot indicates one cell. Green lines indicate the mean of each condition. The number of neurog1+ cells in each vesicle is: embryo 1, non-ablated side: 24, ablated side: 8; embryo 2, non-ablated side: 25, ablated side: 2. (E–H) Parameters of neuronal specification at the single cell level are shown: global level of DsRed expression (E) Nneurog1+ (F), cell (G), and Nneurog1+Hi (H). Data are mean ± s.e.m. (n = 6). t-test ***p<0.0001, **p<0.0005, *p<0.05. (I) Scheme with of different explanations of how early ablation of ingressing cells influences cell inside the vesicle at later stages. (i) In absence of cell ablation the neurogenic domain is composed by ingressing and local specified cells, with a characteristic value for |
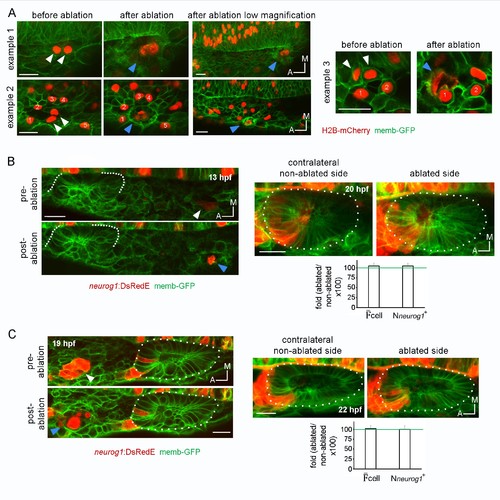
Calibration and specificity of ablation experiments. (A) Calibration of cell ablations. A laser pulse (as described in Materials and methods) was applied to embryos expressing H2B-mCherry in a mosaic manner lateral to the neural tube. In example 1, two nuclei were stained in the imaged region before ablation (white arrowheads). After the laser pulse, a red ablation bubble was observed as consequence of the death of the two stained cells (blue arrowhead). In example 2, the nuclei of neighbouring cells (numbered from 1 to 5) are surrounding two target cells (white arrowheads). Imaging after ablation indicated that the targeted cells died, but the neighbouring cells remained healthy and only slightly displaced in space. In example 3, a similar behavior as in example two can be observed, but the intact neighbouring cells are in close contact with the dead cells, highlighting the fact that ablation is highly specific and restricted to the targeted cells (white arrowheads, see also Video 14). (B) and (C) Ablation at a posterior region or a late developmental stage. On the left, laser ablation of neurog1+ cells located posterior to the otic epithelium at 13 hpf (B) or anterior to the otic vesicle at 19 hpf (C). White arrowheads indicate neurog1+ cells. Blue arrowheads localise the ablated region. The embryos received one laser pulse. On the right, z-projection images of neurog1 expression pattern inside vesicles at 20 (B) or (22) hpf from the ablated and contralateral non-ablated sides of the embryo are shown. Quantifications of the cell and the Nneurog1+ are shown as the fold change of ablated/non-ablated sidesx100 (n = 5 in (B) and n = 7 in (C)). Data are mean ± s.e.m. Scale bars, 20 µm. Dotted lines outline the limits of the otic epithelium/vesicle. |
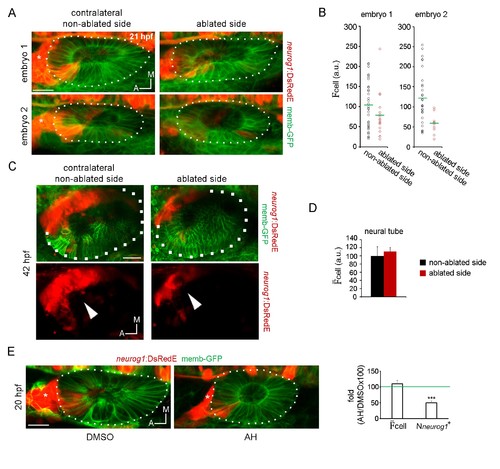
Late neurogenic phenotypes after ablation and specification analysis of non-proliferative otic placodes. (A) Z-projection images of the embryos shown in Figure 4, A and B, 8 hr after ablation (21 hpf). The ablated side and their contralateral non-ablated side of the same embryo are shown (images are representative of the phenotypes observed in 4 embryos at this stage, see also Video 12). Asterisk indicates the SAG. (B) Quantification of the mean DsRedE fluorescence in each neurog1+ cell of the vesicles shown in (A). Each dot indicates one cell. Green lines indicate the mean of each condition. (C) Z-projection images of otic vesicles and the SAG at 42 hpf from an neurog1-DsRedE embryo ablated at 13 hpf (the ablated side and their contralateral non-ablated side of the same embryo are shown). Note the reduction in size of the SAG in the ablated size of the embryos. Images are representative of 3 embryos analysed. (D) Quantification of the cell in a region of the neural tube adjacent to the otic vesicle 5 hr after ablation (18 hpf). Data are mean ± s.e.m. (70 cells were counted in each region, n = 3). (E) Z-projection images of neurog1 expression pattern inside the vesicle at 20 hpf in DMSO and AH treated embryos. On the right, quantifications of the cell and the Nneurog1+ are shown as the fold change of the AH group respect to the DMSO group (n = 14 for DMSO and n = 12 for AH). Data are mean ± s.e.m. t-test, ***p<0.0001. Scale bars, 20 µm. Asterisk indicates the SAG. Dotted lines outline the limits of the otic vesicle. |
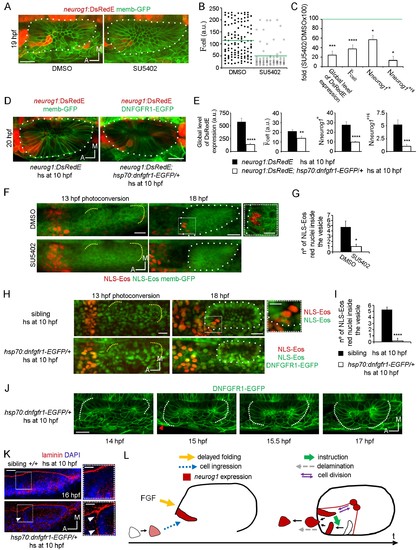
FGF control of neuronal specification. (A–C) neurog1 expression pattern inside the vesicle in embryos incubated in DMSO or SU5402. (A) Images of otic vesicles at 19 hpf incubated from 11 hpf in DMSO or SU5402 (ventral planes). (B) Quantification of cell for cells of vesicles from the groups shown in (A). Each dot indicates one cell. Green lines indicate the mean of each condition. n = 5 for DMSO and n = 6 for SU5402. (C) Parameters of neuronal specification at the single cell level for the data shown in (B): global level of DsRed expression, cell, Nneurog1+ and Nneurog1+Hi are shown as fold change of SU5402/DMSOx100. (D,E) neurog1 expression pattern inside the vesicle from neurog1:DsRedE;hsp70:dnfgfr1-EGFP/+ or neurog1:DsRedE embryos heat-shocked at 10 hpf. (D) Z-projections of otic vesicles at 20 hpf. (E) Parameters of neuronal specification are shown: global level of DsRed expression, cell, Nneurog1+ and Nneurog1+Hi (n = 8). (F) Photoconversion at 13 hpf of NLS-Eos stained nuclei in a region anterior to the otic epithelium. Embryos expressed memb-GFP and were treated with DMSO or SU5402 from 11 hpf (z-projections). At 18 hpf, photoconverted nuclei is observed inside the vesicle of the DMSO treated embryo. High magnification in the right (dotted square, Scale bar 10 µm). Yellow dotted lines indicate the limits of the otic epithelium. (G) Quantification of the number of photoconverted nuclei inside the vesicle (n = 6 for DMSO and n = 7 for SU5402). (H,I) Photoconversion experiments as in (F,G) but on hsp70:dnfgfr1-EGFP/+ and sibling embryos heat-shocked at 10 hpf. (H) Z-projections of the photoconversion and cell ingression. (I) Quantification of the number of photoconverted nuclei inside the vesicle (n = 7 for siblings and n = 6 for hsp70:dnfgfr1-EGFP/+). (J) Selected images from a time-lapse of hsp70:dnfgfr1-EGFP/+ embryos heat-shocked at 10 hpf. Note that as early as 14 hpf the anterior part of the otic tissue is already folding, at 15 hpf the process is advanced (red arrowhead), and at 15.5 hpf the anterior and posterior regions seem to be symmetrically folded (see also Video 13). (K) Laminin immunostainings at 16 hpf in hsp70:dnfgfr1-EGFP/+ and sibling embryos heat-shocked at 10 hpf. The nuclei were counterstained with DAPI. High magnification in the right (dotted square, Scale bar 10 µm). The images are representative of 6 embryos analysed. Note the formation of a continuous layer of laminin in some regions (white arrowheads). (L) Scheme of cell dynamics playing a role in neuronal patterning of the inner ear. FGF signalling delays anterior tissue folding allowing the ingression of pioneer neurog1+ cells in the prospective neurogenic domain of the otic epithelium. These pioneer cells promote neurog1 expression in other cells of the neurogenic domain. In addition, neurog1+ cells divide symmetrically and delaminate. Data are mean ± s.e.m. t-test ****p<0.001, ***p<0.005, **p<0.01, *p<0.05. Scale b |
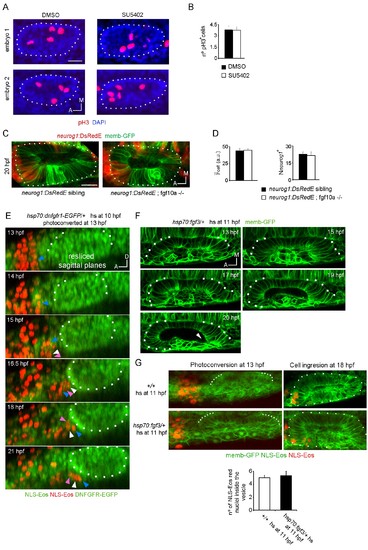
Analysis of cell division controlled by SU5402 and neurog1 expression in FGF10a mutant embryos. (A) pH3 immunostainings at 16 hpf in otic vesicles from DMSO and SU5402 treated embryos. Two embryos in each experimental group are shown. The nuclei were counterstained with DAPI. (B) Quantification of the pH3 immunostainings (n = 12). (C) and (D) neurog1 expression pattern inside the vesicle in neurog1-DsRedE;fgf10a-/- or neurog1-DsRedE; sibling embryos. (C) Z-projection images of vesicles at 20 hpf. (D) Quantifications of the cell and the Nneurog1+ are shown (n = 10 for siblings and n = 5 for fgf10-/-). (E) 3D Tracking of photoconverted NLS-Eos nuclei in hsp70:dnfgfr1-EGFP/+ induced embryos. Z-projections of resliced sagittal sections are shown. Arrowheads indicate examples of tracked nuclei (each color correspond to a different cell). The cells indicated with white and pink arrowheads in the latter panels were not identified in the two first time points, due to their lateral movement out and in of the video during the posterior migration. (F and G) Tissue folding analysis (G) or cell ingression analysis by NLS-Eos photoconversion (F) during placode formation in FGF3 overexpressing embryos (heat-shock at 11 hpf of the Tg(hsp70:fgf3) line). In (F) the posterior region remains unfolded at late stages (20 hpf). Arrowhead: a deformation of the lumen is observed in the posterior region of the vesicle, which is found only anteriorly in wild type embryos associated with the unfolded tissue. Data are mean ± s.e.m. Scale bars, 20 µm. Dotted lines outline the limits of the otic vesicle. |