
- Title
-
TNFa/TNFR2 signaling is required for glial ensheathment at the dorsal root entry zone
- Authors
- Smith, C.J., Wheeler, M.A., Marjoram, L., Bagnat, M., Deppmann, C.D., Kucenas, S.
- Source
- Full text @ PLoS Genet.

DRG pioneer axons navigate directly to the DREZ. (A) Images and traced schematics from a 24 hour time-lapse movie starting at 48 hpf in a Tg(ngn1:egfp) embryo showing navigation of the DRG pioneer axon toward the DREZ. Orange box indicates location of DREZ. Arrows denote the growth cone and arrowheads denote location of cell body. Blue process in schematic denotes peripheral axon. (B) Quantification of the distance (y-axis) and time (x-axis) of 4 growth cones as they navigated toward the DREZ. (C) Schematic tracings of 3 pioneer axons as they navigated to the DREZ. Compass shows Dorsal-D, Ventral-V, Anterior-A, Posterior-P. Scale bar, 25 μm. |
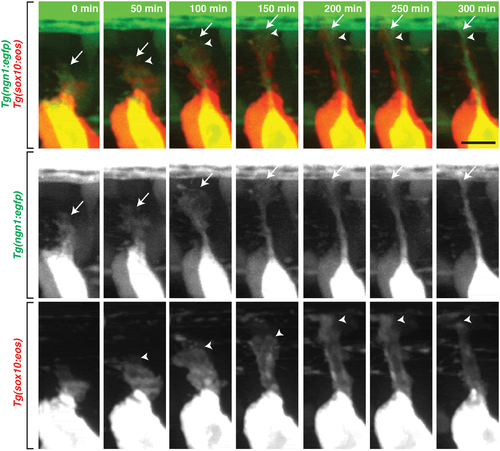
DRG glia navigate with pioneer axons. Images from a 24 hour time-lapse movie starting at 48 hpf in a Tg(sox10:eos);Tg(ngn1:egfp) embryo that was exposed to UV light to photoconvert Eos in the whole embryo. These frames show the pioneer axon (green) and associated glia (red) migrate together to the DREZ. Below are individual channels for GFP and Eos. Arrows denote the pioneer axon growth cone and arrowheads denote location of the DRG glia. Scale bar, 25 μm. |
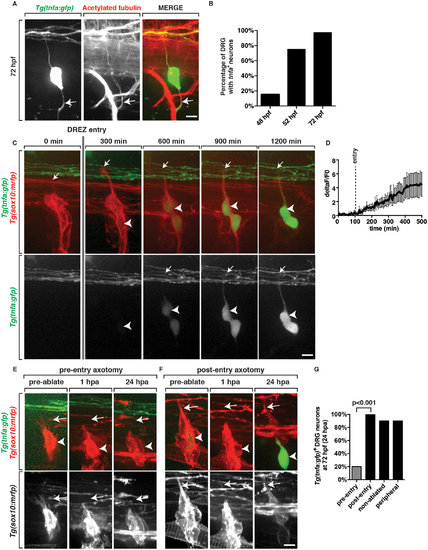
DRG neurons upregulate TNFa after pioneer axons enter the spinal cord. (A) At 72 hpf, Tg(tnfa:gfp) zebrafish embryos show robust expression of GFP in DRG neurons after the pioneer axon has entered the spinal cord. Arrow demarcates the peripheral projection labeled with acetylated tubulin. (B) Quantification of tnfa+ DRG neurons at 48, 52 and 72 hpf (n = 30 DRG nerves). (C) Excerpt from a 24 hour time-lapse movie starting at 48 hpf in a Tg(tnfa:gfp);Tg(sox10:mrfp) embryo shows GFP expression in DRG neurons increasing as the pioneer axon (arrow), identified by RFP, enters the spinal cord. Arrowhead denotes DRG neuron cell soma. (D) Intensity profile of GFP in movie shown in panel C (n = 7 DRG). (E) Live images of a 48 hpf Tg(tnfa:gfp);Tg(sox10:mrfp) embryo showing a pioneer axon (arrow) just as it has formed pre-axotomy, 1 hpa and 24 hpa. In these images, axotomy prevents pioneer axons from entering the spinal cord and GFP expression is never observed. Arrowhead denotes DRG neuron cell soma. (F) Live images of a 48 hpf Tg(tnfa:gfp);Tg(sox10:mrfp) embryo where the pioneer axon (arrow) had already entered the spinal cord. In this instance, axotomy did not affect GFP expression. (G) Quantification of GFP expression in DRG neurons from panels E and F (n = 5 nerves). Scale bars, 25 μm. |
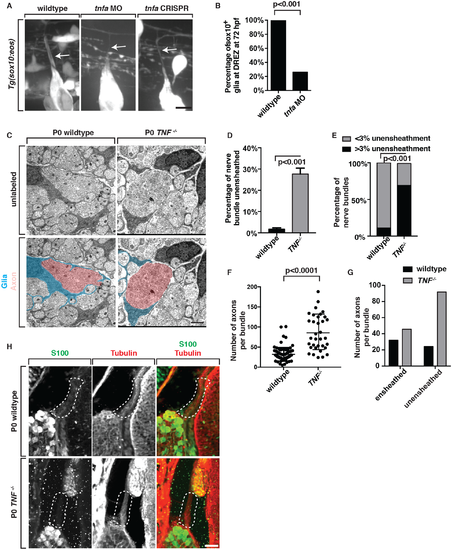
TNFa is required for axonal ensheathment by DREZ glia. (A) Images of wildtype, tnfa morphant and tnfa F0 CRISPR mutant Tg(sox10:eos) larvae at 72 hpf. Arrow denotes central branch that is ensheathed by sox10+ glia in wildtype but not tnfa morphants or tnfa F0 CRISPR mutants. (B) Quantification of data from panel A, wt n = 40 DRG, tnfa MO n = 54 DRG. (C) Electron microscopy images of DRG tissue from wildtype and TNF-/- P0 pups showed a reduction in the ensheathment of axonal bundles. (n = 3 animals/genotype). (D,E) Quantification of ensheathed vs unensheathed bundles in wildtype and TNF-/- pups (3 animals, wt n = 108 nerve bundles, TNFR2-/- n = 85 nerve bundles). (F,G) Quantification of the number of axons per small-caliber bundle in wildtype and TNF-/- pups. (H) Images of spinal column tissue from wildtype and TNF-/- P0 embryo labeled with antibodies to S100 (green) and βIII Tubulin (red). Traced area denotes central projection that extends into the spinal cord. In TNF-/- pups, the central afferent lacks S100 staining. Fisher’s exact test (B,E,G). Students t-test (D,F). Scale bars, 25 μm (A,H), 5 μm (C). EXPRESSION / LABELING:
PHENOTYPE:
|
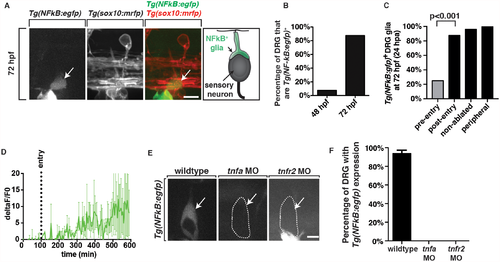
TNFa/TNFR2-mediated signaling is active in pioneer axon-associated glia. (A) Images and schematic of Tg(NFkB:egfp);Tg(sox10:mrfp) embryos at 72 hpf showing GFP+ glia at the DREZ. (B) Quantification of the percentage of DRG with Tg(NFkB:egfp) expression at 48 and 72 hpf, n = 30 DRG. (C) Quantification of NFkB+ DREZ glia along pioneer axons that were axotomized before entry (pre-entry), after entry (post-entry), non-ablated and peripheral axotomy (n = 8 nerves/condition). (D) Intensity profiles of GFP in Tg(NFkB:egfp);Tg(sox10:mrfp) embryos from 48 to 72 hpf showing GFP upregulation upon axon entry into the spinal cord. Shown is the average of 2 movies normalized for the time of entry. (E) Images of Tg(NFkB:egfp) embryos in wildtype, tnfa morphant and tnfr2 morphant larvae showing NFkB activation is dependent on tnfa and tnfr2. (F) Quantification of data from panel D, SEM is shown, wt n = 30 DRG, tnfa MO n = 30 DRG, tnfr2 MO n = 30 DRG. Scale bars, 25 μm. EXPRESSION / LABELING:
PHENOTYPE:
|

TNFR2 is required for glial ensheathment of DRG axons at the DREZ. (A) Images of Tg(sox10:eos) wildtype, tnfr2 morphant and tnfr2 F0 CRISPR mutant larvae at 72 hpf showing a central branch that is ensheathed by sox10+ glia (arrow) in wildtype but not tnfr2 morphants or tnfr2 F0 CRISPR mutants (arrow). (B) Quantification of data from panel A (wt n = 40 DRG, tnfr2 MO n = 31 DRG, tnfr1 = 24 DRG). (C) Images of spinal column tissue from wildtype and TNFR2-/- P0 mouse embryos labeled with antibodies to S100 (green) and βIII Tubulin (red). Traced area denotes central projection that extends into the spinal cord. (D) Electron microscopy images of DRG tissue from wildtype and TNFR2-/- pups showed a reduction in the ensheathment of axonal bundles. (E,F) Quantification of ensheathed vs unensheathed bundles in wildtype and TNFR2-/- pups (3 animals, wt n = 108 nerve bundles, TNFR2-/- n = 68 nerve bundles). (G,H) Quantification of the number of axons per small-caliber bundle in wildtype and TNFR2-/- pups. (I) Images from a 24-hour time-lapse movie of a Tg(sox10:eos) embryo injected with tnfr2 MO. Fisher’s exact test (B,F,H). Students t-test (E,F). Scale bars, 25 μm (A,C,I), 5 μm (D). EXPRESSION / LABELING:
PHENOTYPE:
|

NFa/TNFR2 signaling components are expressed in the DRG. (A&B) Confocal images of FISH probes specific to tnfa and tnfr2 in Tg(ngn1:gfp) larvae at 72 hpf showing tnfa is expressed in DRG neurons while tnfr2 is expressed in the DRG consistent with glial expression. Scale bar, 25 μm. |
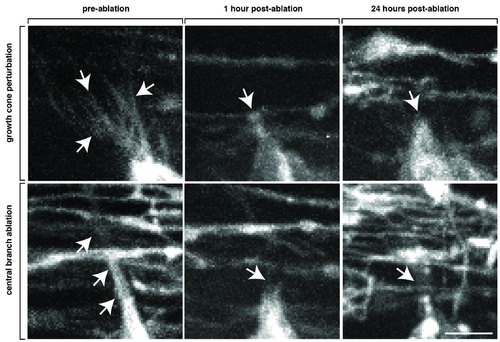
Axotomy of navigating pioneer axon growth cones. Zoomed images of axotomized Tg(sox10:mrfp) growth cones showing pre-axotomy, 1 hour after axotomy and 24 hours after axotomy. The filopodia-like projections that are typical of a growth cone are absent after axotomy. Note the lack of debris from RFP+ glia. Arrows denote growth cone filopodia extensions that are missing after axotomy. Scale bar, 25 μm. |
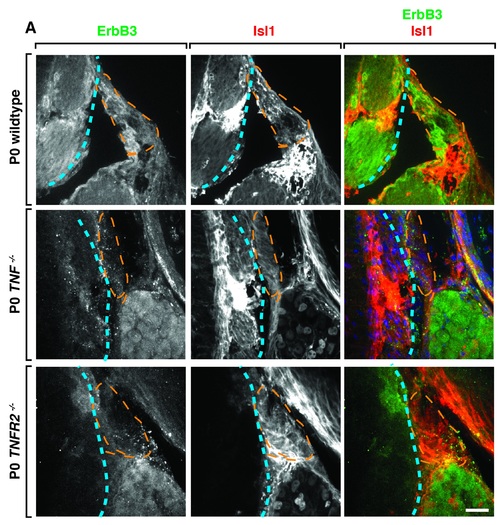
TNFa-/- and TNFR2-/- mice have glial defects at the DREZ. (A). Confocal images of wildtype, TNFa-/- and TNFR2-/- mouse L3-L6 spinal cord tissue at P0 stained with glial marker ErbB3 and Isl1 showing that glial staining is reduced or absent along the afferent nerve (denoted by orange dotted line). The edge of the spinal cord is labeled with blue dotted line. Scale bar, 30 μm. |
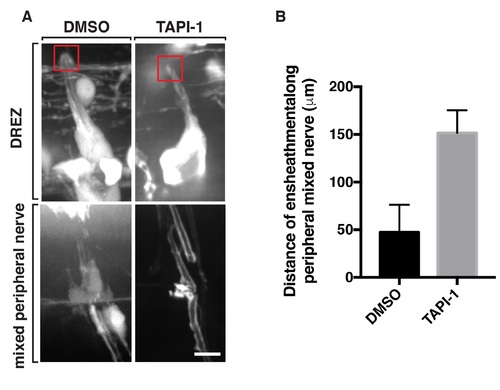
TNFa cleavage is not required for glial ensheathment of DRG pioneer axons. Images of DMSO and TAPI-1 treated Tg(sox10:eos) larvae at 72 hpf. In drug-treated larvae, there is no perturbation to sox10+ glial ensheathment of central DRG projections. (B) Quantification of glial ensheathment along the peripheral motor nerve showing increased ensheathment in TAPI-1 compared to DMSO. DMSO n = 6 nerves, TAPI n = 12 nerves. Red box denotes the DREZ. Scale bar, 25 μm. |
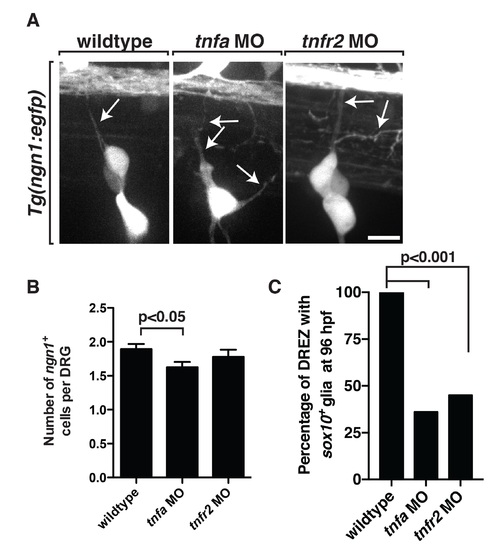
Knockdown of tnfa and tnfr2 causes neural defects. (A) In Tg(ngn1:egfp) embryos injected with either tnfa or tnfr2 MOs, we observed ectopic axons that did not navigate to the DREZ. (B) Quantification of the number of ngn1+ cells per DRG at 72 hpf in wildtype, tnfa and tnfr2 morphants. (C) Quantification of sox10+ glia at 96 hpf in wildtype (n = 60 DRG). The tnfa (n = 61 DRG) and tnfr2 morphant (n = 44 DRG) larvae showing the glial ensheathment defect persists to 96 hpf. Scale bar, 25 μm. |