
- Title
-
Dissection of zebrafish shha function using site-specific targeting with a Cre-dependent genetic switch.
- Authors
- Sugimoto, K., Hui, S.P., Sheng, D.Z., Kikuchi, K.
- Source
- Full text @ Elife

Characterization of the shhact allele. (A) Schematic of Cre-dependent conversion of Zwitch from the non-mutagenic orientation to the mutagenic orientation. Cre activation induces an inversion between loxP or lox5171 sites and the subsequent excision of loxP or lox5171-flanking DNA sequences (Schnütgen and Ghyselinck, 2007), thereby permanently converting Zwitch into the mutagenic form and inducing aberrant shha splicing. (B) PCR analysis of the Zwitch inversion. Genomic DNA from 72 hpf Cre+ and Cre− shhact/+ embryos was analyzed using PCR. (C) RT-PCR analysis of shha expression in 72 hpf Cre+ and Cre− shhact/+ embryos. (D) Schematic of Flp-mediated excision of the FRT-flanked LG tag in the shhact allele. (E) Genomic PCR analysis of Flp-injected (+) or uninjected (−) embryos from a cross of shhact/+ adults. PCR using F3 and R1 primers detected shhact alleles in both samples. Flp mRNA was synthesized from linearized pCS2-FLPo (Materials and methods). (F) Representative image of embryos injected with Flp mRNA. Arrows indicate the lens. (G) Quantification of phenotypes of the embryos analyzed in F. A total of 87 Flp-injected (+) and 99 uninjected embryos (−) were analyzed (****p<1.0 × 10⁻⁸ Fisher’s exact test). dpf, days post-fertilization. EXPRESSION / LABELING:
|
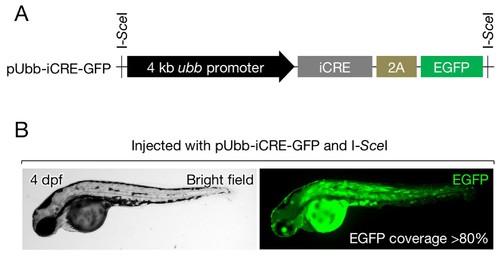
Cre expression vector. (A) Schematic of pUbb-iCRE-GFP. (B) A representative image of embryos injected with pUbb-iCRE-GFP expressing EGFP (right) on approximately 80% of the body surface (left). Embryos expressing EGFP at similar or greater levels were selected for the analysis presented in Figure 3A–C. |

ZFIN is incorporating published figure images and captions as part of an ongoing project. Figures from some publications have not yet been curated, or are not available for display because of copyright restrictions. |
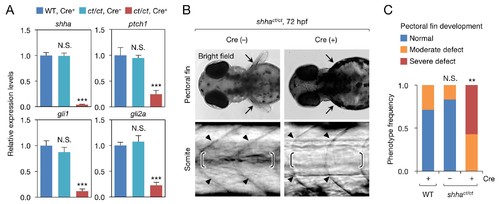
Phenotype of shhact/ct embryos globally expressing Cre. (A) qRT-PCR analysis of 72 hpf Cre+ and Cre− shhact/ct embryos (n = 10 and 9). WT embryos injected with pUbb-iCRE-GFP DNA were used as a control (n = 9). Ten pooled embryos per sample were used for qRT-PCR analysis. The data are presented as the mean ± SEM (***p<0.001, Mann–Whitney U test). (B) Phenotypes of 72 hpf Cre+ and Cre- shhact/ct embryos. Arrows, pectoral fins; arrowheads, somite boundaries; brackets, horizontal myoseptum. Bright field images were captured using an MVX10 microscope. The composite images shown were generated using ImageJ software. Somite defects were observed in all embryos with severe pectoral fin defects. (C) Quantification of pectoral fin phenotypes from the embryos in B (n = 7 [WT, Cre+], n = 12 [shhact/ct, Cre−], and n = 28 [shhact/ct, Cre+]; **p<0.01, Fisher’s exact test). N.S., not significant (p=0.5392). The embryos used in A–C were selected on the basis of their high-level expression of Cre as described in Figure 2—figure supplement 1B (see also Cre DNA and mRNA injection, Materials and methods). A moderate pectoral fin defect was observed in control samples, likely due to injection artifacts. |
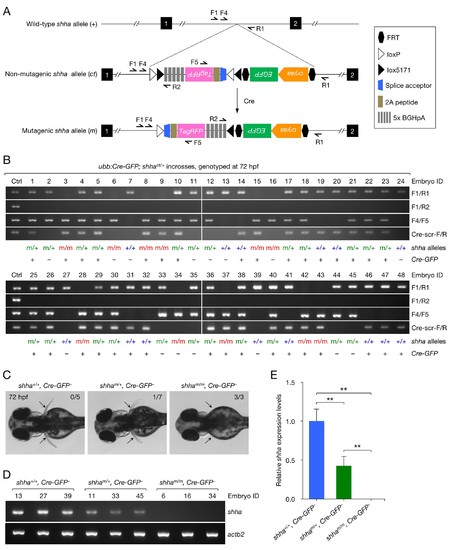
Analysis of embryos carrying mutagenic shha alleles. (A) Schematic of the shha WT allele (+), non-mutagenic, conditional-trap allele (ct), and inverted mutagenic allele (m), and primers sites. (B) Genotyping PCR result of single embryos from incrosses of ubb:Cre-GFP; shhact/+ fish. (C) Pectoral fin phenotype of WT and heterozygous and homozygous mutagenic embryos in B. Embryos that did not carry ubb:Cre-GFP transgene were analyzed (Cre-GFP−). Pectoral fin development was normal in all WT embryos (0 abnormal in 5 analyzed) and most heterozygous mutants (1 moderately abnormal in 7 analyzed; p=0.3774, Fisher's exact test), but severely hampered in all homozygous mutants (3 abnormal in 3 analyzed; p<0.01, Fisher’s exact test). (D) Semi-qRT-PCR analysis of shha expression in WT and heterozygous and homozygous mutagenic embryos. The number above each lane in the gel picture indicates the Embryo ID in B. (E) Densitometric quantification of the PCR result in D. The data represent the mean ± SD (**p<0.01; Mann–Whitney U test). EXPRESSION / LABELING:
PHENOTYPE:
|
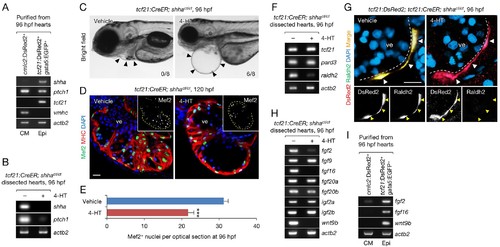
Epicardium-specific inactivation of shha expression during heart development. (A) Semi-qRT-PCR analysis of purified cardiomyocytes (CM) and epicardial cells (Epi) from 96 hpf hearts (see also Flow Cytometry, Materials and methods). Cardiomyocyte (vmhc) and epicardial (tcf21) markers were used to confirm the specificity of cell sorting. (B) Semi-qRT-PCR analysis of shha and ptch1 expression in hearts dissected from tcf21:CreER; shhact/ct embryos treated with the vehicle (−) or 4-HT (+). (C) Phenotype of tcf21:CreER; shhact/ct embryos treated with the vehicle or 4-HT. Severe cardiac edema was observed in 4-HT–treated embryos at 96 hpf (six abnormal in eight analyzed; right, arrowheads) but not in vehicle-treated embryos (zero abnormal in eight analyzed; left, arrowheads; n = 8 each; p<0.01, Fisher’s exact test). (D) Immunofluorescence of heart sections obtained from vehicle- or 4-HT–treated tcf21:CreER; shhact/ct embryos. Insets, single-channel images of Mef2 immunofluorescence. Dotted yellow lines in insets depict the outline of the ventricle. (E) Quantification of Mef2+ nuclei from the sections obtained from the vehicle- or 4-HT–treated tcf21:CreER; shhact/ct embryos in D (n = 13 and 12). The data are presented as the mean ± SEM (***p<0.001, Mann–Whitney U test). (F) Semi-qRT-PCR analysis of epicardial marker gene expression in hearts dissected from tcf21:CreER; shhact/ct embryos treated with the vehicle (−) or 4-HT (+). (G) Immunofluorescence staining of heart sections obtained from vehicle- or 4-HT–treated tcf21:CreER; shhact/ct embryos. Raldh2 immunofluorescence was detected in tcf21:DsRed2+ epicardial cells in vehicle-treated embryos (left, arrowheads) but not in 4-HT-treated embryos (right, arrowheads). Bottom panels, single-channel images of Raldh2 immunofluorescence. (H) Semi-qRT-PCR analysis of the expression of myocardial growth factor genes in hearts dissected from tcf21:CreER; shhact/ct embryos treated with the vehicle (−) or 4-HT (+). (I) Semi-qRT-PCR analysis of shha-dependent myocardial growth factor genes in purified cardiomyocytes (CM) and epicardial cells (Epi) obtained from 96 hpf hearts. Single confocal sections are shown in D and G. ve, ventricle. Scale bar, 10 μm. |
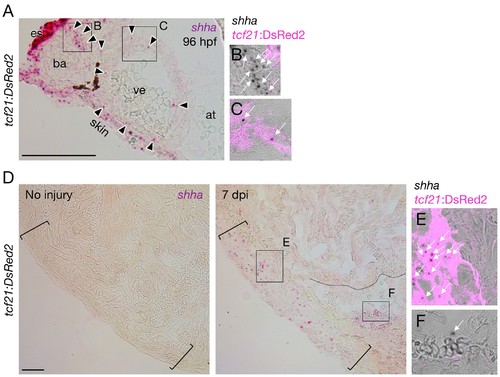
shha expression during heart development and regeneration. (A–C) shha expression during heart development in zebrafish. Single confocal slice images of the rectangles in A are shown in B and C. (D–F) shha expression during heart regeneration in zebrafish. Single confocal slice images of the rectangles in the right panel of D are shown in E and F. at, atrium; ba, bulbus arteriosus; es, esophagus; ve, ventricle. Scale bar, 50 μm. |
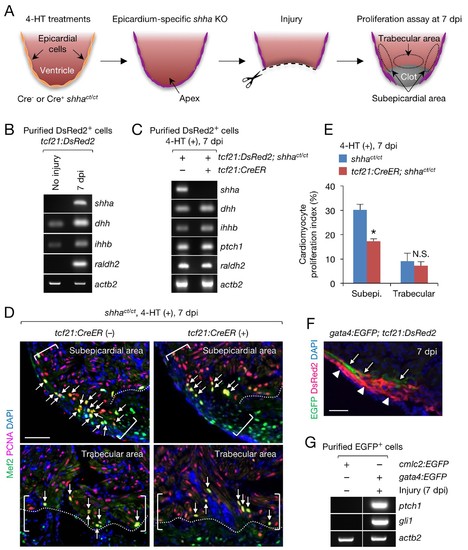
Epicardial shha expression promotes subepicardial cardiomyocyte proliferation during heart regeneration. (A) Schematic of the experiment. (B) Semi-qRT-PCR analysis of shha in purified tcf21:DsRed2+ epicardial cells obtained from uninjured and injured (7 dpi) tcf21:DsRed hearts. Injury was confirmed by the induction of raldh2 expression. (C) Semi-qRT-PCR analysis of Hh pathway genes using purified tcf21:DsRed2+ epicardial cells obtained from 4-HT–treated 7 dpi tcf21:DsRed; shhact/ct (control, left) and tcf21:DsRed; tcf21:CreER; shhact/ct hearts (right). (D) Immunofluorescence images of the subepicardial (top) and trabecular areas (bottom) of heart sections obtained from 4-HT–treated 7 dpi shhact/ct (control) or tcf21:CreER; shhact/ct hearts. Brackets, subepicardial areas. Dotted lines, approximate amputation plane. Arrows indicate proliferating cardiomyocytes. (E) Quantification of cardiomyocyte proliferation in the subepicardial and trabecular areas of the heart sections obtained from 4-HT–treated 7 dpi shhact/ct (control) or tcf21:CreER; shhact/ct hearts shown in D (n = 6 each). The data are presented as the mean ± SEM (**p<0.01, Mann–Whitney U test). N.S., not significant (p=0.3367). (F) Image of heart sections obtained from 7 dpi gata4:EGFP; tcf21;DsRed2 fish. Subepicardial cardiomyocytes (green, arrows) associate with epicardial cells (magenta, arrowheads). (G) Semi-qRT-PCR analysis of shha pathway genes using purified subepicardial cardiomyocytes obtained from 7 dpi gata4:EGFP ventricles. Cardiomyocytes purified from uninjured cmlc2:EGFP ventricles were used as negative controls. Scale bar, 50 μm. |
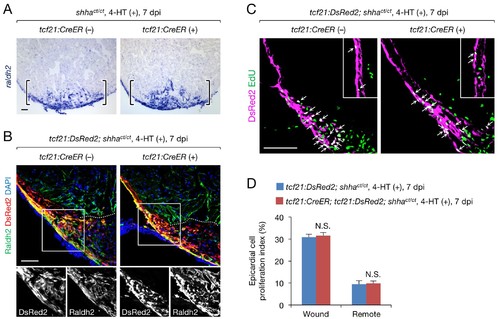
A redundant role for epicardial shha in epicardial migration and proliferation during heart regeneration. (A) In situ hybridization analysis of raldh2 expression in sections obtained from 4-HT-treated 7 dpi shhact/ct (control) and tcf21:CreER; shhact/ct hearts. Brackets, injury site. (B) Immunofluorescence staining of Raldh2 and DsRed2 using sections obtained from 4-HT-treated 7 dpi tcf21:DsRed; shhact/ct (control) and tcf21:DsRed; tcf21:CreER; shhact/ct hearts (right). Single-channel images of the rectangle are shown at the bottom. Dotted line, approximate amputation plane. (C) Immunofluorescence staining of DsRed2 and EdU in sections obtained from 4-HT-treated 7 dpi tcf21:DsRed; shhact/ct (control) and tcf21:CreER; tcf21:DsRed; shhact/ct hearts. Inset, non-injured area. Arrows indicate proliferating tcf21+ epicardial cells, which were defined as epicardial cells colabeled DsRed2 and EdU. (D) Quantification of epicardial cell proliferation in the sections obtained from 4-HT-treated 7 dpi tcf21:DsRed; shhact/ct (control) and tcf21:CreER; tcf21:DsRed; shhact/ct hearts shown in C (n = 5 each). The data represent the mean ± SEM (wound, p=0.754; remote, p=0.602; Mann–Whitney U test). N.S., not significant. Single confocal slice images are shown in B and C. Scale bar, 50 μm. |