
- Title
-
Gain-of-function mutations of mau/DrAqp3a influence zebrafish pigment pattern formation through the tissue environment
- Authors
- Eskova, A., Chauvigné, F., Maischein, H.M., Ammelburg, M., Cerdà, J., Nüsslein-Volhard, C., Irion, U.
- Source
- Full text @ Development
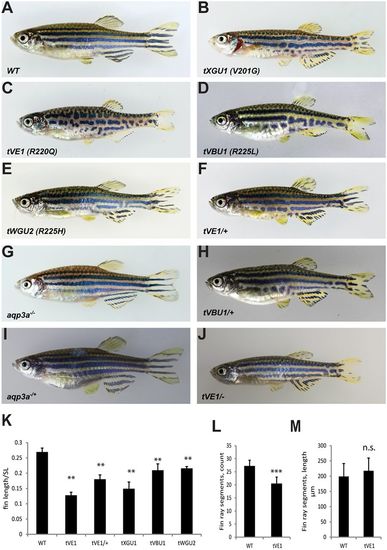
Mutations in aqp3a lead to undulating, broken stripes and short fins. (A-E) Comparison of wild type with mau mutants carrying the dominant alleles tVE1, tXGU1, tVBU1 and tWGU2. (F,H) The dominant mau phenotype is attenuated in heterozygous fish. (G,I) The loss-of-function mutant aqp3a−/−, generated in the background of aqp3atVE1/tVE1, has a wild-type phenotype in homozygous and heterozygous fish. (J) The aqp3atVE1/− phenotype is similar to that of aqp3atVE1/+. (K) Ratio of caudal fin length to standard body length (SL) in mau mutants. For each allele, seven to nine fish were measured. Mean±s.d. **P<0.01 for mutant versus wild type (one-way ANOVA followed by Tukey-Kramer multiple comparisons test). (L) Number of fin ray segments in the third ray of the caudal fin in wild-type and aqp3atVE1/tVE1 fish. n=8. Mean±s.d. ***P<0.0001 (unpaired t-test). (M) Length of fin ray segments in the third ray of the caudal fin in wild-type and aqp3atVE1/tVE1 fish. n=8. Mean±s.d. n.s., not significant (unpaired t-test). PHENOTYPE:
|

ZFIN is incorporating published figure images and captions as part of an ongoing project. Figures from some publications have not yet been curated, or are not available for display because of copyright restrictions. |
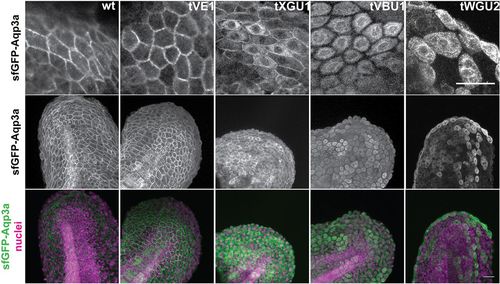
GFP-Aqp3a localization in zebrafish fin fold cells. mRNA of GFP-Aq3a was microinjected at the 1-cell stage and the protein localization was imaged at 1dpf. Wild-type and Aqp3aR220Q (tVE1) proteins reach the plasma membrane, whereas Aqp3aR225L (tVBU1) and Aqp3aR225H (tWGU2) mutants are retained intracellularly. Aqp3aV201G (tXGU1) shows partial retention. Nuclei are stained with Hoechst 33342. Scale bars: 25 µm. |
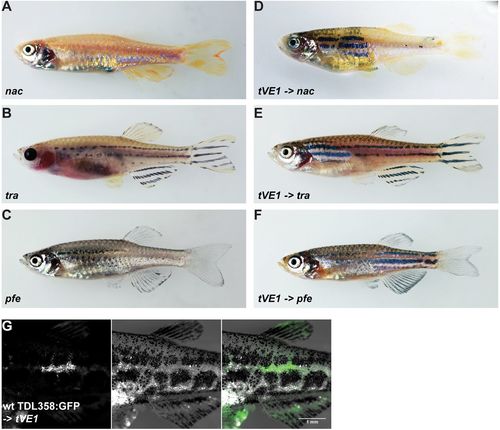
Dominant mutations of aqp3a do not act cell-autonomously in pigment cells. (A-C) Blastomere transplantations of aqp3atVE1/tVE1 into mutants lacking one chromatophore type (nacre, transparent or pfeffer). (D-F) Typical chimeric animals resulting from transplantations show the striped wild-type pattern in the regions where mau pigment cells complement the host residual pattern. (G) Wild-type iridophores Tg(TDL358:GFP) do not form a wild-type pattern when transplanted into aqp3atVE1/tVE1. Left: GFP-labeled iridophores; middle: corresponding bright-field image; right: merged image. PHENOTYPE:
|
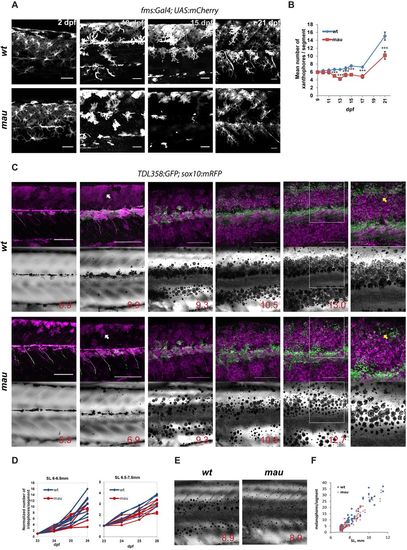
Development of the mau phenotype in aqp3atVE1/tVE1. (A) Xanthophores labelled by Tg(fms:GAL4; UAS:mCherry) in wild-type and in aqp3atVE1/tVE1 (mau) larvae. By 15 dpf, the numbers and the area covered by xanthophores are reduced in the mutants, but xanthophores later recover. (B) Numbers of xanthophores per segment in the mid-trunk of pre-metamorphic fish (n=8-10 fish); data points represent mean±s.e.m. ***P<0.0001, unpaired t-test. (C) Representative example of recurrent imaging of individual fish carrying Tg(TDL358:GFP) (green, labelling iridophores) and Tg(sox10:mRFP) (magenta, labelling all the pigment cells) in wild type and in mau. Standard length (SL) is indicated. White arrows point to contracted xanthophores [labelled in mau, Tg(sox10:mRFP)], whereas the wild-type xanthophores are spread and cover the entire flank of the fish. Yellow arrows indicate the position of the second light stripe. In mau, iridophores are present in the area but fail to form a continuous light stripe. (D) Increase in iridophore numbers per segment over the course of 4 days. The quantifications were obtained from recurrent imaging in the mid-trunk segments of the fish during the initial formation of the light stripe (SL 6-6.5 mm), and upon completion of the first light stripe (SL 6.5-7.5 mm). (E) mau melanophores are scattered and not confined to the dark stripe region. (F) Numbers of flank melanophores per segment in the mid-trunk (two segments above the anus) imaged in metamorphic wild-type and mau fish. Each data point represents the number of melanophores in one segment. Scale bars: 50 µm in A; 250 µm in C. EXPRESSION / LABELING:
PHENOTYPE:
|
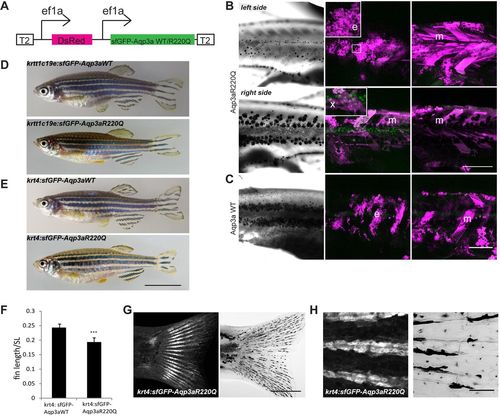
Misexpression of wild-type (WT) and R220Q (tVE1) Aqp3a. (A) Construct used for the analysis of mosaic expression. Ubiquitous ef1a promoters drive the simultaneous expression of dsRed and sfGFP-Aqp3aR220Q. The construct is flanked by Tol2 repeats (T2) for integration in the genome. (B) Mosaic expression of the ef1a:DsRed, ef1a:sfGFP-Aqp3aR220Q on two sides of the same fish. The middle panel shows maximum intensity projections of clones in the epidermis (35-40 µm) (e) and xanthophore clones in the hypodermis (x). The right panel shows maximum intensity projections of muscle clones (m) (40-100 µm). The loss of iridophores and scattering of melanophores occur on the left side, where the large epidermal clone coincides with a large muscle clone. A large muscle clone alone or clones in xanthophores do not produce any effect on pigment cell organization on the right-hand side of the fish. (C) Expression of wild-type Aqp3a does not affect pigment patterning. (D,E) Transgenic fish expressing sfGFP-Aqp3a WT or R220Q under the basal epidermis-specific promoter krtt1c19e (D) and under the krt4 promoter (E). (F) Ratio of caudal fin length to standard body length (SL) in Tg(krt4:sfGFP-Aqp3a WT) and Tg(krt4:sfGFP-Aqp3aR220Q) fish. For each line, five to seven fish were measured. Mean±s.d. ***P<0.001, unpaired t-test. (G) Tg(krt4:sfGFP-Aqp3aR220Q) is expressed in fins of metamorphic fish. (H) The expression of krt4:sfGFP-Aqp3aR220Q is prominent in the cells of fin rays. Scale bars: 1 cm in E; 500 µm in B,C,G; 50 µm in H. |