
- Title
-
Lineage tracing of dlx1a/2a and dlx5a/6a expressing cells in the developing zebrafish brain
- Authors
- Solek, C.M., Feng, S., Perin, S., Weinschutz Mendes, H.C., Ekker, M.
- Source
- Full text @ Dev. Biol.
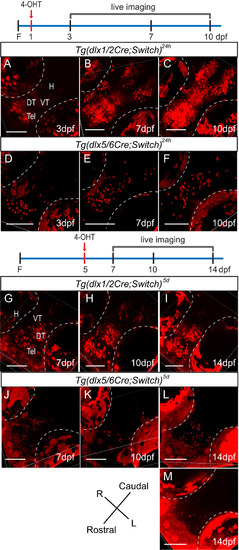
Lineage tracing of dlx1a/2a and dlx5a/6a expressing cells by live confocal imaging of double transgenic fish induced with 4-OHT. The diagrams illustrate induction with 4-OHT (red arrow) along the timeline and the days on which the fish were imaged as shown below. (A-C) Tg(dlx1/2Cre;Switch)24h embryos imaged at 3 dpf (A, n=11), 7 dpf (B, n=14) and 10 dpf (C, n=12). (D-F) Tg(dlx5/6Cre;Switch)24h embryos imaged at 3 dpf (D, n=13), 7 dpf (E, n=19) and 10 dpf (F, n=9). (G-I) Tg(dlx1/2Cre;Switch)5d embryos imaged at 7 dpf (G, n=8), 10 dpf (H, n=7) and 14 dpf (I, n=6). (J-M) Tg(dlx5/6Cre;Switch)5d embryos imaged at 7 dpf (J, n=9), 10 dpf (K, n=7), 14 dpf (L, M, n=6). Inductions were performed in at least three biological replicates. Auto-fluorescence of the pigment cells in the eyes is outlined in white dotted lines. All fish are oriented with the rostral end at the bottom left. Scale bar: 100 µm. |
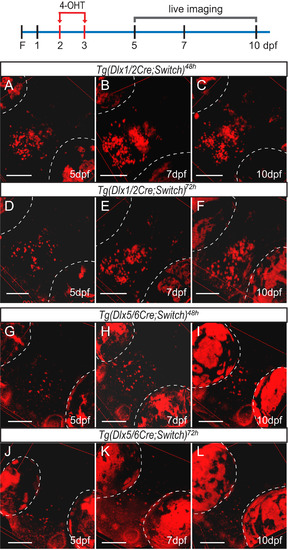
Lineage tracing of dlx1a/2a and dlx5a/6a expressing cells by live confocal imaging of double transgenic fish induced with 4-OHT at 48 hpf and 72 hpf. The diagram illustrates induction with 4-OHT (red arrows) at 2 dpf and 3 dpf and the days on which the fish were imaged as shown below. (A-C) Tg(dlx1/2Cre;Switch)48h embryos imaged at 5 dpf (A, n=11), 7 dpf (B, n=7) and 10 dpf (C, n=7). (D-F) Tg(dlx1/2Cre;Switch)72h embryos imaged at 5 dpf (D, n=5), 7 dpf (E, n=13) and 10 dpf (F, n=10). (G-I) Tg(dlx5/6Cre;Switch)48h embryos imaged at 5 dpf (G, n=12), 7 dpf (H, n=10) and 10 dpf (I, n=12). (J-L) Tg(dlx5/6Cre;Switch)72h embryos imaged at 5 dpf (J, n=19), 7 dpf (K, n=18) and 10 dpf (L, n=15). The auto-fluorescence of the pigment cells in the eyes is outlined in white dotted lines. All fish are oriented with the rostral end at the bottom left as in Fig. 2. Scale bar: 100 µm. |
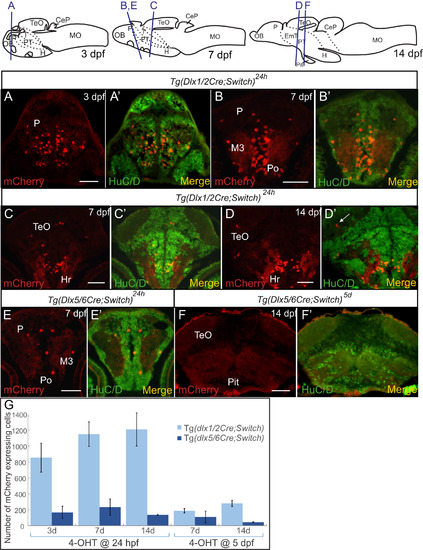
Colocalization of mCherry cells with the HuC/D neuronal marker in embryos and larvae. (A-F) Double immunohistochemical labeling of cryosections of embryos and larvae. Examples of staining of 3 dpf embryos (A), 7 dpf larvae (B, C, E) and 14 dpf larvae (D, F) are shown with relevant brain regions indicated. Each panel has mCherry staining alone (red, left) and merged image with HuC/D staining (green, right). A cell that expresses mCherry but not HuC/D in the neuropil is indicated by a white arrow in (D'). The location of each section is depicted in the cartoons at the top. (G) Number of mCherry expressing cells detected by immunohistochemistry in cryosections of zebrafish larvae from Tg(dlx1/2Cre;Switch) (light blue) and Tg(dlx5/6Cre;Switch) (dark blue) induced with 4-OHT at 24 hpf (left) and 5 dpf (right) in 3 dpf, 7 dpf and 14 dpf larvae. See Table S1 for sample sizes. Error bars: SEM. Scale bar: 100 µm. |
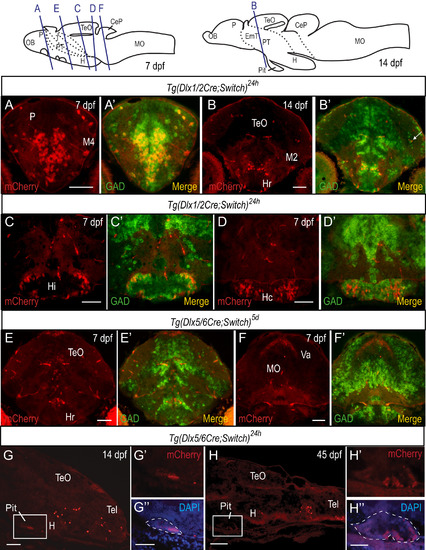
Colocalization of mCherry cells with gad65/67a transcripts in embryos and larvae. (A-F) In situ hybridization (ISH) using gad65 and gad67a probes coupled with immunohistochemistry (IHC) with antibodies against mCherry on cryosections of embryos and larvae. Examples of staining from 7 dpf (A, C-F) and 14 dpf (B) larvae are shown with relevant brain regions indicated. A cell that expresses mCherry but not gad65/67a in the neuropil is indicated by a white arrow in (B’). (G-H) Detection of mCherry protein in sagittal cryosections of Tg(dlx5/6Cre;Switch)24h by immunohistochemistry at 14 dpf (G) and at 45 dpf (juvenile stage, H). Staining is observed in the anterior part of the pituitary, seen best in the higher magnification images (G', G'' and H', H''). DAPI staining (blue) is overlaid with mCherry immunostaining (red) in G” and H”. The pituitary is outlined in white dashed lines. See Table S1 for sample sizes. Scale bars: A-F: 100 µm; G-H: 50 µm; G”, H”: 100 µm. |
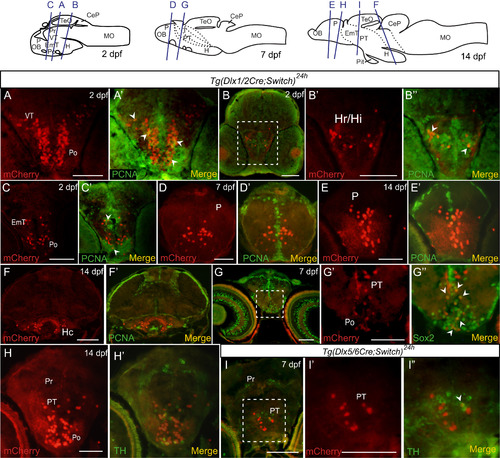
Colocalization of mCherry cells with PCNA, Sox2 and TH in embryos and larvae. (A-I) Double immunohistochemical labeling of cryosections of embryos and larvae. Examples of staining from Tg(dlx1/2Cre;Switch)24h 2 dpf (A-C), 7 dpf (D, G) and 14 dpf (E, F, H) and from Tg(dlx5/6Cre;Switch)24h 7 dpf (I) larvae are shown with relevant brain regions indicated. Each panel has mCherry staining alone (red, left) and merged image with PCNA (A-F), Sox2 (G) and TH (H, I) staining (green, right). The location of each section is depicted in the cartoons at the top. Enlarged versions of the white dotted outlined regions in B, G and I are shown in B'-B'', G'-G'' and I'-I''. Cells that express mCherry and PCNA are indicated with white arrowheads in A', B'', and C', Cells that express mCherry and Sox2 are indicated by white arrowheads in G”. A single cell that expresses mCherry and TH is indicated by a white arrowhead in I''. Scale bar: 100 µm. |
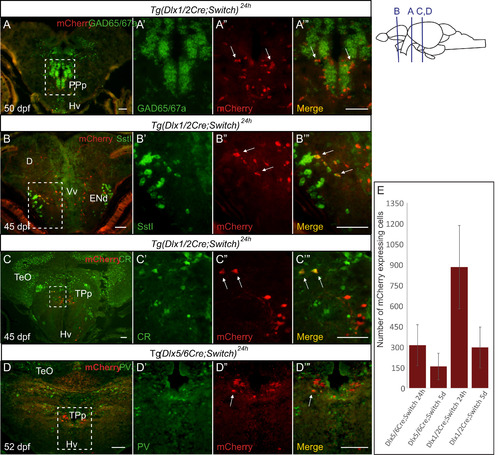
Colocalization of mCherry cells with GABAergic markers in the juvenile brain. (A-B) ISH for gad65 and gad67a (green, A) or sstI (green, B) coupled with IHC against mCherry (red) on cryosections of juvenile zebrafish brains. (C-D) Double immunohistochemical labeling of juvenile brains for mCherry (red) and calretinin (green, C) or parvalbumin (green, D). Examples of cells that express both mCherry and the GABAergic marker (yellow) are indicated by white arrows in the insets in A''-D'' and A'''-D'''. (E) Number of mCherry-expressing cells detected by IHC in cryosections of larvae from Tg(dlx1/2Cre;Switch) and Tg(dlx5/6Cre;Switch) induced with 4-OHT at 24 hpf (left) and 5 dpf (right) in juvenile animals (45–60 dpf). n=2–4 samples per condition per time point. Error bars: SEM. See Table S2 for sample sizes. Scale bar: 20 µm. |
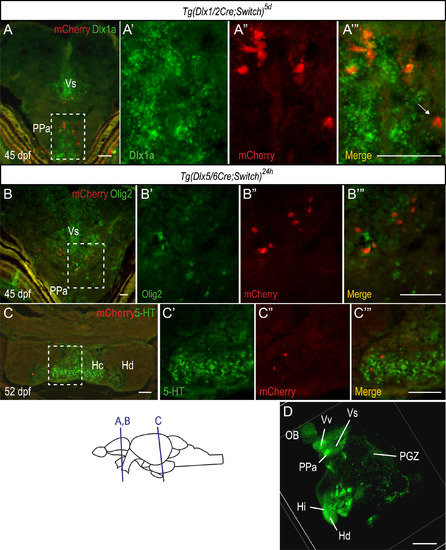
Colocalization of mCherry cells with non-GABAergic markers in the juvenile brain. (A-B) ISH for dlx1a (green, A) or olig2 (green, B) coupled with IHC for mCherry (red) on cryosections of juvenile brains. (C) Double immunohistochemical labeling of cryosections of juvenile brains for mCherry (red) and 5-HT (green, C). A cell that expresses mCherry located a short distance from the ventricular zone and doesn’t express dlx1a is indicated by a white arrow in A'''. See Table S2 for sample sizes. (D) GFP IHC in adult Tg(1.4kbdlx5a-dlx6a:GFP) zebrafish brain imaged by OPT. A number of GFP expressing cells can be observed in the olfactory bulb, peri-ventricular areas of the telencephalon, hypothalamus and PGZ. Scale bar: A-C: 20 µm; D: 0.5 mm. |
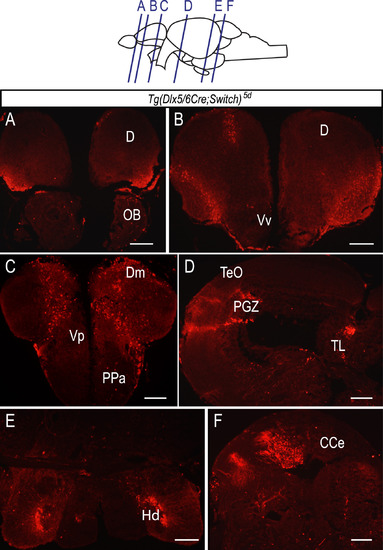
Massive expansion of mCherry labeled cell population in the Tg(dlx5/6Cre;Switch)5d adult brain. (A-F) Immunohistochemical labeling of cryosections of an adult (>6 months post-fertilization) brain from Tg(dlx5/6;Switch)5d sample with an antibody against mCherry protein. Clusters of mCherry expressing cells are abundant in many areas of the brain including telencephalon (A-C), mesencephalon (D), diencephalon (E) and rhombencephalon (F). n=7, in 4 biological replicates. Scale bar: 50 µm. |
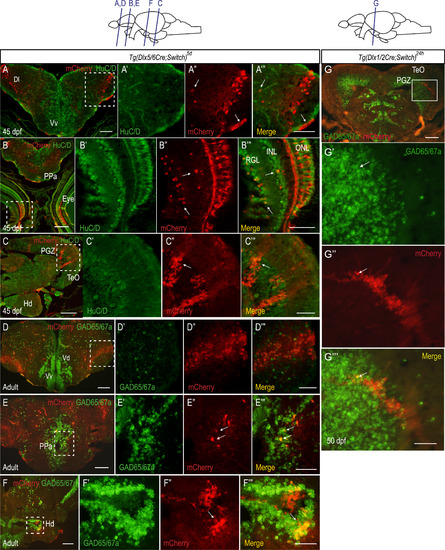
Most of the supernumerary mCherry expressing cells in juvenile and adult Tg(dlx5/6Cre;Switch)5d brains do not express gad65/67a. (A-C) Double IHC of juvenile (45 dpf) brains for mCherry (red) and HuC/D (green). n=3 in two biological replicates. Examples of cells expressing mCherry and HuC/D in the telencephalic area, the retina and the PGZ are indicated by white arrows in A''-C'' and A'''-C'''. (D-F) ISH for gad65 and gad67a probes (green) coupled with immunohistochemistry against mCherry proteins (red) on cryosections of adult (>6 months post-fertilization) brains. Examples of cells expressing mCherry and gad65/67a in the PPa near the ventricular zone (E) and in the Hd (F) are indicated by white arrows in E'', E''', F'' and F'''. n=4 in two biological replicates. (G) ISH for gad65 and gad67a probes (green) coupled with immunohistochemistry against mCherry proteins (red) on cryosections of Tg(dlx1/2Cre;Switch)24h juvenile brain showing modest expansion of mCherry cells in the PGZ. An example of a single cell that expresses both mCherry and gad65/67a is indicated by a white arrow in G', G'' and G'''. Scale bar: A-E: 50 µm; A'''-E''': 20 µm. |
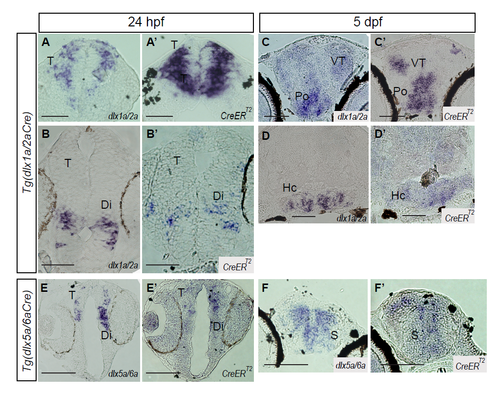
Expression ofCreERT2transgene. (A-F)In situ hybridization using antisense probes against dlx1a and dlx2a (A-D), dlx5a and dlx6a (E,F) and CreERT2 (A’-F’) on cryosections from Tg(dlx1/2Cre;Switch) 24 hpf embryos (A,B) or 5 dpf larvae (C,D) and from Tg(dlx5/6Cre;Switch) 24hpf embryos (E) or 5 dpf larvae (F). Scale bar: 100 μm. |
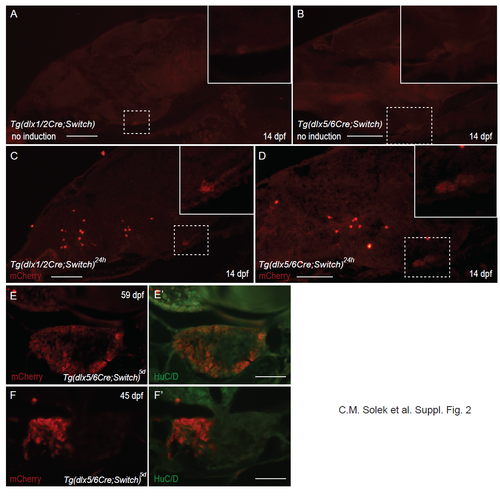
Suppl. Fig. 2: mCherry expression in pituitary gland. (A-D) Immunohistochemical labeling with antibodies against mCherry of cryosections of 14 dpf larvae. Tg(dlx1/2Cre;Switch) (A,C) and Tg(dlx5/6Cre;Switch) (B,D) animals were mock treated with EtOH (no induction; A,B) or with 10 μM 4-OHT at 24 hpf (C,D). Autofluorescence in the pituitary is visible in A and B with white dotted line areas enlarged in insets. mCherry immunohistochemical fluorescent signal is visible in C and D with white dotted line areas enlarged in insets. (E,F) mCherry expression in a subset of cells of the pituitary in juvenile animals. Immunohistochemical labeling with antibodies against mCherry (red) and HuC/D (green) of cryosections of Tg(dlx5/6Cre;Switch)5d showing partial labeling of the anterior pituitary cells devoid of HuC/D expression. Scale bar: 50 μm. |
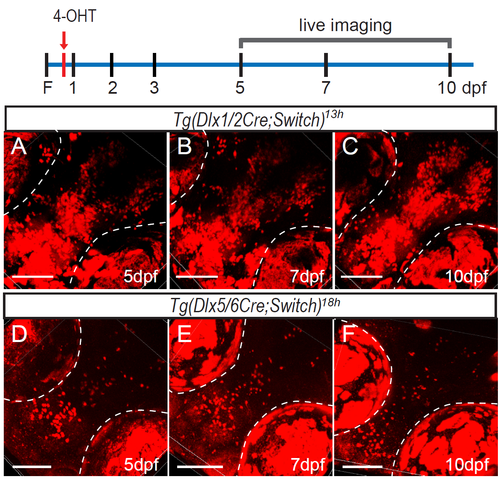
Suppl. Fig. 3: Induction of CreERT2recombinase activity inTg(dlx1/2Cre;Switch)andTg(dlx5/6Cre;Switch)embryos at the onset of transgene expression. (A-C) Tg(dlx1/2Cre;Switch)13h embryos imaged at 3 dpf (A, n=6), 7 dpf (B, n=6) and 10 dpf (C, n=7). (D-F) Tg(dlx5/6Cre;Switch)18h embryos imaged at 3 dpf (D, n=12), 7 dpf (E, n=10) and 10 dpf (F, n=5). Scale bar: 100 μm. |
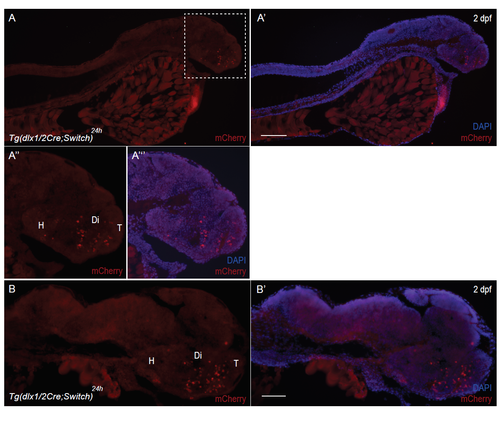
Supplementary material. Suppl. Fig. 4: Restriction of mCherry labeling to the brain. (A-B) Immunohistochemical labeling with antibodies against mCherry of cryosections of Tg(dlx1/2Cre;Switch)24h 2 dpf embryos. Each panel has mCherry staining (red) and DAPI nuclear staining (blue) to highlight the morphology of the entire fish, devoid of mCherry fluorescent staining, except for the brain. The head of the fish delineated by the white dotted line in A is enlarged in A” and A’”. Scale bar: 100 μm. |
Reprinted from Developmental Biology, 427(1), Solek, C.M., Feng, S., Perin, S., Weinschutz Mendes, H.C., Ekker, M., Lineage tracing of dlx1a/2a and dlx5a/6a expressing cells in the developing zebrafish brain, 131-147, Copyright (2017) with permission from Elsevier. Full text @ Dev. Biol.