
- Title
-
The Pu.1 target gene Zbtb11 regulates neutrophil development through its integrase-like HHCC zinc finger
- Authors
- Keightley, M.C., Carradice, D.P., Layton, J.E., Pase, L., Bertrand, J.Y., Wittig, J.G., Dakic, A., Badrock, A.P., Cole, N.J., Traver, D., Nutt, S.L., McCoey, J., Buckle, A.M., Heath, J.K., Lieschke, G.J.
- Source
- Full text @ Nat. Commun.
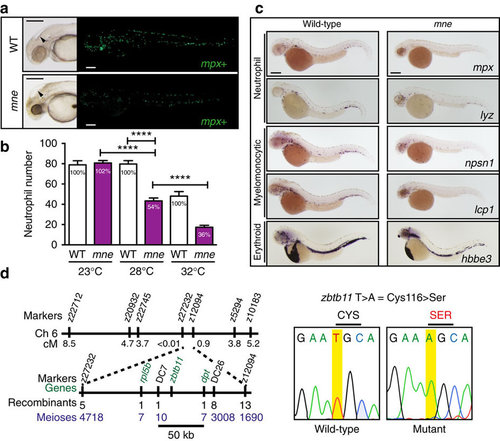
mne presents a myeloid phenotype at 48 h.p.f. and maps to zbtb11. (a) Brightfield: enlarged fourth ventricle (arrow-head), small dark eye and opacity due to CNS degeneration. Fluorescence: fewer mpx:EGFP-positive cells in mne compared to WT (enumerated in b). (b) Neutrophil deficiency, reflected by the abundance of mpx:EGFP-positive cells, is exacerbated by increasing temperature in the temperature-sensitive mutant mne. Percentage of neutrophils compared to WT is stated in the columns (data from one experiment (from left to right: n=11, 12, 19, 12, 10, 11) representative of four biologically independent replicates, two-tailed t-test; ****P≤0.0001). (c) Decreased expression of multiple myeloid genes in mne. Whole-mount in situ hybridization of mne and WT siblings with neutrophil (mpx, lyz), myelomonocytic (lcp1, npsn1), and erythroid (hbbe3) markers at 48 h.p.f. (d) Summary of marsanne genome scan data defining a region narrowed by positional cloning to a 50 kb critical interval, which contained a single gene, zbtb11. Sequencing of mne zbtb11 identifies a single T>A transversion in exon 2 resulting in a Cys>Ser substitution at amino acid 116 (C116S); scale bars, 200 μm (a,c). |
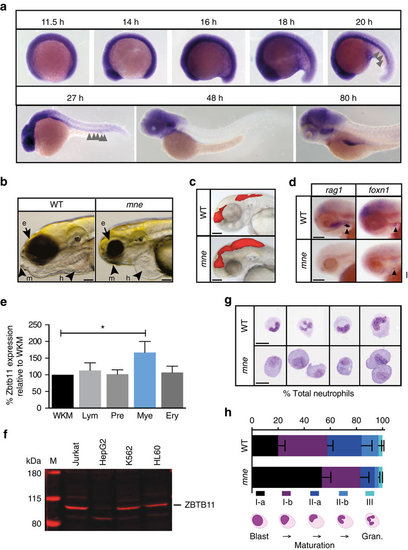
Zbtb11 expression and mne phenotype including delayed neutrophil maturation. (a) Whole-mount in situ hybridization (WISH) showing widespread expression of Zbtb11 in the developing embryo up until 19 h.p.f., which becomes progressively restricted up until 80 h.p.f. Arrows indicate Zbtb11 expression in the intermediate cell mass (ICM). (b) At 96 h.p.f., mne exhibits ocular, craniofacial and cardiovascular defects. e, eye; h, heart; m, mandibular cartilage. (c) Injection of rhodamine at 48 h.p.f. shows enlarged dye volume in fourth ventricle in mne compared to WT. (d) Loss of rag1 expression in mne at 82 h.p.f. compared to WT. Foxn1 marking the thymic primordium is expressed in mne and WT. (e) RT–qPCR of Zbtb11 expression in FACS sorted adult zebrafish blood cell populations (mean±s.d.; *P≤0.05; n=1 experiment; triplicate replicates on cDNA isolated from purified haemopoietic populations derived from pooled kidney marrows). Ery, erythroid; Lym, lymphoid; Mye, myeloid; Pre, precursors; WKM, whole kidney marrow; Mann–Whitney test. (f) Immunoblot showing ZBTB11 is expressed in human myeloid and lymphoid cell lines and with lower expression in HepG2 hepatocytes (50 μg protein per lane); M, protein ladder with molecular weight in kDa as indicated. (g) Examples of FACS-sorted neutrophils from mne and WT following May–Grünwald Giemsa staining. (h) Quantification of neutrophil sub-populations in mne and WT according to maturity shown as percentage of total cells counted. Schema below graph defines how sub-populations were scored. Gran., granulocytes. n=3 biologically independent experiments (mean±s.e.m.); (a) whole embryo scale70; scale bars, 200 μm (b–d,g). EXPRESSION / LABELING:
|
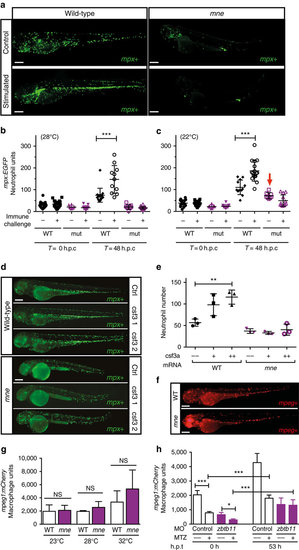
Zbtb11 deficiency results in failure of emergency granulopoiesis. (a) Fluorographs of representative embryos either unstimulated (control) or 48 h post challenge with frozen T. marneffei spores. (b) Graph showing enumeration of neutrophils in embryos raised at 28 °C; data from one representative experiment of three biological replicates; each point represents one embryo (from left to right: n=21, 24, 8, 13, 16, 11, 9, 20); mean ±s.d., Mann–Whitney test; ***P≤0.001; h.p.c., hours post challenge with frozen T. marneffei spores; (c) Enumeration of neutrophils raised at 22 °C (arrow indicates the number of unstimulated neutrophils in mne approaches that of WT at 22 °C); details as for (b) (from left to right: n=15, 16, 9, 13, 12, 16, 8, 12); one-tailed t-test; ***P≤0.001. (d) Overexpression of csf3a (G-CSF) results in vigorous stimulation of neutrophil expansion in WT but not mne embryos shown as mpx-EGFP+ fluorescent neutrophils; ctrl, control; csf3 1 and csf3 2, 0.05 ng and 0.1 ng of csf3a mRNA, respectively. (e) Enumeration of neutrophils in d. Mean ±s.e.m.; two-tailed t-test; n=3 biologically independent experiments; **P≤0.01). (f) Fluorographs of representative WT Tg(mpeg1:mCherry) and mne;mpeg1:mCherry embryos showing similar numbers of macrophages. (g) Enumeration of macrophages in f shows that at 48 h.p.f. macrophage development remains unaffected regardless of severity of marsanne phenotype. n=2 biologically independent experiments; mean ±s.e.m., two-tailed t-test; NS=P>0.05. (h) Macrophage development is independent of Zbtb11. Repopulation of macrophages following their selective ablation by metronidazole (MTZ) treatment of Tg(mpeg1:Gal4FF/UAS:nfsb-mCherry/mpx:EGFP) embryos occurs in both Zbtb11 and control morphants. Details as for b (from left to right: n=18, 18, 7, 12, 14, 16, 6, 12); *P≤0.05; ***P≤0.001; h.p.t., hours post treatment; scale bars, 200 μm (a,d,f). |
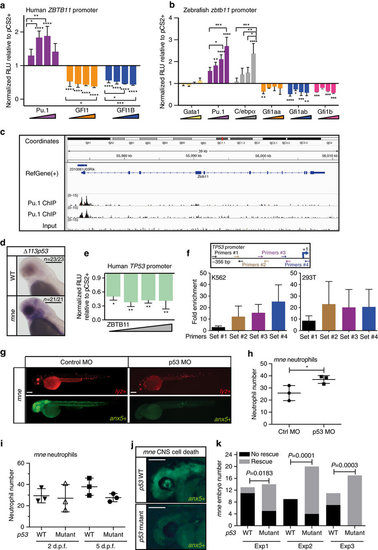
ZBTB11 is regulated by myeloid transcription factors and directly represses TP53. (a) Transient co-transfection of human ZBTB11 2.9 kb promoter luciferase reporter and transcription factors into 293T cells shows ZBTB11 is regulated by PU.1 (positively) and GFI1a/b (negatively). Triangles represent increasing concentration of transcription factors (n=3 experiments; mean ±s.e.m.; two-way ANOVA). (b) A zebrafish zbtb11 2.3 kb promoter reporter is positively regulated by Pu.1 and C/ebpα, and negatively regulated by all three Gfi1 paralogs. Triangles represent increasing concentration of transcription factors (n=3 experiments; mean ±s.e.m.; two-way ANOVA). (c) ChIPseq shows PU.1 occupies the Zbtb11 locus in mouse granulocytes at the promoter, 5′ untranslated region of exon 1 and within intron 1. (d) Whole-mount in situ hybridization shows overexpression of Δ113p53 in the brain at 48 h.p.f. in mne but not phenotypically WT sibling embryos. (e) Transient co-transfection of ZBTB11 and a human TP53 luciferase reporter into 293T cells shows direct repression of TP53 by ZBTB11. Triangle represents increasing concentration of ZBTB11 (n=3 experiments; mean ±s.e.m.; two-way ANOVA). (f) ZBTB11 is enriched at the TP53 locus by ChIP–qPCR in human K562 (endogenous ZBTB11) and 293T HEK cells (overexpressed mouse ZBTB11). Using four primer sets tiled across the TP53 promoter, primer set 1 yields little enrichment over normal rabbit serum control, while primer sets 2–4 show 12–25-fold enrichment (K562: n=5 experiments, mean ±s.e.m.; 293T: n=2 experiments, mean ±s.e.m.). (g) Antisense morpholino oligonucleotide knockdown of tp53 suppresses excessive apoptosis and increases neutrophil number in mne embryos. (h) Quantification of mne neutrophils in control and tp53 morphants (n=3 experiments; mean ±s.e.m.; two-tailed paired t-test). (i) Quantification of mne neutrophils in tp53 WT and tp53M214K/M214K at 2 and 5 d.p.f.; (n=3 experiments; two-tailed paired t-test). (j) Cell death marked by Annexin secA5-mVenus is prominent in mne CNS on tp53 WT background and rescued on mne/ tp53M214K/M214K. (k) 2 × 2 Contingency table χ2 analysis shows rescue of CNS cell death in mne on the tp53M214K/M214K mutant background. Data for three independent experiments; Exp1, n=13, 14; Exp2, n=9, 20; Exp3, n=11, 17; exact P values are shown. Where indicated: *P≤0.05; **P≤0.01; ***P≤0.001; ****P≤0.0001; scale bars, 300 μm (d), 200 μm (g,j). |
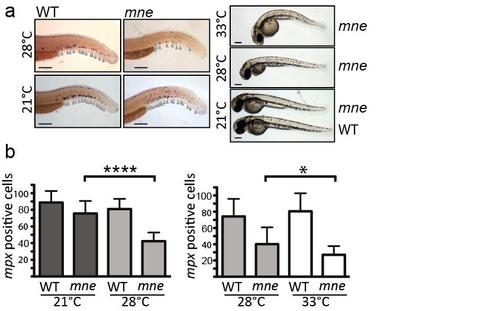
Marsanne is a temperature-sensitive zbtb11 mutant (supports Fig. 1b) a. Whole-mount in situ hybridization showing staining of mpx+ neutrophils and gross morphology demonstrates severity of the mne myeloid-failure phenotype and the overall dysmorphic phenotype of mne embryos varies with temperature. Grey arrows indicate neutrophils; scale bar = 200 μm; b. At lower temperature (21°C) neutrophil numbers are partly restored towards normal and at higher temperatures (33°C) the neutrophil deficiency is exacerbated. Left: n=14-16/group; Right: n=12-17/group; mean ±SD, twotailed unpaired t-test. |
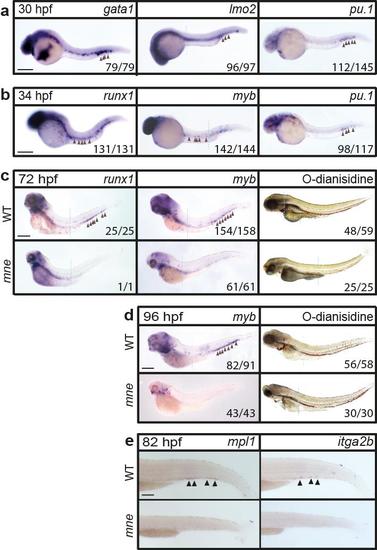
Depletion of definitive haemopoiesis in mne (supports Fig. 1b) Whole-mount in situ hybridization showing: a. Erythromyeloid specification marked by gata1, lmo2 and pu.1 expression proceeds in mne; b. HSC specification marked by runx1 and myb proceeds in mne. c,d. At 72 and 96 hpf, HSCs are depleted in mne while O-dianisidine staining shows haemoglobinised erythrocyte abundance is unaffected; e. Decreased numbers of cells expressing mpl and itga2b shows that thrombocytes are depleted in mne. Where head and tail images of the same embryo were spliced to maintain in-focus focal plane, a dashed line indicates the junction; panels a-e scale bar = 200 μm. |
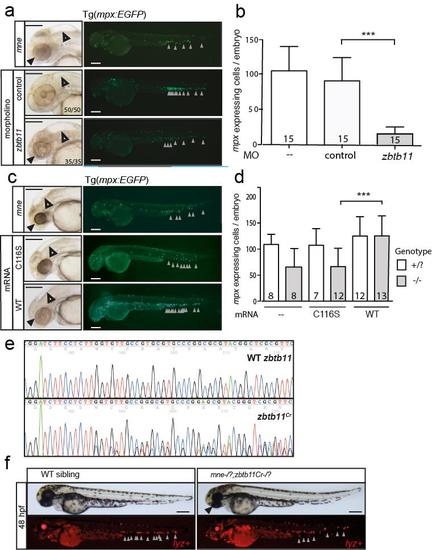
Genetic proofs validate identification of Zbtb11 from positional cloning (supports Fig. 1d) a. Phenocopy of mne hydrocephalus phenotype (open arrow) and microphthalmia (solid arrow) phenotypes and neutrophil-depletion phenotypes (fluorescence images) by antisense morpholino oligonucleotide knockdown of Zbtb11 in WT embryos; b. Enumeration of neutrophils in morphant embryos represented in a; n numbers are shown within columns; c. Rescue of mne hydrocephalus (open arrow) and microphthalmia (solid arrow) phenotypes and neutrophil-depletion phenotype (grey arrows in fluorographs) by overexpression of WT but not C116S Zbtb11 mRNA in mne embryos; d. Enumeration of neutrophils in morphant embryos represented in c; n numbers are shown within columns; e. Additional zbtb11 allele generated by CRISPR/Cas9 locus genome editing. Shown is sequence for WT zbtb11 and a zbtb11Cr CRISPR allele with predicted premature stop codon at amino acid 56; f. Non-complementation of mne allele by zbtb11Cr allele in mne;zbtb11Cr transheterozygotes (black arrow, microphthalmia; grey arrows, neutrophils); Panels a, c, f scale bar = 200 μm. |
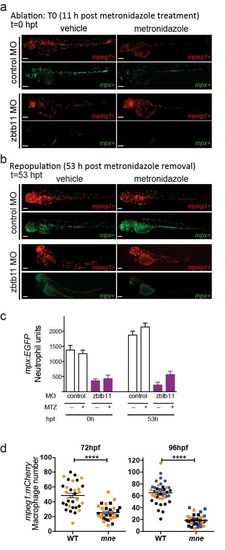
Zbtb11 is dispensable for primitive macrophage development but is required for maintenance of macrophage populations in definitive haemopoiesis (supports Fig. 3h) a. Macrophages are ablated after 11 h treatment with metronidazole (t=0 hpt); b. Macrophage repopulation occurs in both control and zbtb11 morphants; c. Neutrophils in the same animals and conditions as for a are unaffected by macrophage ablation (n=3 experiments; mean ±SEM); d. Macrophages are depleted in mne at 72-96 hpf (n=3 experiments; each point represents an embryo; pooled data with embryos from individual experiments shown in different colours; 72 hpf, n=32,29; 96 hpf, n=41,38; mean ±SEM; Mann-Whitney test); panels a, b scale bar = 100 μm. |
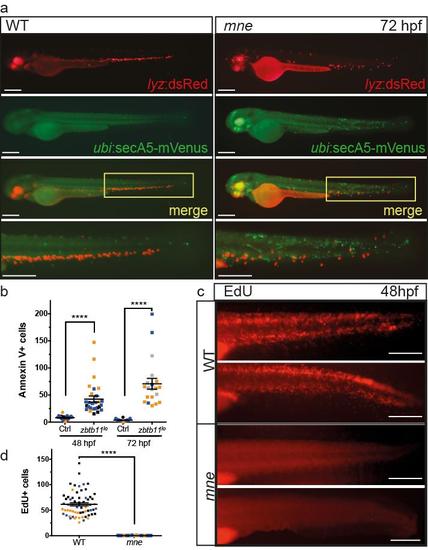
Zbtb11 deficiency results in increased apoptosis and cell cycle arrest (supports Fig. 4) a. Overlay of lyz:dsRed and secA5:mVenus expression shows that apoptotic cells are not coincident with neutrophils in mne. Area in yellow box is expanded in lower panel; b. Quantification of apoptotic cells in zbtb11lo. Pooled data with embryos from individual experiments shown in different colours (mne (n=1) or zbtb11 morphants (n=2) and WT (n=3) experiments); from left to right: n=25,28,30,20; mean ±SEM; Mann-Whitney test); c. Representative images of EdU positive cells in the caudal haemopoietic tissue in WT and mne; d. Quantification of EdU positive cells in mne and WT; n=3 experiments, pooled data with embryos from individual experiments shown in different colours; WT, n=63; mne, n=73; mean ±SEM; Mann-Whitney test); panels a, c scale bar = 200 μm. |