
- Title
-
A152T tau allele causes neurodegeneration that can be ameliorated in a zebrafish model by autophagy induction
- Authors
- Lopez, A., Lee, S.E., Wojta, K., Ramos, E.M., Klein, E., Chen, J., Boxer, A.L., Gorno-Tempini, M.L., Geschwind, D.H., Schlotawa, L., Ogryzko, N.V., Bigio, E.H., Rogalski, E., Weintraub, S., Mesulam, M.M., Fleming, A., Coppola, G., Miller, B.L., Rubinsztein, D.C.
- Source
- Full text @ Brain
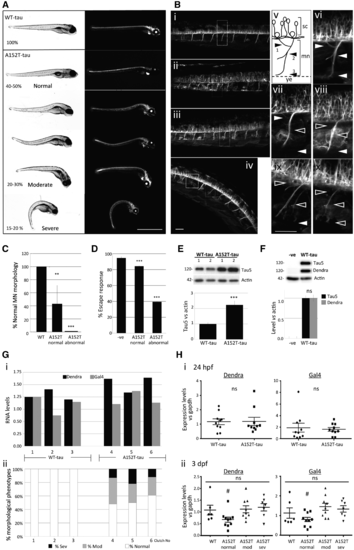
Phenotypic characterization of Dendra-tau transgenic zebrafish. (A) Representative images of fish with pan-neuronal expression of WT-tau and A152T-tau. In all clutches of WT-tau offspring, larvae were normal. In contrast, A152T-tau fish showed abnormal phenotypes in ∼50% of each clutch. Differing degrees of abnormal curvature of the dorsal spine was observed in A152T-tau fish (percentages refer to the number of the larvae within each severity range per clutch; observations based on more than 30 individual clutches per transgenic line). Scale bar = 1 mm. (B) Motor neuron morphology was analysed by confocal microscopy on live fish and abnormalities found only in A152T-tau fish including truncation, abnormal pathfinding and aberrant branching (ramifications) (i) WT-tau; (ii–iv) A152T-tau, with normal (ii), moderate (iii) and severe (iv) phenotypes. (v) Schematic view of a single somatic motor neuron (mn) unit from the spinal cord (sc) to the yolk extension (ye) and its ramifications divided into dorsal (arrowhead 1) and medial (arrowhead 2). Arrowhead 3 labels normal axonal length reaching the yolk extension. Panels vi–x correspond to magnified images of i–iv highlighting normal (white arrowheads) or abnormal (black arrowheads) ramifications and length according to axonal scheme represented in v [vi corresponds to WT-tau (i); vii corresponds to normal phenotype A152T-tau (ii); viii corresponds to moderate phenotype A152T-tau (iii); ix and x correspond to severe phenotype A152T-tau (iv)]. Scale bar = 50 µm. See also Supplementary Fig. 2. (C) Quantification of the branching defects observed in motor neurons (MN) according to scheme in B(v) at 3 dpf. Abnormalities at any specified point (arrowheads 1, 2 or 3) were counted as abnormal (five segmental motor neuron units within the yolk sac extension region of the trunk, anterior to the urogenic opening, were counted for n = 18 fish per group; graph represents mean ± SD; two-tailed t-test, **P < 0.01 and ***P < 0.001 versus WT-tau). (D) Escape response defects were observed in A152T-tau but not WT-tau fish at 6 dpf (three independent experiments in triplicate, n = 20/group shown as mean ± standard error; ***P < 0.001 versus negative siblings by two-tailed t-test). (E) Fish expressing A152T-tau show significantly higher levels of total human tau protein at 3 dpf (mean ± SEM, n = 3 independent clutches in triplicate, ***P < 0.001 versus WT-tau by two-tailed t-test). (F) Levels of Dendra-tau protein (∼120 kDa) could be equally detected by western blot with either Dendra or Tau5 antibodies (mean ± standard error of four clutches in triplicate, by two-tailed t-test). (G) The higher levels of Dendra-tau together with the morphological and motility defects observed in A152T-tau fish are not the result of higher levels of expression of the transgene (mRNA levels). [G(i)] Quantification of the mRNA expression levels of Dendra and Gal4 by quantitative RT-PCR at 24 hpf (pre-phenotype) shows variability in the expression of Dendra between different clutches of WT-tau fish (three independent clutches labelled 1–3) and A152T-tau fish (three independent clutches labelled 4–6). Analysis was performed on groups containing n = 10 fish. [G(ii)] Phenotypic assessment of larvae at 3.dpf from the same clutches analysed in [G(i)] shows abnormal phenotypes in all clutches of A152T-tau fish regardless of the expression level of Dendra-tau. The similar levels of expression of Dendra in clutches 2 (WT-tau) and 5 (A152T-tau) at 24 hpf resulted in abnormal phenotypes only in A152T-tau expressing fish (sev = severe, mod = moderate, according to morphological phenotype score presented in A). (H) Quantification of the mRNA expression levels of Dendra and Gal4 from 10 individual fish collected from clutches 2 (WT-tau) and 5 (A152T-tau). When siblings from these clutches were analysed as pooled samples, equal Dendra mRNA expression levels were observed at 24 hpf. When mRNA expression levels of Dendra or Gal4 were measured in single WT-tau and A152T-tau fish at 24 hpf (pre-phenotype), no significant differences were observed. [H(i)]. At 3 dpf [H(ii)] WT-tau and A152T-tau individual fish with moderate and severe phenotypes had equivalent levels of Dendra and Gal4 mRNA expression. However, A152T-tau fish which were morphologically normal were found to have significantly lower levels of Dendra mRNA expression [H(ii)]. EXPRESSION / LABELING:
PHENOTYPE:
|
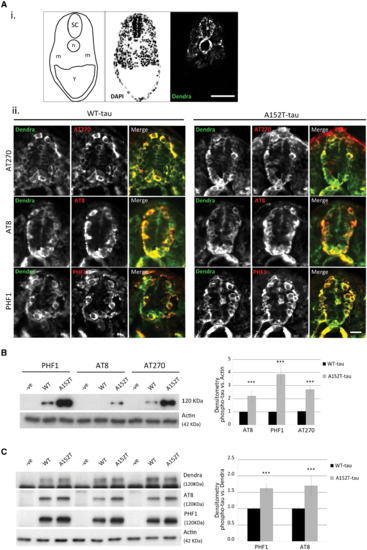
Phosphorylation state of tau in Dendra-tau transgenic zebrafish. Pathological hyperphosphorylation and conformational changes are hallmarks of tauopathies. (A) Both WT- and A152T-tau expressing larvae showed positive immunostaining for the hyperphosphorylation markers AT270 (residue Thr181), AT8 (residues Ser202/Thr205) and PHF1 (residues Ser396/Ser404) in cryosections, from 24 hpf onwards. [A(i)] Schematic overview, DAPI and Dendra images of transverse sections through the spinal cord used for phosphorylated tau detection at 24 hpf (SC = spinal cord, n = notochord, m = muscle block and Y = yolk sac). Scale bar = 50 μm. [A(ii)] Fluorescent images of Dendra-tau (green) and phospho-tau antibodies (red) show positive single neurons stained for AT270, AT8 and PHF1 within the spinal cord in both WT-tau and A152T-tau fish at 24 hpf. Scale bar = 10 μm. See Supplementary Fig. 5. (B) Western blot for phosphorylation markers AT270, AT8 and PHF1 in whole fish lysates at 3 dpf. The levels of phospho-tau were significantly increased in A152T-tau fish compared to WT-tau fish relative to the loading control, actin (mean ± SEM of 10 independent clutches; two-tailed t-test, ***P < 0.001 versus WT-tau). (C) The higher phosphorylation levels were also observed in A152T-tau fish relative to total tau (Dendra-tau) levels (mean ± SEM, n = 24 fish/group of 10 independent clutches for PHF1 and eight independent clutches for AT8; two-tailed t-test, ***P < 0.001 versus WT-tau). EXPRESSION / LABELING:
PHENOTYPE:
|
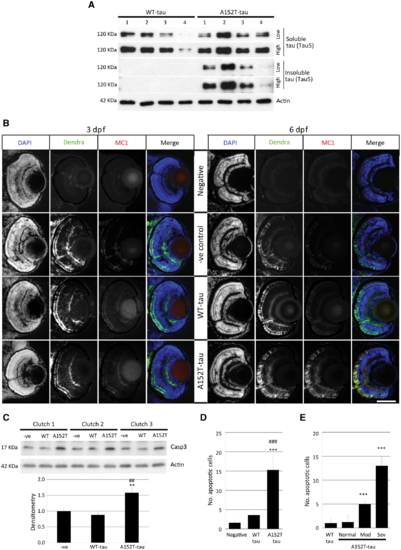
Tau aggregation and cell death in Dendra-tau transgenic zebrafish. (A) Levels of sarkosyl-soluble and insoluble tau reflect accumulation of the insoluble form only in A152T-tau fish at 6 dpf. The level of total tau was analysed by immunoblotting using Tau5 antibody (four independent clutches for WT-tau and A152T-tau). (B) Antibody staining for the conformational marker MC1 in cryosections across the eye of WT-tau and A152T-tau fish. No staining was observed in either WT-tau or A152T-tau fish at 3 dpf (left), whereas only A152T-tau presented positive staining for conformational changes at 6 dpf (right). Scale bar = 100 μm. (C) Western blot for active Caspase 3 (Casp3) (quantified below), indicative of increased cell death in fish expressing the A152T variant (mean ± SEM of nine independent clutches; Student-Newman-Keuls one-way ANOVA, *P < 0.01 versus negative, ##P < 0.01 versus WT-tau). (D) The increased cell death in A152T-tau fish was confirmed by quantification of TUNEL labelling on transverse sections (mean ± SD; n = 5 fish, from a minimum of five sections; Student-Newman-Keuls one-way ANOVA, ***P < 0.001 versus negative; ###P < 0.001 versus WT-tau). See also Supplementary Fig. 4. (E) Morphologically abnormal A152T-tau fish showed increased cell death (quantification of TUNEL-positive nuclei) compared to morphologically normal A152T- or WT-tau fish (mean ± SD; Student-Newman-Keuls one-way ANOVA, **P < 0.01 and ***P < 0.001 versus WT-tau). Representative images in Supplementary Fig. 7. EXPRESSION / LABELING:
|
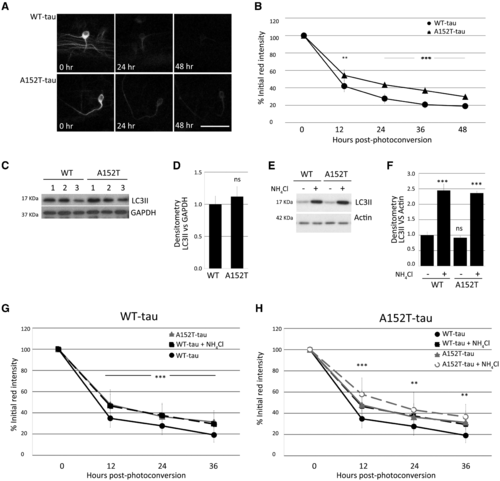
Tau clearance in vivo and autophagy function. Clearance kinetics of photoconverted Dendra-tau measured in neurons of WT-tau and AT152T-tau fish. Measurement of the intensity of the red Dendra-tau signal over time reflects the clearance or degradation of tau protein. (A) Representative images of photoconverted red Dendra-tau signal comparing a single neuron from WT-tau and A152T-tau fish at three different timepoints: immediately after photoconversion (0 h), 24 h and 48 h after photoconversion. (B) Quantification of red Dendra-tau intensity in photoconverted neurons in the spinal cord of WT-tau and A152T-Tau transgenic fish (representative images shown in Supplementary Fig. 8C). The percentage of residual photoconverted red Dendra-tau was measured over 48 h measured at 12-h intervals. Dendra-tagged A152T-tau clears at a significantly lower rate than WT-tau. (n = 30/group shown as mean ± SD; Student-Newman-Keuls one-way ANOVA, **P < 0.01 and ***P < 0.001 versus WT-tau). (C–F) Western blots for LC3-II, a well-characterized marker of autophagosome number, demonstrate that there are no differences in the levels of this protein between WT-tau and A152T-tau fish either at 24 hpf (pre-phenotype; C and D) or 72 hpf (post-phenotype; E and F). (E and F) Measurements of LC3-II levels in the presence or absence of ammonium chloride provides a method for measuring autophagic flux. No differences were observed between the two transgenic lines at 3 dpf, suggesting that autophagy functions normally in both WT-tau and A152T-tau fish (graph represents mean ± SD of four independent clutches per group for E and F and three for C and D; two-tailed t-test). (G and H) Clearance kinetics of Dendra-tau was measured in the presence or absence of ammonium chloride. Treatment with ammonium chloride blocks autophagic flux and delays the clearance of both WT-tau and A152T-tau to the same extent, indicating that flux occurs at the same rate in these two lines (mean ± SD, n = 62 neurons/group; Student-Newman-Keuls one-way ANOVA, **P < 0.01 and ***P < 0.001 versus untreated group). Note in G and H, the ‘WT-tau + NH4Cl’ (denoted by black squares and black dashed line) overlaps with the ‘A152T-tau’ line (denoted by grey triangles and grey solid line). The graphs in G and H are presented with a different line in the foreground and background to aid interpretation. |

ZFIN is incorporating published figure images and captions as part of an ongoing project. Figures from some publications have not yet been curated, or are not available for display because of copyright restrictions. |
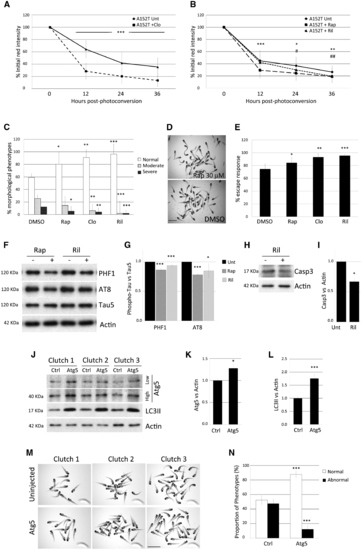
Modulation of A152T-tau clearance and pathology by upregulation of autophagy. (A and B) Treatment of A152T-tau fish with the autophagy inducers clonidine (A), rapamycin or rilmenidine (B), accelerated clearance kinetics of A152T-tau (mean ± SD of n ≥ 40 neurons/group; Student-Newman-Keuls one-way ANOVA, */#P < 0.05; **/##P < 0.01 ***P < 0.001 versus untreated). (C) Treatment with rapamycin (rap), clonidine (clo) or rilmenidine (ril) also ameliorated morphological defects in A152T-tau transgenic fish (n = 6 independent experiments, 20 fish/group, mean ± SD; Student-Newman-Keuls one-way ANOVA, *P < 0.05; **P < 0.01 and ***P < 0.001 versus DMSO). (D) Representative image showing rapamycin treatment reduced the proportion of abnormal A152T-tau fish. Scale bar = 3.5 mm. (E) Quantification of the escape response measured in individual A152T-tau fish 3 dpf, treated with either DMSO, rapamycin, clonidine or rilmenidine. (n = 5 independent experiments in triplicate, 15/group shown as mean ± SD; two-tailed t-test: *P < 0.05, **P < 0.01 and ***P < 0.001 versus DMSO). The treatment with autophagy upregulators improved the escape response deficit in A152T-tau fish. (F and G) Induction of autophagy by the addition of rapamycin or rilmenidine to A152T-tau fish also reduced levels of phosphorylated tau at residues Ser202/Thr205 (AT8) and Ser396/Ser404 (PHF1) relative to total tau levels (n = 3 independent experiments in duplicate, 10/group shown as mean ± SEM; two-tailed t-test: *P < 0.05 and ***P < 0.001 versus DMSO). (H and I) Treatment with autophagy upregulators results in less cell death. Rilmenidine treatment reduced the levels of active caspase-3 (n = 4 independent experiments in triplicate, 10/group shown as mean ± SEM; two-tailed t-test: *P < 0.05 versus DMSO). (J–N) Injection of an expression vector encoding zebrafish atg5 into A152T-tau fish embryos resulted in over-expression of Atg5 protein at 2 dpf (J and K) (high and low exposure of the same blot presented; mean ± SD, n = 6 independent clutches; two-tailed t-test, *P < 0.05 versus control). (J and L) The increase in Atg5 protein correlated with increase in LC3II, a well-characterized reporter for autophagosome number, demonstrating that autophagy was upregulated in Atg5-injected fish (mean ± SEM, n = 8 independent clutches; two-tailed t-test, ***P < 0.001 versus control). (M and N) A consistent reduction in the number of offspring with morphological defects was observed in Atg5-injected fish compared to control (uninjected) siblings. The percentage of normal fish changes from 52.43% ± 6.01 to 87.79% ± 4.87 after Atg5 injection and consequently, the proportion of abnormal fish diminishes from 47.57% ± 6.01 to 12.21% ± 4.87 (mean ± SEM of seven independent clutches; two-tailed t-test, ***P < 0.001 versus control). EXPRESSION / LABELING:
|
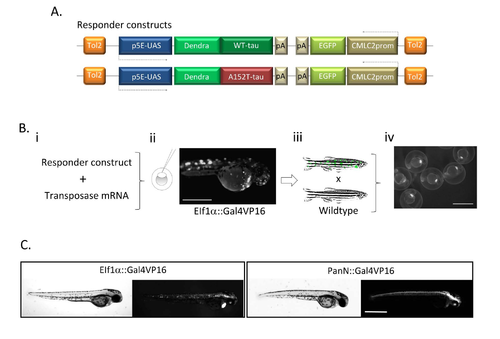
Generation of transgenic Dendra-tau zebrafish: (A) The responder construct comprises the gene encoding human wildtype or mutant A152T tau fused to the sequence encoding the photoactivatable protein Dendra, downstream of UAS. The transgene also contains EGFP driven by the cardiac myosin light chain (CMLC2) promoter in the reverse orientation. The Gal4 driver constructs contain the ubiquitous (EIF1α) or panneuronal (PanN) zebrafish promoters driving the expression of Gal4-VP16, which binds to the UAS on the responder construct. (B) To generate transgenic fish, the responder construct was injected together with the Tol2 mRNA (Bi) to facilitate random integration of the construct into the zebrafish genome resulting in mosaic founder embryos (Bii, scale bar represents 500 μm). Mosaic Dendra-tau positive larvae were identified at 3 d.p.f, raised and outcrossed with wild-type fish (Biii). Transgenic offspring were identified by green hearts i.e. expression from the CMLC2::EGFP reporter (Biv). Scale bar represents 1mm. (C) Dendra-tau expression patterns in the offspring of UAS::Dendra-tau fish crossed with EIF1::Gal4VP16 and PanN:Gal4VP16 driver fish at 48 hours post-fertilisation (h.p.f). Dendra-tau driven by EIF1::Gal4VP16 results in a ubiquitous but mosaic expression of Dendra-tau. Such crosses were used for clearance assays in Fig. 5A,B,G&H, Fig. 6A&B and Fig 7A&B. Ubiquitous transgene expression in offspring from crosses to beta-actin::Gal4VP16 driver fish were used for proteasome assays in Fig. 6F&G (Dendra-tau driven by beta-actin::Gal4VP16 not shown). All other experiments use Dendra-tau driven by PanN::Gal4VP16Scale bar represents 500 μm. |
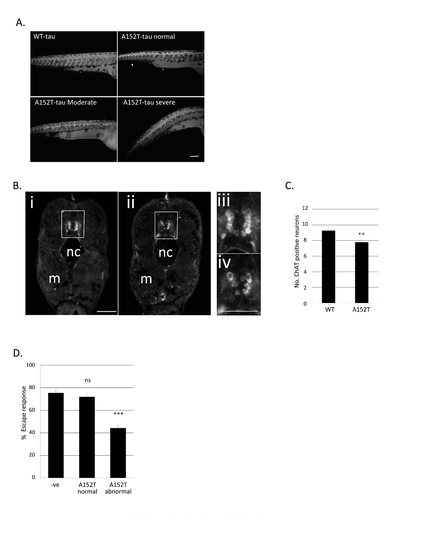
Cholinergic denervation in Dendra-tau fish (A) Antibody staining for alpha-acetylated tubulin in 3 d.p.f. WT-tau and A152T-tau fish visualise abnormalities in branching of motor neurons (supporting main figure Fig.2B&C). Scale bar represents 100 μm. (B) Representative images showing the loss of cholinergic (motor) neurons in the spinal cord (squared area) of A152T-tau fish compared to WT-tau by immunostaining with ChAT antibody (6 d.p.f.) (nc=notochord; m=muscle). Images iii and iv show high magnification regions of the spinal cord. Scale bar represents 50 μm. (C) Quantification of the number of ChAT-positive motor neurons across 20 sections of the spinal cord from the dorsal fin region (mean ± standard error, N=5 fish/group; two-tailed t-test, **P<0.01 vs. WT-tau). (D) Quantification of the escape response of mutant A152T-tau fish or Dendra-negative siblings at 3 d.p.f showing that defects are observed at 3 dp.f. in addition to those reported at 6 d.p.f. in Figure 2D (3 independent experiments in triplicate, N=20/group shown as mean ± standard error; ***P<0.001 vs. negative siblings by two-tailed t-test). |
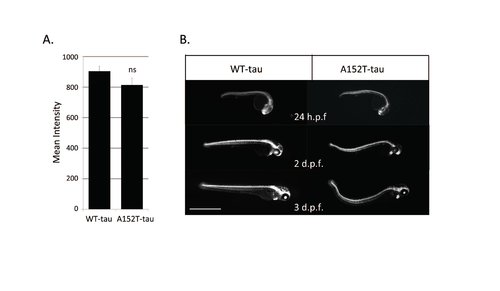
Dendra-intensity levels in Dendra-tau fish (A) Quantification of the mean fluorescent intensity of Dendra in WT-tau and A152T-tau fish shows no significant differences at 24 h.p.f. (pre-phenotype) and fluorescent intensity does not correlate with the onset of morphological abnormalities in A152T-tau fish. (B) Images of WTtau and A152T-tau fish sorted for similar initial Dendra fluorescent intensity at 24 h.p.f and followed over subsequent days. Only fish expressing A152T-tau developed abnormal phenotype. Scale bar represents 1 mm. |
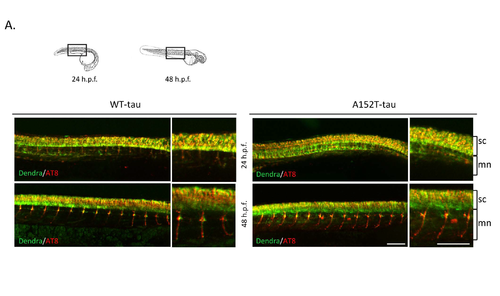
Dendra-tau phosphorylation in transgenic zebrafish Further data supporting main Fig.3. (A) Representative images of whole-mount immunostaining for the hyperphosphorylation marker AT8 at 24 and 48 h.p.f. in the areas represented in schematic overviews above. Pictures show Dendra signal (green) and positive AT8 staining (red) in both WT- and A152T-tau larvae from 24 h.p.f. Pictures at higher magnification demonstrate the presence of hyperphosphorylated tau in somas of individual motorneurons in the spinal cord (sc) as well as their axonal projections. At 48 h.p.f, the staining was greater in the axons. Scale bar represents 150 μm. |
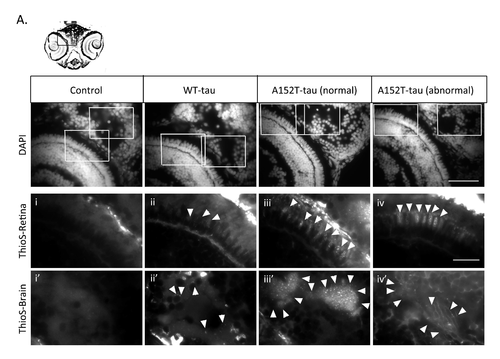
Dendra-tau aggregation in transgenic zebrafish Further data supporting tau aggregation shown in main Fig.4. (A) Thioflavin-S staining of transverse sections through the eye and brain at the level of the optic chiasm. Positive staining was observed in both WT- and A152T-tau fish indicating tau aggregation and the presence of NFTs with increased accumulation in fish expressing the mutant A152T-tau (arrowheads). Upper panel, DAPI (nuclear) stained sections of eye and brain with selected regions stained with thioflavin-S presented at higher magnification below (i-iv show eye; i'-iv' brain). Scale bar represents 40 μm. Scale bar represents 20 μm. |
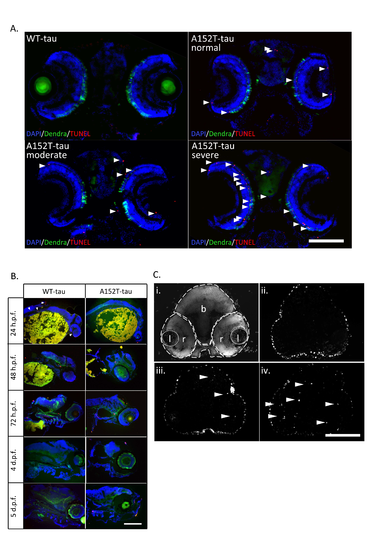
Cell death in Dendra-tau zebrafish Further data supporting main Fig.4. (A) Representative images of TUNEL labelling in brain sections showing consistent and reproducible differences in cell death between WT- and A152T-tau fish according to morphological phenotype (normal, moderate and severe) at 6 d.p.f. Apoptotic nuclei are highlighted by white arrowheads and quantification is shown in main Fig. 4E. B) TUNEL labelling on longitudinal sections of WT- and A152T-tau fish from 24 h.p.f. to 5 d.p.f. used to identify the time points at which cell death is occurring. The timecourse showed a larger number of apoptotic cells in mutant A152T-tau compared to WTtau fish in all ages, most evident at 2 d.p.f. (C) TUNEL labelling in brain sections of WT- and A152T-tau fish at 2 d.p.f. representative of those used for quantification of the number of apoptotic cells presented in main Fig.4D (l=lens; r=retina and b=brain) . A-C scale bar represents 100 μm. |
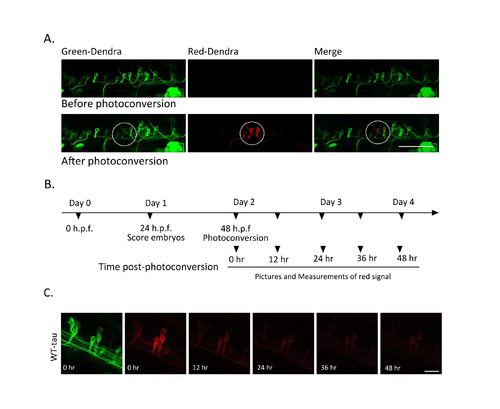
Dendra-photoconversion protocol (A) Photoconversion of Dendra: Confocal images of green Dendra-tau and red Dendra-tau before and after photoconversion of spinal cord motor neurons of WT-tau fish. The circle indicates the area targeted for photoconversion with 405nm laser. Scale bar represents 50 μm. (B) Schematic diagram of the photoconversion protocol. On day 1, fish were screened at 24 h.p.f to identify those with mosaic Dendra-tau expression. On day 2, individual neurons in the spinal cord were exposed to 405nm light for 3 sec to photoconvert the green-Dendra into red- Dendra. Pictures of redDendra-tau signal were taken immediately after photoconversion (to obtain an image of the maximum red signal) and subsequently at 12, 24, 36 and 48 hr postphotoconversion. (C) Clearance of red-Dendra-tau signal: confocal images of photoconverted neurons in WT-tau fish immediately after photoconversion and at 12, 24, 36 and 48 hours later. Intensity of the red signal was then analysed using FIJI software. A & C Scale bar represents 10 μm. |