
- Title
-
Critical Role for GAB2 in Neuroblastoma Pathogenesis through the Promotion of SHP2/MYCN Cooperation
- Authors
- Zhang, X., Dong, Z., Zhang, C., Ung, C.Y., He, S., Tao, T., Oliveira, A.M., Meves, A., Ji, B., Look, A.T., Li, H., Neel, B.G., Zhu, S.
- Source
- Full text @ Cell Rep.
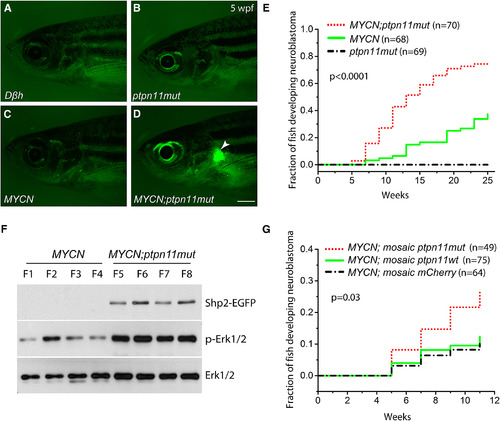
Mutant ptpn11 Synergizes with MYCN in Neuroblastomagenesis (A–D) Fluorescence micrographs of control Dβh (A), ptpn11mut (B), MYCN (C), and compound MYCN;ptpn11mut (D) transgenic fish. Note the EGFP-expressing tumor in the interrenal gland (IRG; arrowhead in D) at 5 weeks postfertilization (wpf). Scale bar, 1 mm. (E) Kaplan-Meier analysis showing cumulative frequency of neuroblastoma induction over 6 months in the indicated stable transgenic zebrafish lines (p < 0.0001 for MYCN-only versus MYCN;ptpn11mut by log-rank test). (F) Phospho-Erk1/2 immunoblots of lysates from individual MYCN-only (F1–F4) or MYCN;ptpn11mut tumors (F5–F8). Total Erk1/2 levels serve as a loading control. (G) Kaplan-Meier analysis of cumulative frequency of neuroblastoma induction over 11 weeks in MYCN transgenic fish mosaically overexpressing mCherry alone (MYCN;mosaic mCherry), coexpressing mCherry with ptpn11wt (MYCN;mosaic ptpn11wt), or coexpressing mCherry with ptpn11mut (MYCN;mosaic ptpn11mut). MYCN;mosaic ptpn11mut versus MYCN;mosaic mCherry transgenic fish is significant by log-rank test (p = 0.03). See also Figure S1. EXPRESSION / LABELING:
PHENOTYPE:
|
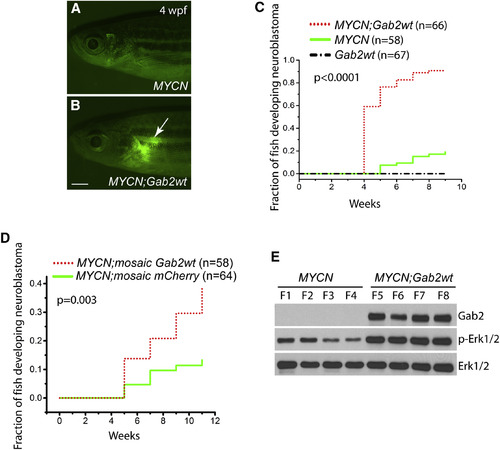
GAB2 and MYCN Synergize in Neuroblastomagenesis (A and B) Fluorescence micrographs of MYCN (A) and compound MYCN;Gab2wt (B) transgenic fish. Note EGFP-expressing tumor in the interrenal gland (arrow) of MYCN;Gab2wt compound transgenic fish at 4 weeks postfertilization (wpf). Scale bar, 1 mm. (C) Kaplan-Meier analysis of the cumulative frequency of neuroblastoma induction over 9 weeks in the indicated stable transgenic zebrafish lines (MYCN-only versus MYCN;Gab2wt, p < 0.0001 by log-rank test). (D) Kaplan-Meier analysis of the cumulative proportion of MYCN transgenic fish mosaically overexpressing mCherry alone (MYCN;mosaic mCherry) or co-expressing mCherry with Gab2wt (MYCN;mosaic Gab2wt) over 11 weeks. Tumor incidence in fish expressing Gab2wt and mCherry was increased over results for mCherry overexpression alone (p = 0.003 by log-rank test). (E) Immunoblot of Shp2-Erk pathway components in neuroblastomas isolated from MYCN-only or MYCN;Gab2wt transgenic fish. Total Erk1/2 levels serve as loading controls. EXPRESSION / LABELING:
PHENOTYPE:
|
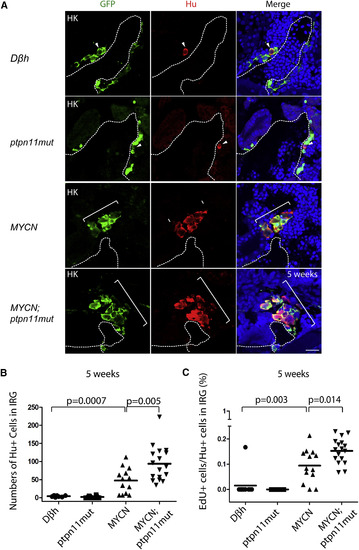
Mutant ptpn11 Enhances the Proliferation of MYCN-Induced Hyperplastic Neuroblasts in the IRG (A) Sagittal sections through the IRGs of control Dβh, ptpn11mut, MYCN, and MYCN;ptpn11mut transgenic fish at 5 wpf (dorsal up, anterior left). GFP, green; Hu, red; DAPI, blue; merge, combined green, red, and blue. Representative sections through the IRG of control Dβh or ptpn11mut fish contain 1-5 GFP+/Hu+ sympathetic neuroblasts (arrowheads). Hu+ cell numbers increase in MYCN and MYCN;ptpn11mut fish (brackets). Dotted lines indicate the head kidney (HK) boundary. Scale bar, 20 μm. (B) Numbers of GFP+/Hu+ sympathetic neuroblasts in the IRG regions of control Dβh, ptpn11mut, MYCN, and MYCN;ptpn11mut transgenic fish at 5 wpf. (C) Percentage of EdU+/Hu+ sympathetic neuroblasts in control Dβh, ptpn11mut, MYCN, and MYCN;ptpn11mut transgenic fish at 5 weeks. Mean values (horizontal bars) were compared by Welch t test (two-tailed). See also Figures S3 and S4. EXPRESSION / LABELING:
PHENOTYPE:
|
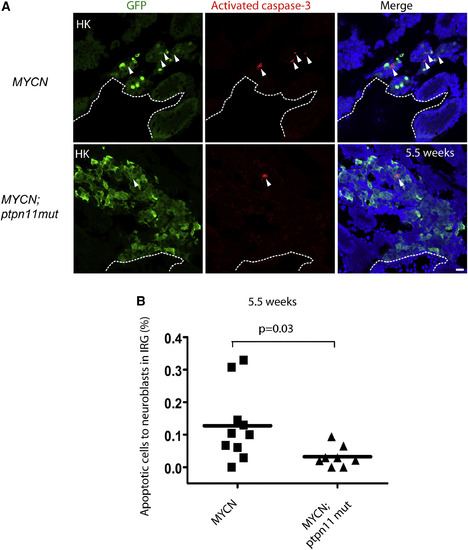
Overexpression of Ptpn11mut Inhibits the Developmentally Timed Apoptotic Response Triggered by MYCN Overexpression in the IRG (A) Sagittal sections through the IRG of MYCN (top) and MYCN;ptpn11mut (bottom) transgenic fish at 5.5 wpf (dorsal up, anterior left). GFP, green; activated caspase-3, red; DAPI, blue. Arrowheads point to the activated caspase-3+ apoptotic cells. Dotted lines indicate the head kidney (HK) boundary. Scale bars, 10 μm. (B) Percentage of activated caspase-3+ apoptotic cells to the total number of GFP+ sympathetic neuroblasts in the IRG of MYCN and MYCN;ptpn11mut fish at 5.5 wpf. Mean values (horizontal bars) were compared by the Welch t test (two-tailed). EXPRESSION / LABELING:
PHENOTYPE:
|
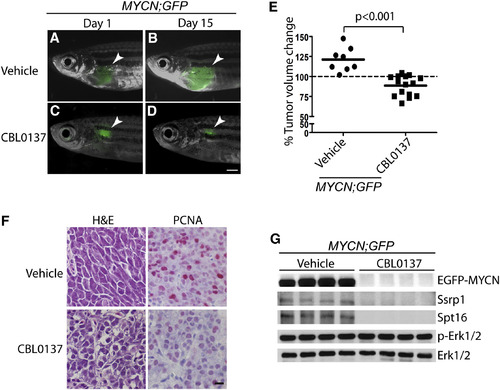
Targeting MYCN with CBL0137 Is Effective against Neuroblastoma in MYCN;GFP Transgenic Fish (A–D) EGFP-expressing tumors (arrowhead) in the MYCN;GFP compound transgenic fish, treated with vehicle (A and B) or CBL0137 (C and D) at days 1 or 15 of treatment. Scale bar, 1 mm. (E) Differences in tumor volume in animals treated with vehicle or CBL0137 on day 15 versus day 1, as measured by the size of EGFP-positive tumor masses using ImageJ software. Mean values (horizontal bars) were compared by Welch t test (two-tailed). (F) Histopathologic and immunohistochemical analyses of MYCN;GFP tumors treated with vehicle or CBL0137. Left: H&E-stained sagittal sections. Right: immunohistochemical staining with PCNA antibody. Scale bar, 50 μm. (G) Immunoblot of lysates from MYCN;GFP tumors treated with vehicle or CBL0137. Total levels of Erk1/2 serve as loading controls. |
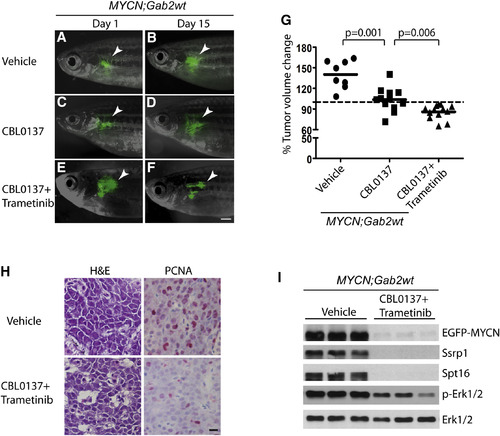
Erk Inhibition Cooperates with CBL0137 to Suppress MYCN;Gab2wt Neuroblastoma (A–F) EGFP-expressing tumors (arrowhead) in the MYCN;Gab2wt transgenic fish treated with vehicle (A and B), CBL0137 alone (C and D), or CBL0137 plus trametinib (E and F) at day 1 or day 15 of treatment. Scale bar, 1 mm. (G) Differences in tumor volume in animals treated with vehicle, CBL0137, or CBL0137 plus trametinib on day 15 versus day 1, as measured by the size of EGFP-positive tumor masses using ImageJ software. Mean values (horizontal bars) were compared by Welch t test (two-tailed). (H) Histopathologic and immunohistochemical analyses of MYCN;Gab2wt tumors treated with vehicle or combined CBL0137 and trametinib. Left: H&E-stained sagittal sections. Right: immunohistochemical staining with PCNA antibody. Scale bar, 50 μm. (I) Immunoblot of lysates from MYCN;Gab2wt tumors treated with vehicle or CBL0137 and trametinib. Total levels of Erk1/2 serve as loading controls. See also Figures S5 and S6. |
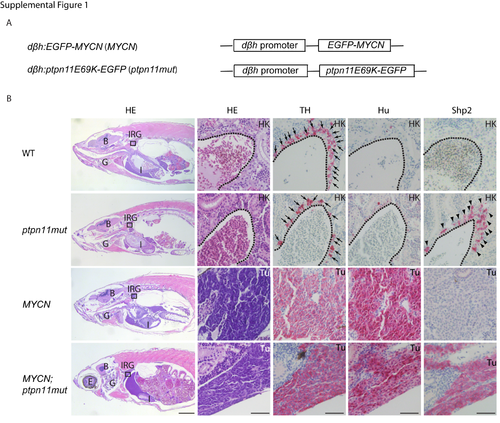
Histopathologic and immunohistochemical analyses of wild-type (WT), ptpn11mut, MYCN-only and MYCN;ptpn11mut fish. Related to Figure 1 (A) Schematic of dβh:EGFP-MYCN (MYCN) and dβh:ptpn11mut-EGFP (ptpn11mut) transgenic constructs. I-SceI sites are located on each end. (B) Histopathologic and immunohistochemical analyses for the indicated antigens of the IRG regions of wild-type (WT), ptpn11mut, MYCN-only and MYCN;ptpn11mut fish. Left two columns: H&E-stained sagittal sections. Boxes indicate the interrenal gland (IRG), magnified in panels on the right. The remaining columns show immunohistochemical staining with tyrosine hydroxylase (TH, an enzyme in the catecholamine biosynthesis pathway) (Teitelman et al., 1979), Hu (a pan-neuronal marker), indicative of a PSNS-related neuronal origin (Marusich et al., 1994; Teitelman et al., 1979) and SHP2 antibodies, as indicated. Arrows indicate sympathoadrenal cells expressing TH in the IRG regions of WT or ptpn11mut fish (top two panels). Arrowheads indicate sympathoadrenal cells expressing Shp2-EGFP fusion protein in the IRG region of ptpn11mut transgenic fish (second panel from top, first column on right). Dotted lines indicate the head-kidney (HK) boundary. Scale bars, 1 mm (first column on left) and 50 μm (all other panels). B, brain; E, eyes; G, gill; I, intestine; IRG, interrenal gland; and Tu, tumors in the IRG of MYCN or MYCN;ptpn11mut fish. |
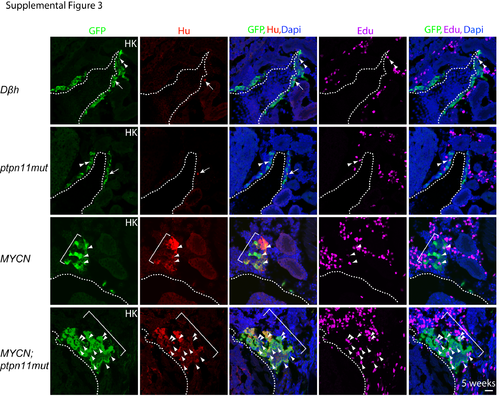
Mutant ptpn11 promotes proliferation of MYCN-induced hyperplastic neuroblasts in the interrenal gland (IRG). Related to Figure 4 Sagittal sections through the IRGs of EdU-labeled Dβh control, ptpn11mut, MYCN and MYCN;ptpn11mut transgenic fish at 5 wpf (dorsal up, anterior left). GFP, green; Hu, red; EdU, magenta; Dapi, blue. Arrows indicate Hu+GFP+Edu- neuroblastic cells in the IRG. Arrowheads indicate Hu+GFP+Edu+ neuroblasts. Double arrowheads indicate Hu-GFP+Edu+ proliferating chromaffin cells. Dotted lines outline the head kidney (HK) boundary. Scale bar, 20 μm. |
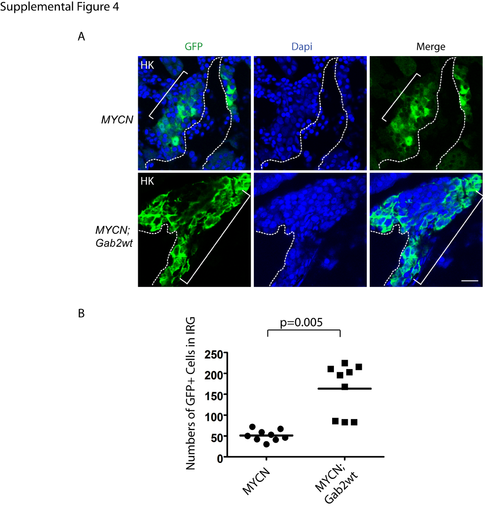
Overexpression of Gab2wt increases the number of MYCN–induced hyperplastic neuroblasts in the interrenal gland (IRG). Related to Figure 4 (A) Sagittal sections through the IRGs of MYCN and MYCN;Gab2wt transgenic fish at 5 wpf (dorsal up, anterior left). GFP, green; DAPI, blue; Merge, combined green and blue. GFP+ hyperplastic neuroblasts were indicated by brackets. Dotted lines indicate the head-kidney (HK) boundary. Wpf, weeks postfertilization. Scale bar, 20 μm. (B) Numbers of GFP+ sympathetic neuroblasts in the IRG regions of MYCN and MYCN;Gab2wt transgenic fish at 5 wpf. Mean values (horizontal bars) were compared by Welch t-test (two-tailed). GFP+ cell numbers are significantly increased in the MYCN;Gab2wt fish as compared to those in the MYCN-only fish. |
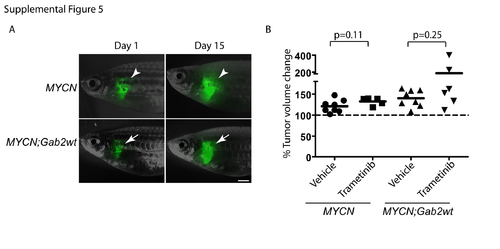
MEK inhibitor treatment does not inhibit tumor growth in MYCN;GFP or MYCN;Gab2wt transgenic fish. Related to Figure 7 (A) EGFP-expressing tumors in MYCN;GFP (arrowhead) or MYCN;Gab2wt (arrow) transgenic fish treated with trametinib at days 1 or 15 of treatment. Scale bar, 1 mm. (B) Changes in tumor volume in animals treated with trametinib on day 15 vs day 1, as measured by the size of EGFP positive tumor masses using Image J software. Mean values (horizontal bars) were compared by Welch t-test (two-tailed). |