
- Title
-
Distinct and redundant functions of Esam and VE-cadherin during vascular morphogenesis
- Authors
- Sauteur, L., Affolter, M., Belting, H.G.
- Source
- Full text @ Development
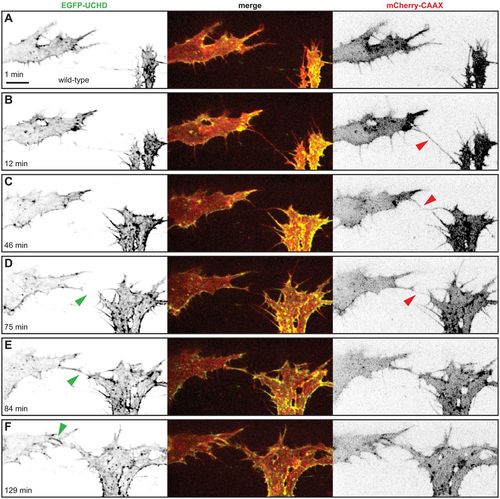
Anastomosis occurs over a single filopodial contact. (A-F) Still images from Movie 1 of a Tg(fli1ep:gal4ff)ubs3, Tg(UAS:EGFP-UCHD)ubs18, Tg(kdrl:mCherry-CAAX)s916 embryo at around 32 hpf, with anterior to the left. Single channels are shown in inversed contrast (green is EGFP-UCHD and red is mCherry-CAAX on left and right, respectively) and the merge is shown in the middle. Red arrowheads point to filopodial interactions; green arrowheads point to cell-cell bridges or a junctional ring in (F). Scale bar: 10 µm. EXPRESSION / LABELING:
|
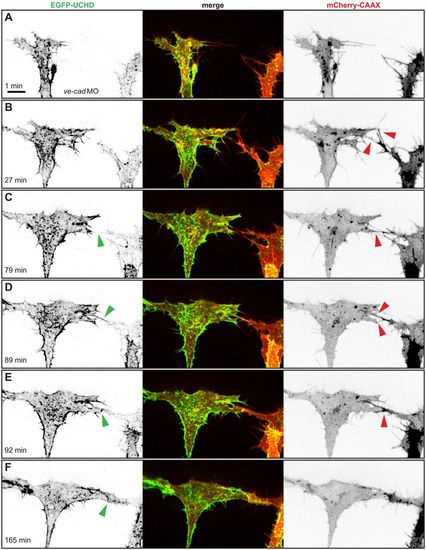
In the absence of VE-cad, several filopodial contacts are required to initiate cell-cell contact formation. (A-F) Still images from Movie 2 of a VE-cad morphant Tg(fli1ep:gal4ff)ubs3, Tg(UAS:EGFP-UCHD)ubs18, Tg(kdrl:mCherry-CAAX)s916 embryo at around 32 hpf, with anterior to the left. Single channels are shown in inversed contrast (green is EGFP-UCHD and red is mCherry-CAAX on left and right, respectively) and the merge is shown in the middle. Red arrowheads point to filopodial interactions or cell bodies touching in (E); green arrowheads point to cell-cell bridges and forming junctions in (E) and (F). Scale bar: 10 µm. |
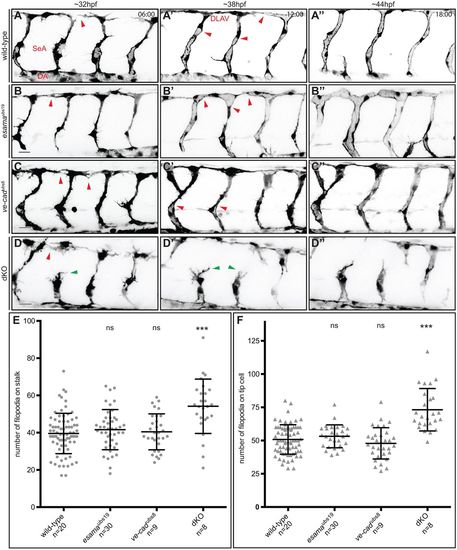
Loss of both VE-cad and Esama enhances the defects observed in ve-cadubs8 mutants. (A-D) Still images from Movie 4 (A), Movie 5 (B), Movie 6 (C) and Movie 7 (D) of Tg(fli1a:EGFP)y1 wild-type, esamaubs19, ve-cadubs8 and esamaubs19; ve-cadubs8 double mutant (dKO) embryos, respectively. Images are shown in inversed contrast at three different stages of angiogenesis: ∼32, ∼38 and ∼44 hpf. Red arrowheads at 32 hpf point to anastomotic contacts; red arrowheads at 38 hpf point to forming lumen; green arrowheads point to stalk cells that detached from the tip cell. Scale bars: 20 µm. (E and F) Quantification of filopodial protrusions on SeA stalks (E) and tip cells (F). (E) The number of filopodia on angiogenic stalks (composed of one to three ECs) is comparable between wild-type (77 SeAs in n=20 embryos), esamaubs19 (114 SeAs in n=30 embryos) and ve-cadubs8 (31 SeAs in n=9 embryos) genotypes. Significantly more filopodia were counted on dKO stalks (31 SeAs in n=8 embryos). (F) Tip cells generally generate more filopodial protrusions (average of 50 filopodia per tip cell) than stalk cells. Significantly more filopodia were counted on tip cells of dKO compared with wild type. Bars in the plots represent mean±s.d. DA, dorsal aorta; dKO, double mutant; DLAV, dorsal longitudinal anastomotic vessel; n, number of analyzed embryos; ns, not significant; SA, segmental artery. ***P<0.0001, with one-way analysis of variance (ANOVA). PHENOTYPE:
|
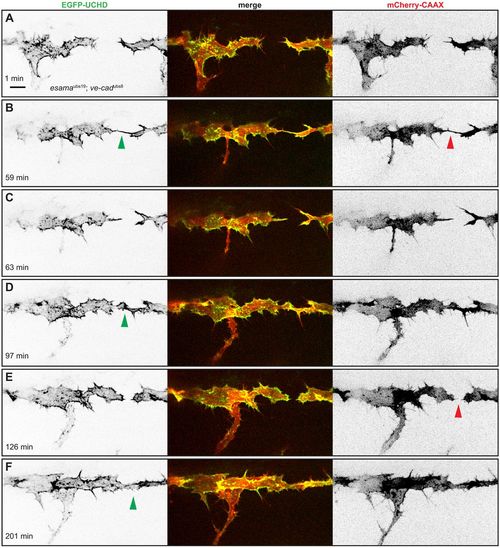
esamaubs19; ve-cadubs8 double mutant tip cells cannot maintain cell-cell contacts. (A-F) Still images from Movie 8 of an esamaubs19; ve-cadubs8 double mutant Tg(fli1ep:gal4ff)ubs3, Tg(UAS:EGFP-UCHD)ubs18, Tg(kdrl:mCherry-CAAX)s916 embryo at around 32 hpf, anterior to the left. Single channels are shown in inversed contrast (green is EGFP-UCHD and red is mCherry-CAAX on left and right, respectively) and the merge is shown in the middle. Red arrowheads point to filopodial interactions (B) or resolved contacts (E); green arrowheads point to cell-cell bridges or forming junctions in (F). Scale bar: 10 µm. PHENOTYPE:
|
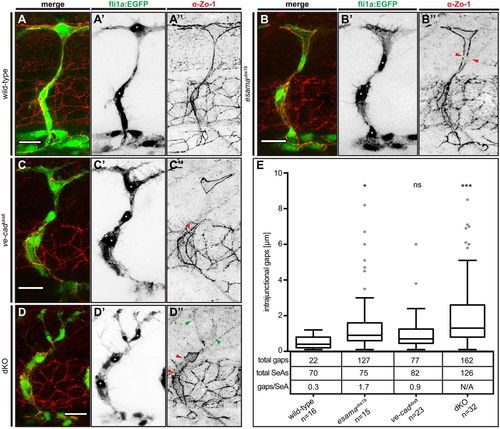
Defects in junctional continuity in the absence of Esama, which are greatly increased in double mutants. (A-D) Confocal images of SeAs of Tg(fli1a:EGFP)y1 (green) wild-type (A), esamaubs19 (B), ve-cadubs8 (C) and esamaubs19; ve-cadubs8 dKO (D) embryos stained for Zo-1 (red), around 32 hpf. Single channels are shown in inversed contrast. Red arrowheads point to intrajunctional gaps or missing junctions between the red arrowheads in (D″); green arrowheads indicate cytoplasmic localization of Zo-1. Asterisk, nucleus. Scale bars: 20 µm. (E) Intrajunctional gaps (in micrometers) measured in confocal projections of embryos stained for Zo-1 around 32 hpf. One-way analysis of variance revealed significance for esamaubs19 (P=0.0449), ve-cadubs8 (P=0.42) and double mutant (P<0.0001). Tukey boxplot shows boxes with lower quartile, median and upper quartile (Tukey whiskers). Medians are 0.4, 0.9, 0.7 and 1.3 µm for wild type, esamaubs19, ve-cadubs8 and dKO, respectively. The number of observed intrajunctional gaps (total gaps), the number of analyzed SeAs (total SeAs) and the calculated number of intrajunctional gaps per SeA (gaps/SeA) are indicated below the boxplot for every genotype. The number of intrajunctional gaps per SeA is omitted for the double mutant genotype, because strong junctional defects did not allow a quantitative analysis. dKO, double mutant; n, number of embryos analyzed; N/A, not available (omitted); SeA, segmental artery. *P<0.05; ***P<0.001. |
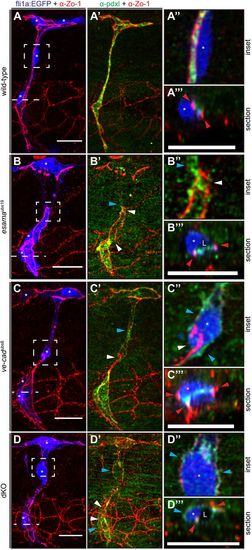
Intrajunctional gaps are correlated with defects in apical polarization. (A-D) Deconvolved projections of SeAs of Tg(fli1a:EGFP)y1 (blue) wild-type (A), esamaubs19 (B), ve-cadubs8 (C) and esamaubs19; ve-cadubs8 double mutant (dKO, D) embryos stained for Zo-1 (red) and Pdxl (green), around 32 hpf. SeAs are shown either in EGFP plus Zo-1 or in Pdxl plus Zo-1 channels, whereas insets and sections are merges of all three colors, except for (B″), where the blue channel was omitted. The panels on the right-hand side represent magnifications and cross-sections of the insets and dotted lines, respectively. Red arrowheads point to junctions; white arrowheads point to intrajunctional gaps or missing junctions between the white arrowheads in (D′); blue arrowheads point to basal localized Pdxl. L, lumen; asterisk, nucleus. Scale bars: 20 µm. |
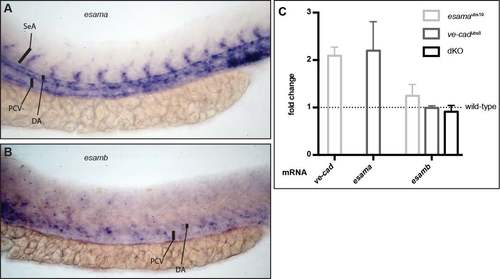
Esama is specifically expressed in the trunk vasculature In situ hybridization for esama (A) and its paralog esamb (B) expression in embryos at 28 hpf. (A) esama is expressed in the DA, PCV and the growing SeAs. (B) esamb expression appears to be very weak in the trunk vasculature. The colorimetric reaction was prolonged, but stopped to prevent too strong background. DA, dorsal aorta; SeA, segmental artery; PCV, posterior cardinal vein. (C) Quantitative RT-PCR analysis of ve-cad, esama and esamb transcripts in different mutant genotypes. mRNA levels are compared relative to wild-type embryos. Experiments were performed in 3 biological and 3 technical replicates. dKO, double mutant. EXPRESSION / LABELING:
|
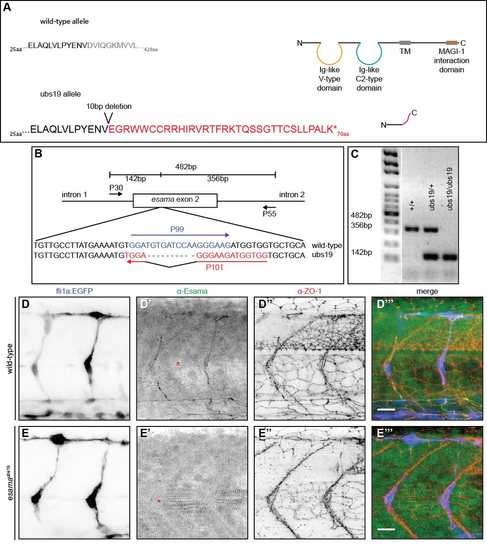
Generation and verification of an esama mutant allele (A) Schematic representation of the wild-type and esamaubs19 mutant allele. Top: the amino acid sequence of wild-type Esama (total of 428aa) flanking the region of mutagenesis and schematic drawing of wild-type Esama. Esama harbors two N-terminal extracellular Ig-like domains (one Vand one C2-type), a single transmembrane domain and a long cytoplasmic tail harboring a MAGI-1 binding domain. Bottom: the 10bp deletion leads to a frame shift, which alters Esama's sequence after the first 37aa and leads to a premature stop after a total of 70aa (altered amino acid sequence highlighted in red). This premature stop leaves only a very short peptide. (B and C) Genotyping PCR strategy (B) and examples of amplicons produced by wild-type, esamaubs19 heterozygous or homozygous mutants. (A) The external primers (P30 and P55) flank exon 2 and amplify both, mutant and wild-type alleles (482bp). This amplicon is outcompeted by the smaller wild-type and ubs19 products. P99 specifically anneals to the wild-type sequence and produces a band of 356bp with P55. P101 is specific for the mutation and together with P30 generates a 142bp product. (D and E) Confocal images of wild-type (D) and esamaubs19 (E) Tg(fli1a:EGFP)y1 (blue) embryos stained for Esama (green) and Zo-1 (red), single channels are shown in inversed contrast, anterior to the left. The architecture of SeAs looks similar between wild-type and esamaubs19 (compare the EGFP channels D and E); there are no obvious angiogenic defects in the mutant. The staining for Esama confirms the loss of protein in the mutant background (E'). Importantly, the Esama antibody recognizes epitopes in the cytosolic C-terminal portion of the protein (Sauteur et al., 2014), excluding the possibility of splice variants in the esamaubs19 mutant background. The Esama antibody shows cross-reactivity with the myotome, which remains visible in the mutant (demarcated by red asterisks in D' and E'). aa, amino acid; TM, transmembrane domain, scale bars, 20μm. |
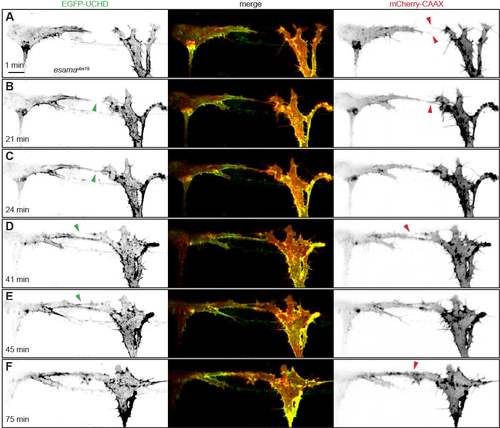
Loss of Esama does not lead to defects in anastomosis (A-F) Still images from Movie S3 of an esamaubs19 mutant Tg(fli1ep:gal4ff)ubs3, Tg(UAS:EGFPUCHD) ubs18, Tg(kdrl:mCherry-CAAX)s916 embryo at around 32hpf, anterior to the left. Single channels are shown in inversed contrast (green is EGFP-UCHD and red is mCherry-CAAX on left and right, respectively) and the merge is shown in the middle. (A) Two tip cells are extending filopodia (red arrowheads) towards each other. (B) A filopodial contact is established (red arrowhead), but actin cytoskeleton (green arrowhead) has not accumulated at the cell-cell bridge yet. (C) The cell-cell bridge is quickly stabilized with actin cytoskeleton (green arrowhead). (D and E) A second protrusion is established between the two tip cells (red arrowhead) and quickly stabilized with actin cytoskeleton (compare green arrowheads in C and D). (F) During contact maturation, the two cell-cell contact sites are fused to a single one (red arrowhead). Scale bar, 10μm. |
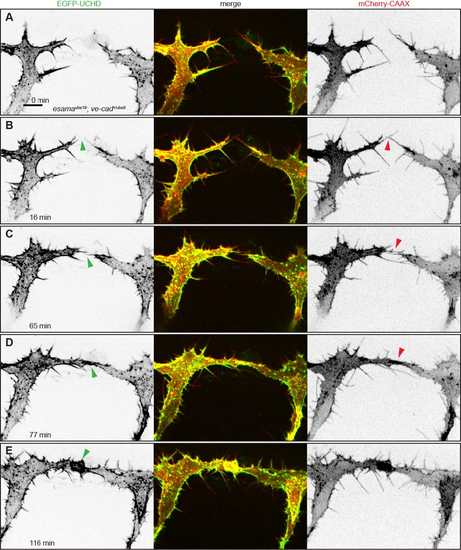
esama-/-; ve-cad+/- embryos display an intermediate filopodial phenotype. (A-F) Still images from Movie S9 of an esamaubs19; ve-cad+/ubs8 embryo. Tg(fli1ep:gal4ff)ubs3, Tg(UAS:EGFP-UCHD)ubs18, Tg(kdrl:mCherry-CAAX)s916 embryo at around 32hpf, anterior to the left. Single channels are shown in inversed contrast (green is EGFP-UCHD and red is mCherry-CAAX on left and right, respectively) and the merge is shown in the middle. (A) Two tip cells are extending filopodia towards each other. (B) Two filopodia touch (red arrowhead). (C) A filopodial contact is established (red arrowhead) and actin cytoskeleton (green arrowhead) is being recruited to the cell-cell contact site. (D) The cell-cell bridge (red arrowhead) is quickly stabilized with actin cytoskeleton (green arrowhead). (E) Anastomosis led to the formation of a junctional ring between the two tip cells (green arrowhead). Scale bar, 10μm. |
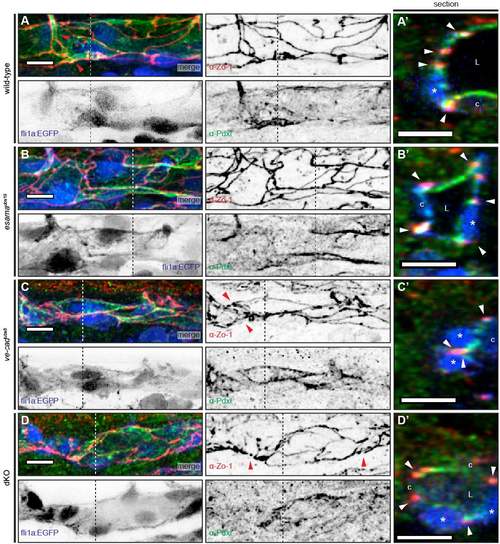
The DA appears to form normally in the absence of VE-cad and Esama (A-D) Deconvolved projections of DAs of Tg(fli1a:EGFP)y1 (blue) wt (A), esamaubs19 (B), ve-cadubs8 (C) and esamaubs19; ve-cadubs8 double mutant (dKO, D) embryos stained for Zo-1 (red) and Pdxl (green), around 32hpf. Single channels are shown in inversed contrast. (A) In wild-type embryos the DA is lumenized and the strongest signal for apical Pdxl is usually observed close to junctions (Zo-1, and see red arrowheads in A). (A') shows a cross-section through the DA. Several ECs surround the lumen (L); apical staining (green) is seen between junctions (arrowheads) and on the luminal side of ECs. (B) The DA in esamaubs19 mutant embryos forms similar to wild-type ones. (B') shows lumen (L) surrounded by several cells and also here the apical Pdxl is located between junctions (arrowheads) and on the luminal side of cells. (C) In the absence of VE-cad, the DA is lumenized only partially. Cell-cell junctions look more disorganized compared to wild-type siblings (red arrowheads in the Zo-1 panel). (C') But even in collapsed portions of the DA, apical signal (green) is observed between junctions, where lumen would be expected. Section was chosen where three cells (two nuclei and one cell body form the DA; only two junctions are observed (red arrowheads), because two junctions overlap between the two cell nuclei (n). (D) Similar to vecadubs8 mutants, the DA of dKO embryos is only partially inflated and the junctions appear disorganized (red arrowheads in the Zo-1 panel). (D') However, apical polarization appears normal with signal (green) between junctions and on the luminal (L) side of the endothelial cells. Section shows lumenized portion of the DA surrounded by 4 cells. DA, dorsal aorta; L, lumen; asterisk, nucleus; c, cell body; white arrowheads, junctions; Pdxl, Podocalyxin; cross-section is located at the dotted line; scale bars, 10μm. |

Unillustrated author statements PHENOTYPE:
|