
- Title
-
The pro-inflammatory signalling regulator Stat4 promotes vasculogenesis of great vessels derived from endothelial precursors
- Authors
- Meng, Z.Z., Liu, W., Xia, Y., Yin, H.M., Zhang, C.Y., Su, D., Yan, L.F., Gu, A.H., Zhou, Y.
- Source
- Full text @ Nat. Commun.
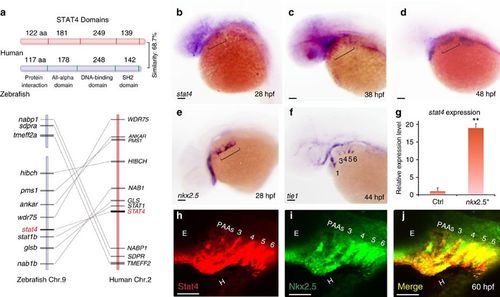
Conservation of Stat4 and its expression in nkx2.5+ PAA endothelial progenitors. (a) Schematic diagram illustrates the STAT4 protein functional domains of Human (red) and Zebrafish (blue), and synteny analysis of Stat4 loci on the human (red) and zebrafish (blue) chromosomes. The width of the lines and their distances represent the relative sizes of the genes and loci distances, respectively. (b–d) Brackets indicate that stat4 expression resides in the pharynx at 28 hpf (b), 38 hpf and 48 hpf (d) by in situ hybridization. (e) nkx2.5+ cells locate in the pharynx at 28 hpf (f) tie1+ cells at 44 hpf following the appearance of nkx2.5 pharyngeal clusters. (g) The expression level of stat4 in nkx2.5+ cells compared with somatic cells at 30 hpf from microarray data. Error bars indicate s.d., unpaired two-tailed Student’s t-test, **P=0.002 (triplicates for each group) (h,i) The immunohistochemistry staining of Stat4 (red) and Nkx2.5 (green) of wild-type embryos using anti-Stat4 and anti-Nkx2.5 antibodies at 60 hpf. (j) Co-localization of Stat4 and Nkx2.5 protein analysis by the merged image (yellow). Scale bars, 50 μm. n≥20 embryos per group for in situ, n=12 embryos per group for immunohistochemistry; hpf, hours post-fertilization. EXPRESSION / LABELING:
|
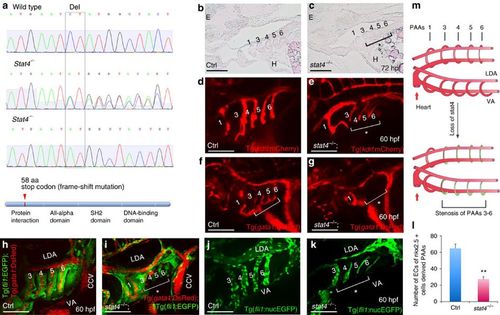
Loss of stat4 leads to stenosis of PAAs 3–6. (a) Genomic sequences of wild-type zebrafish, stat4 heterozygous mutants and homozygous mutants. The stat4 mutant has a two-base pair deletion, which causes a frame-shift mutation and a premature stop codon to form a truncated protein with 58 amino acids. (b,c) Pathological sections (10 μm per section) of wild-type and mutant embryos with Haematoxylin-Eosin staining at 72 hpf (n=12). (d,e) Confocal images of PAAs in the control Tg(kdrl:mCherry) embryos and the stat4−/−;Tg(kdrl:mCherry) line (n=9). (f,g) Images of PAAs 3–6 vessels trafficking blood flow in the control and stat4−/−;Tg(gata1:DsRed) embryos (n=9). (h,i) Images of PAAs trafficking blood flow in the control and the stat4−/−;Tg(fli1:EGFP);Tg(gata1:DsRed) line (n=8). (j–l) Control and the stat4−/−;Tg(fli1:nucEGFP) embryos show PAA endothelial cells (green) with cell number counts at 60 hpf (n=9). Error bars indicate s.d., unpaired two-tailed Student’s t-test, **P=0.003. (m) The model of PAAs 3–6 phenotype caused by stat4 deficiency is illustrated in the cartoon. Scale bars, 50 μm. LDA, lateral dorsal aorta; VA, ventral aorta; E, eye; H, heart. The brackets with asterisks highlight the malformed individual PAAs. EXPRESSION / LABELING:
PHENOTYPE:
|
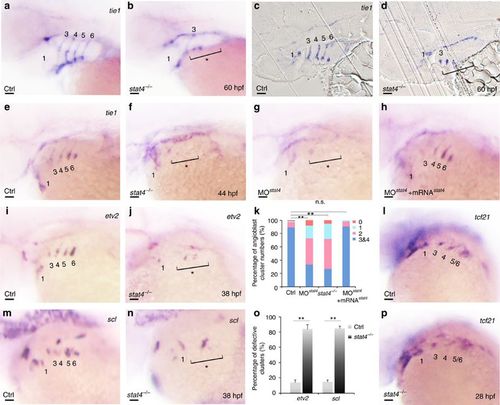
Lack of stat4 represses emergence of PAA angioblasts. (a,b) tie1 transcripts expressing PAAs are visualized in the control and stat4 mutants at 60 hpf. (c,d) Resin sections (10 μm per section) of wild-type and stat4 mutant embryos with tie1 in situ hybridization at 60 hpf. (e–h) Analysis of tie1 expression in pharyngeal angioblastic cords is conducted in the control embryos (e), stat4 mutants (f), stat4 morphant embryos (g) and embryos with stat4 mRNA and stat4 morpholino injection (h) at 44 hpf by in situ hybridization. (k) Proportional quantification of embryos with defective PAA angioblast cords in tie1 staining assays, Kruskal–Wallis test with the Dunn’s multiple comparison test, **P<0.01, n.s.: P>0.05. (i,j,m,n) The etv2 and scl transcripts are evaluated by in situ hybridization in the control and stat4 mutants at 38 hpf. (o) Percentage of embryos with defective PAA angioblastic cords in etv2 and scl staining assays, error bars indicate the s.d., Kruskal–Wallis test, **P=0.0058, n=30 per each group. (l,p) tcf21+ PAAs are visualized in the control and stat4 mutants at 28 hpf. Scale bars, 50 μm. a–d, n=23 embryos in each group; e–h, n=32 embryos in each group; l,p, n=26 embryos per group. EXPRESSION / LABELING:
PHENOTYPE:
|
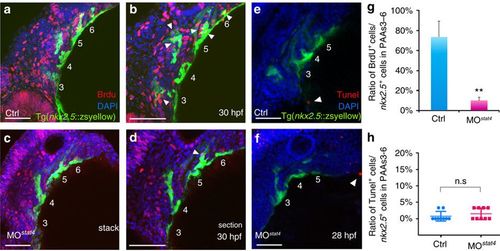
Lack of stat4 inhibited proliferation of nkx2.5 PAA progenitors but not apoptosis. (a–d) The control (a,b) and stat4 morphant (c,d) Tg(nkx2.5:ZsYellow) embryos at 30 hpf are stained by BrdU (red), 4’,6-diamidino-2-phenylindole (DAPI) (blue) as well as immunohistochemistry for ZsYellow (yellow). The single confocal sections are shown in b,d. (e,f) Projections of the pharyngeal arch region of 28 hpf control (e) and stat4 morphant (f) Tg(nkx2.5:ZsYellow) embryos are assayed for TUNEL (red) and pharyngeal arch arteries for ZsYellow (yellow). (g) Ratios of BrdU+ cells/the nkx2.5+ cells in PAAs 3–6 region across three experimental replicates (n=6 embryos/replicate in each group); Error bars indicate the s.d. Kruskal–Wallis test, **P=0.0036. (h) Ratios of TUNEL+ cells/the nkx2.5+ cells in PAAs 3–6 region, n=9 per each group, n.s.: P>0.05. White arrowheads indicate BrdU+ or TUNEL+ cells. Scale bars, 50 μm. EXPRESSION / LABELING:
PHENOTYPE:
|
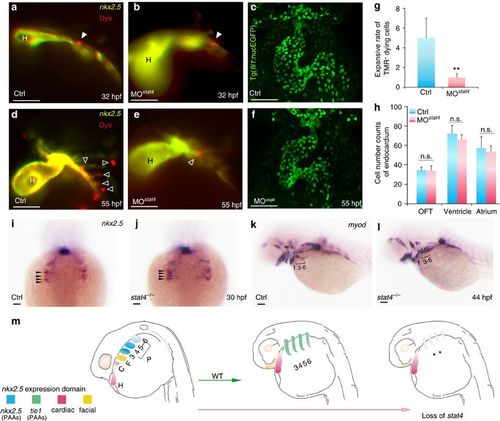
Cell tracing of endothelial precursors. (a,b,d,e) The control (a,d) and stat4 morphant (b,e) Tg(nkx2.5:ZsYellow) embryos injected with CellTracker Red (white arrowheads) in the non-heart ZsYellow region at 28 hpf are imaged at 32 hpf (a,b) and again at 55 hpf (d,e). The hollow arrowheads indicate the labelled cells. (c,f) Confocal Z-stacks captured fli1+ endothelial cells in the heart region at 55 hpf in the control (c) and stat4 morphants (f), respectively. (g) Quantification of TMR+ cells (n=12 per each group, Error bars indicate the s.d. Kruskal–Wallis test, **P=0.003). (h) Quantification of green endothelial cells at 55 hpf across three experimental replicates (n=6 embryos/replicate in each group. Analysis of variance (ANOVA) test with multiple comparison post-hoc test, P=0.9999 no significant (n.s.) difference in the outflow tract (OFT), P=0.6866 (n.s.) in the ventricle, P=0.9878 (n.s.) in the atrium between the control and stat4 morphants. (i,j) Morphogenesis of the four pairs of nkx2.5+ pharyngeal clusters between the wild-type control and stat4 mutants at 30 hpf (indicated by black arrows). (k,l) The myod transcripts expressing PAAs are visualized in the control and stat4 mutants at 44 hpf. (m) The schematic illustration shows the fate of nkx2.5+ cells in ALPM in wild-type (WT) and loss of stat4 embryos at 28 and 55 hpf. The first pair gives rise to the facial lineage, and 2 to 4 pairs had endothelial fate. ALPM nkx2.5+ clusters (H,C,F, PAAs 3–6). Blue: nkx2.5 expressing cells, Green: tie1 expressing cells, Red: cardiac lineage and Yellow: facial lineage. C: cardiac, F: facial, H: heart. Scale bars, 50 μm. n≥30 embryos per each group in i–l. |
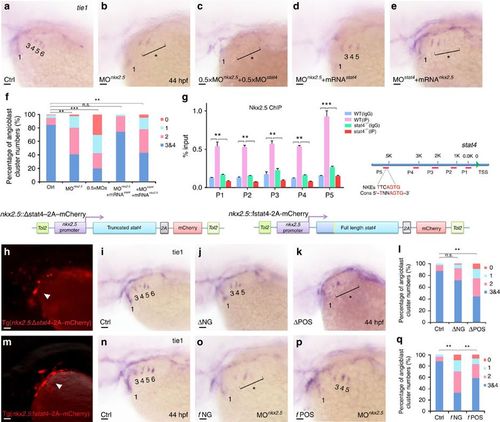
Cell-autonomous requirement of Stat4 downstream of Nkx2.5. (a–e) In situ hybridization analysis of tie1 transcripts in the control (a), nkx2.5 morphant embryos (b), embryos with half doses of nkx2.5 and stat4 morpholinos (c), nkx2.5 morphants with stat4 mRNA (d) and stat4 morphants with nkx2.5 mRNA (e). (f) Proportional quantification of embryos with defective angioblastic cords, Kruskal–Wallis test with the Dunn’s multiple comparison test, **P<0.01, ***P<0.001, n.s.: P>0.05, n≥30 per each group. (g) The ChIP analysis with anti-Nkx2.5 antibody for the promoter regions of stat4 in the wild-type and stat4 mutants at 44 hpf across six experimental replicates (n=30 embryos/replicate in each group, Kruskal–Wallis test with the Dunn’s multiple comparison test, **P<0.01, ***P<0.001). The binding enrichment region at the stat4 locus is indicated by primers (P1–P5). The minimal DNA-binding consensus (Cons) for Nkx2.5 contains a 5'-TNNAGTG-3' sequence motif. (h,m) Cellular autonomous analysis of stat4 is carried out by utilizing an nkx2.5 promoter to generate chimeric embryos with transient truncated (Δ) and full-length (f) stat4 gene expression in nkx2.5+ cells. The schematic diagram shows tol2-mediated transient transgenesis of nkx2.5 promoting mCherry expression. (h) Specific mCherry fluorescence expresses as pharyngeal clusters in the transgenic embryos with nkx2.5 promoter driving variant N-terminal 51 amino-acids residues truncated zebrafish stat4. (m) Exclusive mCherry fluorescence in the pharynx is observed in the transgenic nkx2.5 promoter driving full-length wild-type form of zebrafish stat4 in nkx2.5 morphants embryos. (i–k) tie1+ PAA angioblastic cords are appraised by in situ hybridization in the controls (i), negative mCherry fluorescence expressing embryos (ΔNG) (j) and positive mCherry fluorescent embryos (ΔPOS). (l) Proportional quantification data. Kruskal–Wallis test with the Dunn’s multiple comparison test, **P<0.01, n.s.: P>0.05, n≥30 per each group. (n–p) The control (n), negative mCherry fluorescence expressing embryos with nkx2.5 MO (fNG) (o) and positive mCherry fluorescence expressing embryos with nkx2.5 MO (fPOS) (p). (q) Proportional quantification data, Kruskal–Wallis test with the Dunn’s multiple comparison test, **P<0.01, n≥30 per each group. Scale bars, 50 μm. |
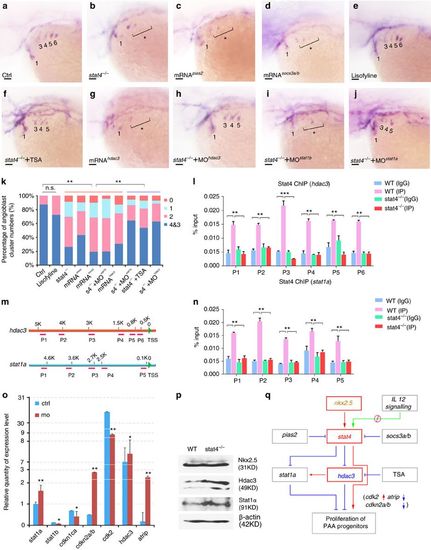
stat4 promoted the PAA angioblast programme by suppressing stat1a and hdac3. (a–k) In situ hybridization analysis of tie1 transcripts in the control (a), stat4 mutants (b), embryos with 50 ng μl−1 pias2 mRNA injection (c), embryos with 50 ng μl−1 socs3a and socs3b mRNAs injection (d), embryos treated with 85 μM lisofylline (e), stat4 mutants with 0.2 μM TSA treatment (f), embryos with 50 ng μl−1 hdac3 mRNA injection (g), stat4 mutants with 4 ng μl−1 hdac3 morpholino (h), stat4 mutants with 4 ng μl−1 stat1b morpholino (i), stat4 mutants with 4 ng μl−1 stat1a morpholino (j) at 44 hpf. Scale bars, 50 μm. (k) Proportional quantification of indicated tie1+ expressing cords number (s4−/−: stat4 mutants), Kruskal–Wallis test with the Dunn’s multiple comparison test, **P<0.01, n.s.: P>0.05, n ≥30 embryos per each group. (l–n) The ChIP analysis with anti-Stat4 antibody for the promoter regions of hdac3 and stat1a in the wild-type control and stat4 mutants at 44 hpf across six experimental replicates (n=30 embryos/replicate in each group, analysis of variance (ANOVA) test with multiple comparison post-hoc test, **P<0.01, ***P<0.001). (m) The binding enrichment regions at the hdac3 and stat1a locus are indicated by primers (P1–P6). (o) Q-PCR results of related genes expression in the control and stat4 morphants at 44 hpf across six experimental replicates (n=10 embryos/replicate in each group. Error bars indicate s.d., unpaired two-tailed Student’s t-test, *P<0.05, **P<0.01. (p) Protein levels of Nkx2.5, Hdac3 and Stat1a in the wild-type control and stat4 mutants detected by western blots at 44 hpf. β-actin is used as the internal control. (q) A network is drawn to illustrate the stat4 pathway in controlling PAA proliferation. Red: activation, Blue: suppression. |