
- Title
-
The Physical Basis of Coordinated Tissue Spreading in Zebrafish Gastrulation
- Authors
- Morita, H., Grigolon, S., Bock, M., Krens, S.F., Salbreux, G., Heisenberg, C.P.
- Source
- Full text @ Dev. Cell
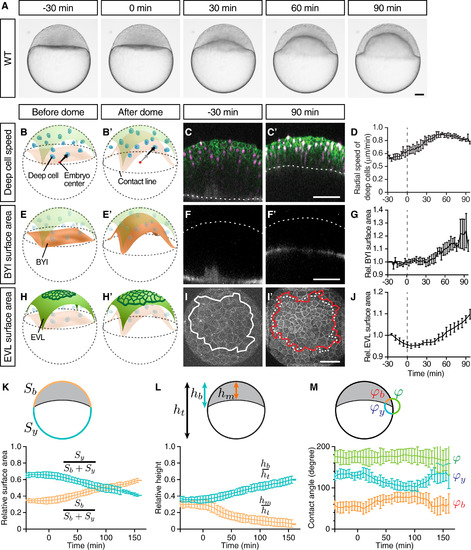
Doming Is Associated with EVL Cell Expansion and Radial Deep Cell Intercalations (A) Bright-field images of a zebrafish WT embryo at sequential stages from the pre-doming stage (−30 min) to the end of doming (+90 min). (B, B′, E, E′, H, and H′) Schematic representation of a zebrafish embryo before and after doming illustrating deep cell radial movement (B) and (B′), BYI upward bulging (E) and (E′), and EVL expansion (H) and (H′). BYI, blastoderm-to-yolk cell interface. Arrows, radial movement of deep cells. (C, C′, F, F′, I, and I′) Confocal images of the blastoderm before the onset (−30 min) and after completion of doming (+90 min) where membrane, green in (C) and (C′) and white in (I) and (I′); nuclei, magenta in (C) and (C′); and BYI, white in (F) and (F′) were labeled by membrane-targeted GFP (mem-GFP), H2A-mCherry, and fluorescent dextran, respectively. Dashed lines mark the BYI in (C) and (C′) or outer surface of the blastoderm in (F) and (F′). Solid lines in (I) and (I′) outline measured surface area, and dashed line in (I′) marks the measured surface area at −30 min (I). (D) Average deep cell speed along the radial direction of the embryo plotted as a function of time during doming. (G) Relative BYI surface area measured within the observed region of the embryo and plotted as a function of time during doming. (J) Relative EVL surface area measured for a continuous patch of cells within the observed region of the embryo and plotted as a function of time during doming. (K–M) Geometrical parameters of WT embryos during doming with relative surface area (K) (Sb, entire blastoderm surface area; Sy, entire yolk surface area), relative height (L) (hb, height of the blastoderm between animal pole and contact line; hm, height of the blastoderm at the center of the embryo; ht, total height of the embryo) and contact angles (M) (φb, angle between EVL and BYI; φy, angle between BYI and yolk membrane; φ, angle between yolk membrane and EVL) quantified from bright-field embryo images. n = 6 embryos. Error bars, ±SEM (D), (G), and (J) and ±SD (K–M). Scale bars, 100 μm. Time point 0 min always indicates the beginning of doming recognizable by an upward bulging of the BYI. Embryo images are lateral views with the animal pole up unless otherwise stated. (I) and (I′) are animal pole views. See also Figure S1 and Movie S1. |
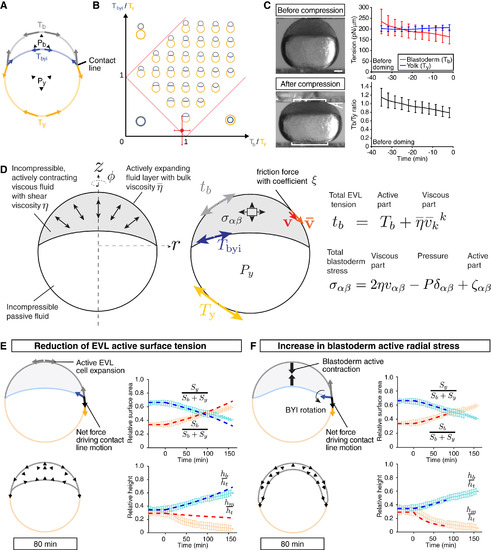
Physical Description of Doming Based on Changes in Blastoderm Surface Tension and Radial Stress (A) Schematic of the surface tension model for describing embryo shapes at the onset of doming. The ratio of volumes of blastoderm and yolk is fixed, and the blastoderm, yolk, and BYI interfaces are subjected to surface tensions. (B) Phase diagram of equilibrium shapes predicted by the surface tension model of the embryo as a function of the surface tension ratios Tb/Ty and Tbyi/Ty. Red dot, predicted ratio of surface tensions before doming from analysis of embryo shape. (C) Measurement of blastoderm (Tb) and yolk cell surface tension (Ty) in WT embryos at the onset of doming using tissue tensiometry. Embryos were compressed by 20% of their initial uncompressed height. Panels on the left are bright-field images of a WT embryo before (top) and after compression (bottom). Brackets, contact areas. Kinked line, contact angle. Panels on the right show Tb and Ty (top) and Tb/Ty (bottom) as a function of time after compression. n = 4 embryos. Error bars, ±SD. Scale bar, 100 μm. (D) Schematic of the dynamic model of doming. The blastoderm is represented by an incompressible viscous fluid with shear viscosity η, subjected to an anisotropic, radially oriented active internal stress with magnitude ζ. The EVL is represented by a compressible fluid with bulk surface viscosity (E and F) Two hypothetical scenarios for doming where either EVL surface tension reduction results in an imbalance of forces at the contact line, driving EVL surface expansion (E) or active radial contraction of the deep cell layer drives blastoderm thinning (F). In (F) blastoderm deformation leads to a rotation of the BYI tangent vector at the contact line, resulting in a net force at the contact line driving EVL surface expansion. Left panels in (E) and (F) are schematic representations of the different mechanisms on which the simulations are based on and the simulated embryos shapes at 80 min of doming. Black arrows outline blastoderm velocity field. Right panels in (E) and (F) are plots of embryo surface area and height as a function of time during doming with pale blue and red curves showing the experimental measurements, and dashed red and blue thick lines showing simulation results. Simulations parameters are specified in Table S1C. Simulations in (F) were stopped when the angle between the EVL and the YSL approached a zero value. Error bars, ±SD. See also Figure S2 and Movie S2. |
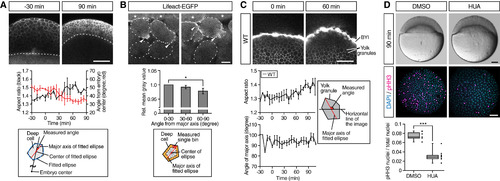
Deep Cells and Yolk Granules Change Their Shape during Doming (A) Deep cell shape changes in WT embryos. Upper panels are single plane confocal images of deep cells close to the EVL before (−30 min) and after completion of doming (+90 min). Deep cell plasma membrane was labeled by mem-RFP. Dotted lines, BYI position. Middle panel shows quantification of deep cell aspect ratio (black line, left vertical axis) and angle from embryo center (red line, right vertical axis) of deep cells in embryos from −30 to +90 min of doming. Bottom panel shows schematic of deep cell angle measurements. n = 3 embryos. Error bars, ±SEM. Scale bar, 100 μm. (B) Subcellular localization of actin in deep cells during doming. Upper panels are single plane confocal images of deep cells close to the EVL in Tg(actb1:lifeact-EGFP) embryos during doming. Dotted lines, plasma membrane of individual cells. Asterisks, EVL cells. Arrowheads, polarized actin localization in deep cells. Middle panel shows quantification of actin distribution in polarized deep cells (aspect ratio ≥1.6) during 90 min of doming. Bottom panel shows schematic of the actin distribution analysis in deep cells within an area ≈3 μm away from the plasma membrane (orange) and subdivided in 30° bins relative to the major axis of the fitted ellipse (red). n = 3 embryos. Error bars, ±SEM; ∗p < 0.05; t test. Scale bar, 10 μm. (C) Yolk granule shape in intact WT embryos. Upper panels are single plane confocal images of yolk granules in embryos injected with fluorescent dextran into the yolk at 0 min (left) and +60 min (right) of doming. Lower left panels are quantification of yolk granule aspect ratio (top) and angle of major axis (bottom) from −30 to +108 min of doming. Lower right panel shows schematic of measured angle in yolk granules. n = 4 embryos. Error bars, ±SEM. Scale bar, 100 μm. (D) Doming in WT embryos and embryos treated with hydroxyurea and aphidicolin (HUA) to block cell divisions. Upper panels are bright-field images of control (left) and HUA-treated embryos (right) after completion of doming (+90 min). Lower panels are confocal images of control (left) and HUA-treated embryos (right) immunostained for the mitotic marker phosphorylated histone H3 (pHH3; magenta) at the onset of doming (0 min) from animal pole view. All nuclei were labeled by DAPI (cyan). Lower left plot shows ratio of pHH3-positive nuclei to total nuclei number. Boxplots represent 25%, median, 75%, and 95%. ∗∗∗p < 0.001; t test. n = 7 embryos (DMSO) and 10 embryos (HUA). Scale bar, 100 μm. See also Figure S2 and Movie S3. |
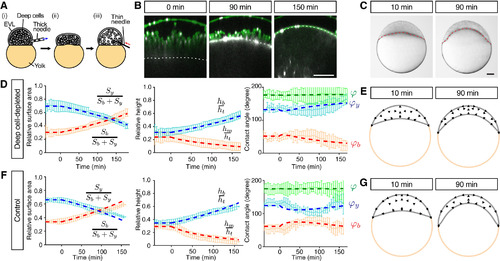
Radial Cell Intercalations Are Dispensable for Blastoderm Spreading but Required for Blastoderm Thinning during Doming (A) Schematic of the deep cell-depletion experiment. (1) Deep cells were removed with a thick needle, (2) the removal reduced blastoderm volume, and (3) the blastoderm volume was restored to its original size by injection of embryo medium. (B) Single-plane confocal images of deep cell-depleted WT embryos before (−30 min) and after completion of doming (+90 and +150 min). Plasma membrane was marked by mem-GFP in green. Nuclei were marked by H2A-mCherry in magenta. BYI was marked by dextran in white. (C) Bright-field images of deep cell-depleted embryo at the onset (+10 min) and after doming (+90 min). (D–G) Comparison of experimentally measured embryo shape changes with simulation results adjusted to reproduce experimental observations of deep cell-depleted embryos (D) and (E) and intact WT embryos (F) and (G) during doming. Simulation parameters are listed in Table S1C. Left plots are comparison of embryo surface area, height and contact angle with pale blue and red curves showing the experimental measurements, and dashed red and blue thick lines showing the simulation results. Right panels show simulated embryo shapes at 10 and 90 min of doming with black arrows marking the blastoderm velocity field. The experimental data in (F) were taken from Figures 1K–1M. n = 5 embryos (deep cell-depleted) and 6 embryos (control). Error bars, ±SD. Scale bars, 100 μm. See also Figures S3 and S4; Movie S4. |
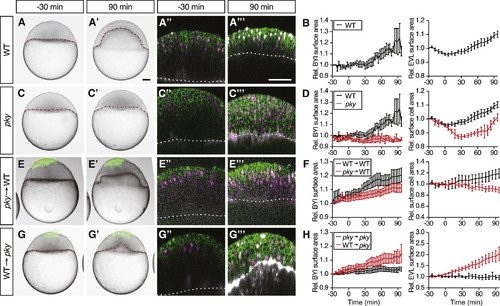
Reduction in Blastoderm Surface Tension Is Required and Sufficient to Trigger Doming (A–H) Intact WT (n = 6 embryos) (A) and (B) and pky embryos (n = 3 embryos) (C) and (D) and embryos where EVL/surface cells were transplanted from pky to WT embryos (E) and (F) (n = 10 embryos) and from WT to pky embryos (G) and (H) (n = 9 embryos). Bright-field images of mosaic embryos before (−30 min) and after completion of doming (+90 min) with transplanted cells marked by fluorescent dextran; green (A), (A′), (C), (C′), (E), (E′), (G), and (G′). Confocal images with plasma membrane expressing mem-GFP (green), nuclei marked by H2A-mCherry (magenta) and BYI outlined by fluorescent dextran (white); (A″), (A‴), (C″), (C‴), (E″), (E‴), (G″), and (G‴). Transplanted cells were marked by fluorescent dextran; green (E), (E′), (G), and (G′), or H2B-GFP; green (E″), (E‴), (G″), and (G‴). Red and white dashed lines, BYI. Changes in relative BYI area (left column) and relative EVL/surface cell area (middle column) as a function of time during doming in the different transplantation experiments (B), (D), (F), and (H). Note that the results from control experiments (WT into WT [n = 3 embryos] and pky into pky [n = 3 embryos]) were included in the plots as reference (F) and (H), see also Figures S5D–S5G, and that changes in relative EVL area in the transplantation experiments were determined exclusively in the region of the blastoderm where the transplanted cells were located. The WT data in (B) and (D) is the same as Figures 1G and 1J. Error bars, ±SEM. Scale bars, 100 μm. See also Figures S5 and S6; Movie S5. |
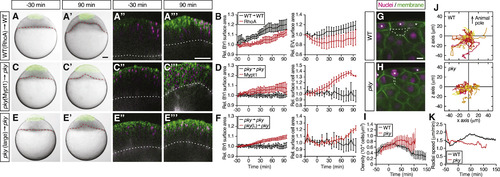
Surface Cell Expansion Reduces Deep Cell Density and Increases Deep Cell Motility (A–F) Transplantation of EVL/surface cells from RhoA-overexpressing WT to WT embryos (A) and (B) (n = 3 embryos), Mypt1-overexpressing pky to pky embryos (C) and (D) (n = 3 embryos), and of large patches of pky surface cells replacing a smaller patch of surface cells in pky embryos (E) and (F) (n = 3 embryos). Bright-field images of mosaic embryos before (−30 min) and after completion of doming (+90 min) with transplanted cells marked by fluorescent dextran; green (A), (A′), (C), (C′), (E), and (E′). Confocal images with plasma membrane expressing mem-GFP (green), nuclei marked by H2A-mCherry (magenta) and BYI outlined by fluorescent dextran (white); (A″), (A‴), (C″), (C‴), (E″), and (E‴). Transplanted cells were marked by fluorescent dextran; green (A), (A′), (C), (C′), (E), and (E′), or H2B-GFP; green (A″), (A‴), (C″), (C‴), (E″), and (E‴). Red and white dashed lines, BYI. Changes in relative BYI area (left column) and relative EVL/surface cell area (right column) as a function of time during doming in the different transplantation experiments (B), (D), and (F). The control data in (B), (D), and (F) were taken from Figures 5F and 5H. Error bars, ±SEM. Scale bars, 100 μm. (G–I) Exemplary confocal images of deep cell clustering below EVL/surface cells at the onset of doming in WT (G) and pky embryos (H). Space between deep cells is marked by a dashed line. Asterisks, EVL/surface cells. Plasma membrane was labeled by mem-GFP (green) and nuclei by H2A-mCherry (magenta). Density of deep cell nuclei in WT and pky mutant embryos was quantified within an area of ∼50 μm below EVL/surface cells as a function of time during doming (I). Scale bars, 10 μm. Error bars, ± SEM, n = 6 embryos for WT and pky each. (J and K) Exemplary trajectories of deep cell movements beneath EVL/surface cells. Nuclei of deep cells within and area of ∼60 μm below EVL/surface cells were tracked in WT (top, n = 57 cells) and pky embryos (bottom, n = 35 cells) for 100 min from the onset of doming and plotted from the origin (J). The z axis corresponds to the animal-vegetal axis of the embryo with animal pole up. Radial speed of deep cells in WT and pky mutant embryos within an area of ∼50 μm below EVL/surface cells (K). Error bars, ±SEM, n = 6 embryos for WT and pky each. See also Movie S5. |
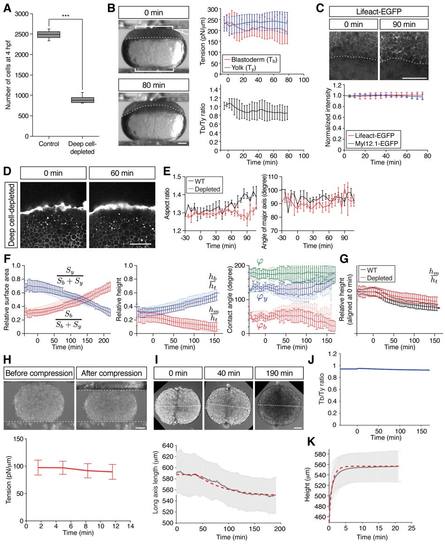
Characterization of Deep Cell-Depleted Embryos and Tissue Explants, Related to Figure 4 (A) Number of deep cells in WT control and deep cell-depleted embryos. Confocal images of sphere stage (4 hpf) embryos with nuclei marked by H2A-mCherry expression at the center of the embryo (400×400×300 μm volume) were used to count deep cells. Box plots represent 5%, 25%, median, 75% and 95%. ***P < 0.001 (t-test). n embryos = 3 (control) and 5 (deep cell-depleted). (B) Measurement of blastoderm (Tb) and yolk cell surface tension (Ty) in deep cell-depleted WT embryos during the course of doming using tissue tensiometry. Embryos were compressed by 20% of their initial uncompressed height. Panels on the left are bright-field images of a deep cell-depleted embryo before (0 min; top) and after doming (+80 min; bottom). Brackets, contact areas. Kinked line, contact angle. Dashed lines, BYI. Panels on the right show quantification of Tb (top, red line) and Ty (top, blue line) and Tb/Ty (bottom, black line) as a function of time after compression. n embryos = 7. Error bars, ± s.d. Scale bar, 100 μm. (C) Actin and myosin II localization at the BYI. Two-photon microscopy sections of the BYI region at ~100 μm depth from the surface of a Tg(actb1:Lifeact-EGFP) embryo at the onset (upper left) and end (upper right) of doming. Animal pole is up. EGFP signal intensity within a ~100 μm region of the YSL below the BYI of Tg(actb1:Lifeact-EGFP) (red line) and Tg(actb1:Myl12.1-EGFP) (blue line) embryos were quantified during doming and normalized by the signal intensity at 0 min (bottom). n embryos = 12 (Lifeact-EGFP) and 6 (Myl12.1-EGFP). Dotted lines, BYI. Error bars, ± s.d. Scale bar, 100 μm. (D) Yolk granule shape in deep cell-depleted WT embryos. Single plane confocal images of yolk granules in a deep cell-depleted embryo injected with fluorescent dextran into the yolk at 0 min (left) and +60 min (right) of doming. Scale bar, 100 μm. (E) Quantification of yolk granule aspect ratio (left) and angle of major axis (right) from -30 to +108 min of doming in intact WT (black) and deep cell-depleted embryos. n embryos = 4 (intact) and 6 (deep celldepleted). Error bars, ± s.e.m. (F) Comparison of WT control with deep cell-depleted embryo shapes (surface area, height and contact angles) during doming. Pale red and blue lines show WT control embryos, and dark red and blue lines deep cell-depleted embryos. n embryos = 6 (control) and 5 (deep cell-depleted). Error bars, ± s.d. (G) Comparison of relative blastoderm height in WT (black line) and deep cell-depleted (red line) embryos during doming. The relative height data were taken from the middle panel of Figure S3F (hm/ht) and aligned at the onset of doming (0 min) to better illustrate subsequent changes between WT and deep cell-depleted embryos during the course of doming. Error bars, ± s.d. (H) Measurement of surface tension of blastoderm explants. Fused blastoderm explants were compressed by 20% of their initial uncompressed height. Upper panels show the explant before (upper left) and after (upper right) compression. Dotted lines, surface position of the upper and lower plates. Lower panel is the quantification of the surface tension of the explants. t = 0 min corresponds to the onset of doming in unperturbed control embryos. n = 4. Error bars, ± s.d. Scale bar, 100 μm. (I) Fusion of blastoderm explants. Two blastoderm explants consisting of EVL and deep cells were removed from 1k-cell stage embryos (3 hpf) and put into contact with each other. Changes in the length of the longest axis of the fused explants were monitored as a function of time during fusion. Upper panels are still images from a time-lapse movie of fusing explants. Dotted lines, measured long axis length. Lower panel shows the quantification of the long axis length, in which pale grey lines show experimental results, while dashed thick red lines show the outcome of simulations of this process using a sphere relaxing to its equilibrium shape after equatorial deformation as a proxy for the fusion process (see also Methods S1). The first ~ 40 min have not been taken into account in the fitting procedure in order to avoid artifacts due to wound healing at early stages of explant fusion. The values of the viscosities of deep cell layer and EVL used for the simulation are specified in Table S1C. t = 0 min corresponds to about 20-30 min later after the onset of fusion. n explants = 9. Error bars, ± s.d. Scale bar, 100 μm. (J) Calculated ratio of blastoderm to yolk total surface tension in simulations of deep-cell depleted embryos. (K) Experimental measurements and simulations of yolk cell relaxation after compression to determine yolk cell viscosity. Yolk explants were obtained from embryos at the 256- and 512-cell stages (2.5 - 2.75 hpf) and compressed when unperturbed control embryos had reached the onset of doming. After 30 min of compression, the upper plate was removed and the relaxation of the yolk explant height was measured. Pale gray line represents the experimental results and red dashed line shows the outcome of the simulations of this process. The value of yolk cell viscosity used to fit the simulations to the experimental results = 40 Pa s. n explants = 17. Error bars, ± s.d. |
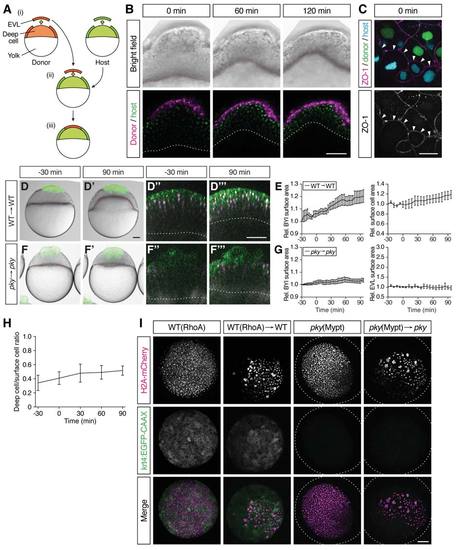
Characterization of Embryo Shapes and Surface Cell Differentiation in the Transplantation Experiments, Related to Figure 5 (A) Schematic of the procedure of EVL/surface cell transplantations. Donor and host embryos are labeled with fluorescent proteins or dyes of different color. ≈ 70 EVL/surface cells are taken from the donor embryo and nearly the same number of EVL/surface cells was removed from the host embryo (i); donor EVL/surface cells are placed on the surface-cell free area of the host embryo (ii and iii). (B) Bright-field (upper row) and confocal microscopy images (bottom row) of a WT embryo containing transplanted cells from a WT donor embryo at the onset (0 min), middle (60 min) and end of doming (120 min). There are only very few deep cells from the donor embryo compared with the number of transplanted EVL cells. The plasma membrane and nuclei of the transplanted EVL cells are marked by mem-RFP (magenta) and H2A-mCherry (magenta), respectively. The plasma membrane and nuclei of the host cells were marked with mem-GFP (green) and H2B-GFP (green), respectively. Red and white dotted lines, BYI. Scale bar, 100 μm. (C) Tight junction formation, marked by the localization of the tight junction component ZO-1, between transplanted WT donor cells and pky mutant host cells (n embryos = 11). ZO-1 (white) is localized to the interface between donor (green nuclei; WT) and host cells (cyan nuclei; pky) indicative of tight junction formation at the interface between these cells. Scale bar, 20 μm. (D-G) Embryos where EVL/surface cells were transplanted from WT to WT embryos (D-E) (n embryos = 3) and from pky to pky embryos (F-G) (n embryos = 3). Bright-field images of mosaic embryos before (-30 min) and after completion of doming (+90 min) with transplanted cells marked by fluorescent dextran (green; D, D', F and F'). Confocal images with plasma membrane expressing mem-GFP (green), nuclei marked by H2AmCherry (magenta) and BYI outlined by fluorescent dextran (white; D'', D''', F'' and F'''). Transplanted cells were marked by fluorescent dextran (green; D, D', F and F') or H2B-GFP (green; D'', D''', F'' and F'''). Red and white dashed lines, BYI. Changes in relative BYI area (left column) and relative EVL/surface cell area (right column) as a function of time during doming in the different transplantation experiments (E and G). Error bars, ± s.e.m. Scale bars, 100 μm. (H) Ratio of deep-to-surface cells for transplanted RhoA-overexpressing cells as a function of time during doming (n embryos = 4). t = 0 min corresponds to the onset of doming. Error bars, ± s.e.m. (I) EVL differentiation in RhoA- or Mypt1-overexpressing embryos. RhoA-overexpressing WT EVL cells in intact (top row) and transplanted (second row from top) embryos expressing the EVL-differentiation marker krt4:EGFP-CAAX. Mypt1-overexpressing pky cells in intact (third row from top) and transplanted embryos (bottom row) do not show krt4:EGFP-CAAX expression. H2A-mCherry mRNA was co-injected with RhoA or mypt1 mRNA into one-cell stage embryo to mark the injected cells. Dotted lines, embryo outline. Scale bar, 100 μm. |
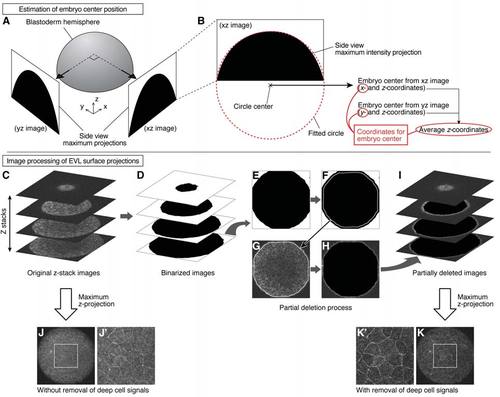
Estimation of Embryo Center Position and Measurement of EVL Surface Projections, Related to STAR Methods (A and B) Estimation of embryo center position. Side views of the animal pole hemisphere were obtained from two perpendicular directions in the two-photon microscope stack as maximum intensity projections (A). A circle was fitted along the arc of this hemisphere projection (red dotted line), and the center of the fitted circle was used to estimate the embryo center (B). (C-K) Image processing of EVL surface projections. Z-stack images obtained by two-photon microscopy were first processed by binarization (C and D). The outline of each image slice was detected and its size was reduced by the expected thickness of surface cells (E and F). The detected and reduced outline was applied to the original image slice, and the inner area of this outline was filled with black color (G and H). After processing the entire stack with this method, they were superimposed by maximum intensity projection (I). The resultant projection image shows clearer surface cell outlines compared to a projection image from an unprocessed stack. (J-K'). White rectangle regions in (J) and (K) are magnified in (J') and (K'), respectively. |
Reprinted from Developmental Cell, 40(4), Morita, H., Grigolon, S., Bock, M., Krens, S.F., Salbreux, G., Heisenberg, C.P., The Physical Basis of Coordinated Tissue Spreading in Zebrafish Gastrulation, 354-366.e4, Copyright (2017) with permission from Elsevier. Full text @ Dev. Cell