
- Title
-
Autonomy and Non-autonomy of Angiogenic Cell Movements Revealed by Experiment-Driven Mathematical Modeling
- Authors
- Sugihara, K., Nishiyama, K., Fukuhara, S., Uemura, A., Arima, S., Kobayashi, R., Köhn-Luque, A., Mochizuki, N., Suda, T., Ogawa, H., Kurihara, H.
- Source
- Full text @ Cell Rep.
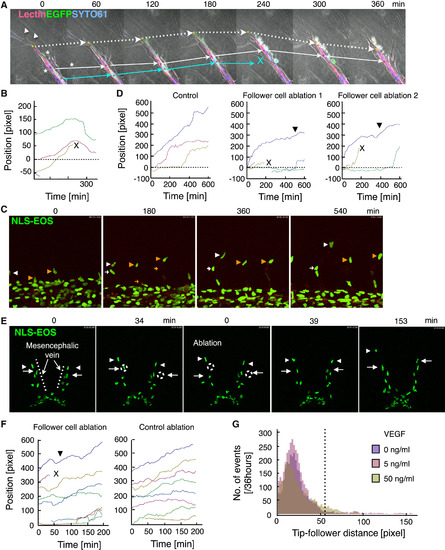
Experimental Assessments of Regulatory Mechanisms of Tip Cell Motility (A and B) An in vitro experiment. (A) Representative time-lapse images of mosaic analysis in the aortic ring assay are shown. After the death of the follower EC (the EC right behind the tip cell; green cell, blue arrow), the tip cell (white arrow) slowed its anterograde movement and then retracted. Dotted arrows indicate the tip of the elongating branch. Asterisks and arrowheads indicate mural cells and non-vascular cells, respectively. Dotted arrows indicate the tip of the elongating branch. See also Movie S6. (B) The trajectory analysis corresponding to (A) is shown. Trajectories of tip of the branch and the nuclei of the tip cell and the follower EC are indicated by green, purple, and brown lines, respectively. (C–F) In vivo experiments using zebrafish embryos. Representative time-lapse images of angiogenic EC behaviors in the intersegmental vessels (C, at 26 hpf) and the mesencephalic veins (E, dotted lines, at 30 hpf) of zebrafish embryos overexpressing NLS-EOS. Follower ECs in the growing vessels (orange arrows, C and the white dotted circle on the left, E) were laser-ablated 0.5 or 3 hr after imaging. In the experiment using mesencephalic veins (E), non-vascular tissues near the follower EC in the opposite vein also were laser-ablated to achieve a control ablation state (white dotted circle on the right). Arrowheads and arrows indicate tip cells and follower ECs, respectively. See also Movies S7 and S9. (D and F) Trajectory analyses corresponding to (C) and (E), respectively, are shown. Each colored line indicates the trajectory of an individual EC. In all trajectory analyses, times and positions were adjusted so that the observation period would begin at t = 0. x shows cell deaths. Closed arrowheads indicate the point at which the tip cells resume moving in the anterograde direction. (G) Distribution map of the distance between tip and follower cell nuclei at each time point for the 36-hr observation period in the in vitro experiments. The dotted line indicates the threshold d (55 pixels) in model 2. See also Figure S3 and Movies S8 and S10. |
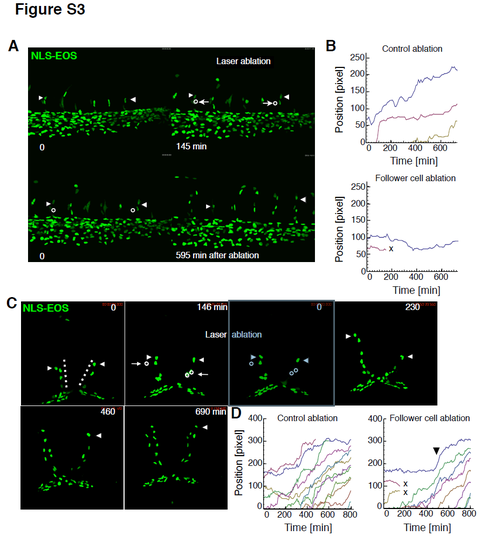
Experimental assessments of regulatory mechanisms of tip EC motility using zebrafish embryos, Related to Figure 7. Representative time-lapse images of angiogenic EC behaviours in the intersegmental vessels (A, at 26 hpf) and the mesencephalic veins (C, dotted line, at 30 hpf) of zebrafish embryos overexpressing NLS-EOS. Follower ECs in the growing vessels (left (A) and right (C) opened circles) (C) and non-vascular tissue near the follower ECs (right (A) and left (C) opened circles) were laser-ablated 2.5 to 3 hours after imaging. Arrowheads and arrows indicate tip ECs and the follower ECs, respectively. See also movies S8 and S10. (B, D) Trajectory analyses corresponding to A and C. In the trajectory analysis, time and positions were adjusted so that at the observation periods would begin at t = 0. “X” shows cell deaths. |